The Thirty-Third AAAI Conference on Artificial Intelligence (AAAI-19)
Region-Based Message Exploration over Spatio-Temporal Data Streams
Lisi Chen,
1Shuo Shang
2∗2UESTC, China 1,2Inception Institute of Artificial Intelligence, UAE 1[email protected] 2[email protected]
Abstract
Massive amount of spatio-temporal data that contain loca-tion and text content are being generated by localoca-tion-based social media. These spatio-temporal messages cover a wide range of topics. It is of great significance to discover lo-cal trending topics based on users’ location-based and topic-based requirements. We develop a region-topic-based message ex-ploration mechanism that retrieve spatio-temporal message clusters from a stream of spatio-temporal messages based on users’ preferences on message topic and message spatial dis-tribution. Additionally, we propose a region summarization algorithm that finds a subset of representative messages in a cluster to summarize the topics and the spatial attributes of messages in the cluster. We evaluate the efficacy and ef-ficiency of our proposal on two real-world datasets and the results demonstrate that our solution is capable of high effi-ciency and effectiveness compared with baselines.
Introduction
Massive amount of spatio-temporal data containing location, text, and time information are being generated on an un-precedented scale. Such type of data, which can be modelled as multimodal data streams, offer first-hand information for various kinds of local breaking news, bursty events, and gen-eral public concerns.
Due to the high arrival rate of spatio-temporal data streams and their vast topic coverage, it is of great interest for users to discover and monitor trending events and topics based on their preferred spatial and textual attributes. Ad-ditionally, end-users may want to effectively grab the key points of the spatio-temporal messages within a particular region. The problem of online spatial keyword search, which allows users to retrieve spatio-temporal messages (e.g., geo-tagged tweets) relevant to their queries has been studied by a number of research projects (Rocha-Junior et al. 2011; Hu et al. 2015a; Guo et al. 2015; Li et al. 2013). Through online spatial keyword search, users stay informed about lo-cal events, trending activities, public concerns, and so forth that happen around them. Moreover, users browse various types of location-aware news and information in a real-time fashion.
∗
Corresponding author.
Copyright c⃝2019, Association for the Advancement of Artificial Intelligence (www.aaai.org). All rights reserved.
The problems of existing studies of online spatial key-word search aim at finding a set of spatio-temporal messages as the result. In other words, users may receive all messages satisfying their pre-defined spatial and textual requirements. However, such item-based spatial keyword search has the following limitations. First of all, most of the users pre-fer receiving summary information that satisfies their in-terested topics and location-based patterns rather than re-ceiving a list of raw items (Farzindar and Khreich 2015; Tobler 1970). Secondly, users may receive a set of near-duplicate messages (Ozsoy, Onal, and Altingovde 2014), which greatly reduce the result diversity and topic cover-age. Thirdly, it is difficult for users to understand the key topics and the local distribution of a large number of result spatio-temporal messages within a few seconds. In particu-lar, besides informative messages, many messages on data streams are not related to any particular real-world events and are often exhibit low quality (e.g., spam messages) (He et al. 2007).
To address the above limitations, we develop a region-based message exploration mechanism that retrieve spatio-temporal message clusters (i.e., cluster regions) based on users’ preferences on message topic and message spatial dis-tribution (i.e., subscription region). Next, we devise a region summarization algorithm that finds a subset of representa-tive messages in a cluster to summarize the topics and the spatial attributes of messages in the cluster.
rele-vancy metric and the efficiency of our region summarization algorithm.
Problem Statement
We introduce the spatio-temporal message, the problem of region-aware publish/subscribe, and the problem of region summarization.
Definition 1: Spatio-Temporal Message. A spatio-temporal message is denoted bym=⟨ψ, ρ, tc⟩, whereψis textual information (i.e., a set of terms), ρis a coordinate represented by latitude and longitude on map, andtc is the timestamp indicating the publish time ofm. □ Spatio-temporal messages are ubiquitous in modern so-cial media. For instance, they can be tweets with location information, geo-tagged photos in Instagram, check-ins with textual messages in Foursquare, web news with geographi-cal information, etc. In our settings, the arrival rate of spatio-temporal messages is very high.
Region-aware publish/subscribe
Definition 2: Cluster Region. A cluster region cr is the minimum bounding rectangle of a spatio-temporal message cluster generated by a clustering algorithm. □ Note that our proposal does not depend on a specific clus-tering algorithm because it is important for applications to cope with the data from different types of resources and meet the requirements in various scenarios.
Definition 3: Subscription Region.A subscription region
sris represented by a rectangular region on the map. It re-trieves top-K cluster regions (i.e., a set of spatio-temporal messages) based on a relevancy metric (i.e.,rel(·)). □ We define the relevancy between a subscription regionsr and a cluster regioncrasrel(sr, cr). The relevancy metric
rel(·)should consider both the similarity of textual content and the relative locations of the messages in a region. Hence, we aim to develop an effective approach to learning the rel-evancy metric between a subscription region and a cluster region.
Region summarization
When a relevant cluster region is delivered to a subscription region, we propose to summarize the region of the cluster by selecting a subset of representative spatio-temporal mes-sages from the cluster region and display them on the map. In particular, the selection objective is to generate a sum-mary set by considering both representative and concise as-pects. It remains a challenge on selecting such a representa-tive set from messages in the region of each delivered cluster. Specifically, if we select a large number of messages as the summary set, users may be difficult in discovering the out-lined information of a region; Otherwise, it will be impos-sible to generate representative information because of data sparsity. We also need to avoid two messages located too close to each other (i.e., cartographic diversification (Sarma et al. 2012)) and avoid two messages who are temporally close to each other (i.e., query result diversification (Chen and Cong 2015)).
As a consequence, we need to consider the following selection criteria: (1) Summary set cardinality; (2)
Sum-mary representativeness; (3)Message spatial proximity
con-straint; (4)Message temporal proximity constraint. To
ad-dress criterion (1), we fix the cardinality of the summary set as k. For (2), we set it to be an optimization criterion. Specifically, we define theinformation coverageto measure
thestrength in summarizingof a summary set. We define
cri-teria (3) and (4) as constraints by enforcing the spatial prox-imity and temporal proxprox-imity between any two messages in a summary set should no less than a spatial proximity thresh-oldζand a temporal proximity thresholdδ, respectively. Definition 4: Region Summarization (RS) Problem. Given a cluster regioncr and an integern, letM be a set of spatio-temporal messages located incrandζbe a spatial proximity threshold. TheRSproblem finds a subsetNofM
such that: (1)|N|=n; (2)∀mi, mj ∈N,d(mi, mj)≥ζ; (3)∀mi, mj ∈N,|mi.tc−mj.tc| ≥δ; (4) Theinformation
coverageofN forM is maximized. □
Note that we useinformation coverage to measure how wellNcan representM, which is defined by Equation 1.
IC(N, M) =
1
|M|×
∑
mi∈M
max{mj∈N|S(mi, mj)},
(1) whereS(mi, mj)represents the spatio-textual similarity be-tweenmiandmj(Equation 2).
S(mi, mj) = α×P(mi.ρ, mj.ρ) + (1−α)
×T(mi.ψ, mj.ψ), (2)
whereP(mi.ρ, mj.ρ)denotes the spatial proximity score betweenmi.ρandmj.ρ,T(mi.ψ, mj.ψ)denotes the textual similarity betweenmi.ψandmj.ψ, andαis a preference pa-rameter ranging from 0 to 1 that balances the weight of spa-tial proximity and textual similarity. Equation 2 is a widely applied similarity measurement that takes both spatial and textual aspects into consideration (Chen et al. 2013).
Framework
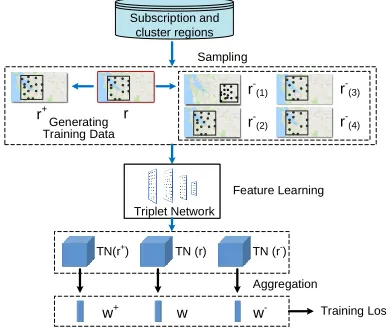
Figure 1 illustrates the framework of our region-based mes-sage exploration mechanism. We have two types of input data: (1) A stream of spatio-temporal messages published by location-based social media; (2) A set of subscription re-gions registered by users.
Subscription Index Spatio-temporal
messages
Cluster matching
Subscription region
...
General online clustering algorithm
Users
Relevance
metric learning cluster regionMatched representative setCluster
Subscription region Subscription
region
Cluster region summarization
Figure 1: Framework Overview
Relevancy Metric Learning
Inspired by Convolutional Neural Networks (CNNs) based metric learning, which exhibits excellent performance in im-age classification, we propose to use CNN for capturing re-gional spatial correlation among spatial-temporal messages. In particular, we develop a relevancy metric learning model based on triplet network, which learns a metric for comparing the spatio-textual relevancy between two regions by considering both spatial distribution and text similarity of messages in the regions (Hoffer and Ailon 2015; Liu, Zhao, and Cong 2018). To apply triplet network on spatio-temporal messages, we design an approach to generating training data with hard negative example mining (Wang, Lan, and Zhang 2017). Additionally, to make our model robust to data skew-ness, we use a normalized training loss, which bound the loss of each training tuple within[0, τ].
Settings of triplet network
This section presents our settings of the triplet network for learning a relevancy metric.
A triplet network, denoted by T N(·), contains the fol-lowing three instances of a shared CNN (Krizhevsky, Sutskever, and Hinton 2012): (1) A subscription instance
a; (2) A relevant instance a+; (3) An irrelevant instance a−. While inputting the above three instances,T N(·) cal-culates the following two values: (1)D(T N(a), T N(a+));
(2)D(T N(a), T N(a−)). Note thatD(·)represents the
Eu-clidean distance between the two instances andT N(ai) in-dicates the feature map ofaiin the last layer of the CNN. Be-cause that we are only interested in a feature embedding, it is not necessary for us to maintain the fully-connected layer in the CNN.
Existing study suggests that the objective of train-ing T N(·) is to enforce D(T N(a), T N(a+)) <
D(T N(a), T N(a−)) (Hoffer and Ailon 2015). The
objective function for trainingT N(·)can be formulated as follows:
λ∥T N(·)∥2+ N
∑
i=1
max{0,
D(T N(ai), T N(a+i))−D(T N(ai), T N(a−i)) +g},
(3)
where∥T N(·)∥2 denotes aL2regularization forT N(·),λ
is a parameter indicating the weight decay,Nis the number of the triplets of samples, andgrepresents the gap parameter between two distances.
Input of triplet network We discuss how to feed a region
R (i.e., R can be either a subscription region or a cluster region) into the triplet networkT R(·).
We represent Rby a set of grid squares, where the size of each square is pre-defined (e.g., 100 m2). Each square is
associated with a vector that sums up the attribute vector of each message located in the square. Note that the attribute vector contain textual (topic) and temporal information of a message. Here,Rcan be regarded as a 3-dimensional tensor
R∈Rx×y×t, wherex×ydenotes the spatial dimensions of the grid squares andtdemotes the attribute dimension.
Output of triplet network The output of the triplet net-work R is a feature map of T N(R), which can be rep-resented as a 3-dimensional tensor as well (i.e., R ∈
Rx
′×y′×d
k), whered
kdenotes the number of dimensions of the output features. Each dimension of the output feature is considered to be a latent feature with spatial information.
Since difference regions may have different values ofx
and y, how to compare feature maps with different sizes remains a challenge. To solve the problem, we add a fea-ture aggregation layer (i.e., fa(·)) at the end of T N(·). Such layer can aggregate all feature maps to their corre-sponding feature vectors with dk dimensions. Let w be the output of fa(R), we have w ∈ Rdk. After applying fa(·), the output distances, namely D(T N(a), T N(a+))
andD(T N(a), T N(a−)), can be formulated as follow:
D(T N(a), T N(a+)) =∥w−w+∥2, (4)
D(T N(a), T N(a−)) =∥w−w−∥2. (5)
Based on Equation 4, Equation 5, and the learned metric, we formulate the relevancy between a subscription region
srand the region of a clustercras a value in[0,1], which is presented as follows:
rel(sr, cr) =
1 1 +∥ws−wc∥2
, (6)
wherewsandwcrepresentsfa(sr)andfa(cr), respectively.
Sampling Subscription and
cluster regions
r r+
r -(1)
r -(2)
Triplet Network Triplet Network
TN (r) TN(r+
) TN (r
-)
w
w+ w- Training Loss
Generating Training Data
Aggregation Feature Learning
r -(3)
r-(4)
Training triplet network
This section presents how to train our triplet network on subscription and cluster regions. Two technical challenges exist in training triplet network. Firstly, we do not have groundtruth (labeled data) forrel(·). Secondly, the trained network must be able to resist small noise. To solve the first challenge, we generate “labeled region” from unlabeled training data (i.e., sampled regions) and learn their corre-spondingself-relevancy. To solve the second challenge, we develop a self-supervised learning mechanism that learns ro-bustrel(·)directly on the basis of the self-relevancy. Specif-ically, robustrel(·)is expected to regard regions that have slight differences as relevant. We proceed to present how to generate labeled regions as training data.
Generation of labeled regions At first, we randomly sam-ple existing subscription and cluster regions from the under-lying space. For each sampled regionr, we generater+and r−respectively.
To generater+, we add four types of noise tor: (1)
Ran-dom message insertion (i.e., insertingκ× |r|messages into
rat a random location); (2) Random message deletion (i.e., randomly removingκ× |r|messages fromr); (3) Random message move (i.e., moving each message inralong a ran-dom direction by a ranran-dom distance smaller than υ); (4) Random message time shift (i.e., changing the creation time of each message by a random value smaller thanσ). Here
|r| denotes the number of spatio-temporal messages in r,
κ∈(0,1),υ, andσare three noise indicators.
We generate four groups of r−. The first group of r−, denoted byr−(1), is generated by sampling regions from the underlying space that do not have overlapping area withr. The second groupr(2)− is generated by adding message
inser-tion/deletion noise tor+. The third groupr−(3)is generated
by adding message move noise tor+. The fourth groupr−(4), is generated by adding time shift noise tor+. The rationale of this quad generation is that most of the regions inr−(1)bear little resemblance tor, which may lower the determinative-ness of learned features, while the regions inr(2)− ,r−(3), and
r−(4)do have some relevancy towardsreven if it is smaller thanr+. As a result, such quad generation can enhance the
determinativeness of features learned by the model, which can substantially lower the loss.
Loss function Due to the skewness of spatial distribution for spatio-temporal messages, the loss of our triplet network can be highly skewed. Specifically, some training instances may have extremely large loss, which is inevitable to over-whelm other instances. A straightforward approach to re-solving this issue is normalising the cardinality of different regions. However, we are unable to acquire the number of messages in a region afterwards, which is regarded as very important information. For example, if we do not consider the region cardinality, a region containing 1,000 crime alert messages would be unreasonably regarded as similar to a region with 5 crime alert messages. Hence, we propose to modify the loss function by introducing a “normalization step”, which is presented as follows.
Loss=λ∥T N(·)∥2+ N
∑
i=1
max{0, D(T N(ai),T N(a+i))
D(T N(ai),T N(a+i))+D(T N(ai),T N(a−i))
−g}. (7)
Algorithm for Region Summarization
In this section, we first show our proof that theRS prob-lem is NP-hard. Next, we present our proposed algorithm for solving theRSproblem. Finally, we present the complexity and approximation analyses of our proposed algorithm. Theorem 1:TheRSproblem is NP-hard.Proof. The RS problem can be reduced from an existing NP-hard problem, the dominating set problem on a graph
G(V, E), which outputs whether there exists ak-subset of
vertices Vd ⊆ V such that: (1)∀vi ∈ V,vi ∈ Vd; or (2)
∃vj∈Vds.t.vi∈N eighbors(vj).
Let M be a set of spatio-temporal messages. We as-sume that ∀mi, mj ∈ M, d(mi, mj) ≥ ζ. We build a
RS problem to resolve a dominating set problem as fol-lows. Given the graphG(V, E), we map each vertexvi∈V to a spatio-temporal messagemi. Specifically, ifvi andvj are neighbors, we set S(mi, mj) = 1; Otherwise, we set
S(mi, mj) = 0.
Let Vd = {v0, v1, ...vn−1} be the result of an instance
of dominating set problem, andMs = {m0, m1, ...mn−1}
be the mapped result set, which can be considered to be the result of the RSproblem. Now we assume that|C| = ∑
mi∈Cmax{mj ∈ Ms|S(mi, mj)}, ∀mi ∈ C we have max{mj ∈ Ms|S(mi, mj)} = 1. Consequently, we have the following two situations: (1)mi∈Ms; (2)∃mj∈ Cs.t.
S(mi, mj) = 1. Because that for each vertexviwe have: (1)
vi ∈ Vd; or (2)vi ∈ N eighbors(vj)andvj ∈Vd, we can deduce thatVd is the result of the dominating set problem. As a result, theRSproblem is NP-hard.
□ Because of the NP-hardness of theRSproblem, it is im-possible to develop an efficient exact algorithm to resolve the problem. Nevertheless, it is possible to propose a approx-imate algorithm with a bounded ratio. Now we present our proposed approximate algorithm for theRSproblem with a proved approximate ratio.
unwanted candidates, which is defined by Lemma 1. Lemma 1:LetRandSbe two sets of spatio-temporal mes-sages whereR ⊆ Sandmnbe a new message. Assume that
R′denotesRwithm
n inserted andS′denotesS withmn inserted, we have the following inequation:
IC(R′,C)−IC(R,C)≥IC(S′,C)−IC(S,C).
Proof. Let’s assume that S(mn, mi) > max{mj ∈
R|S(mi, mj)} and S(mn, mi) > max{mj ∈
S|S(mi, mj)}. Because that IC(R,C) ≤ IC(S,C), we have S(mn, mi) − IC(R,C) ≥ S(mn, mi) −
IC(S,C). Hence, we havemax{mj ∈ R′|S(mi, mj)} −
max{mj ∈ R|S(mi, mj)} ≥max{mj ∈ R′|S(mi, mj)}
− max{mj ∈ R|S(mi, mj)}. Thus, we complete the
proof. □
Based on Lemma 1, we find that the increment of infor-mation coverage when we insertmnintoScannot be greater than the increment of information coverage when we insert
mn into R. In other words, the increment of information coverage will decrease as we proceed to execute the iter-ation. Therefore, to prune unnecessary candidate messages we propose to use the pruning strategy that works as follows: For each messagem, we record its increment of information coverage in each iteration by generating a triple entry{ϱ,δ,
ı}. In particular,m.ϱdenotes the pointer/id ofm,m.δ indi-cates the increment of information coverage when we insert
mnintoR, andm.ıis the iteration count.
Algorithm 1:GreedyRegionSummary (C,k,ζ,δ)
1 R ←empty; 2 P Q←empty;
3 foreachmi∈ Cdo
4 entry← {mi,IC({mi},C),0}; 5 P Q.Push(entry);
6 whileP Qis not emptyand|R|< kdo
7 cur←P Q.top(); 8 P Q.pop();
9 whilecur.ı̸=|R|do
10 cur.δ←SSInc(C,R,mn);
11 cur.ı← |R|;
12 P Q.push(cur); 13 cur←P Q.top(); 14 P Q.pop(); 15 R.add(cur.ϱ);
16 foreachmjinP Qdo
17 ifd(cur,mj)< ζor|cur.tc−mj.tc|< δthen 18 P Q.remove(mj);
19 returnR;
Algorithm 2 presents the corresponding pseudo code of our proposed greedy algorithm for theRSproblem. First, we initialize the result setRand the priority queueP Q(lines 1– 2). Next, for each spatio-temporal messagemi we generate its corresponding triple{mi, IC({mi,C),0}and push it into
P Q(lines 3–5). Note thatIC({mi,C),0}denotes the incre-ment of information coverage when we insertmi into the empty set R. After that, we generate the cluster summary set in an iterative fashion (lines 6–18). Specifically, at the
beginning of each iteration we fetch and pop the top triple fromP Q(lines 7–8). If the increment of information cover-age induced by the top triplecurhas not been computed yet (line 9), we need to compute it (line 10), update the iteration count (cur.ı) (line 11), and push it toP Q(line 12). Then we proceed to fetch and pop the top tripe (lines 13–14). If the increment of information coverage induced by the top triple
curhas already been computed, we add the corresponding message into the result set (line 15). At the same time, we need to remove the existing messages inP Qwhose distance to the current message is smaller thanζor whose temporal proximity is smaller thanδ(lines 16–18).
Experiments
We present the experiments with two datasets that offer in-sight into the effectiveness and efficiency of baselines and our proposed algorithms.
Experiment Setup
Dataset Our experiments are conducted on two real-life datasets: FS and TT. FS is a dataset collected from Foursquare, which contains 1.2 million POIs in North Amer-ica with location information (i.e., latitude and longitude). The dataset TT is a larger dataset that contains 40 million geo-tagged tweets in the U.S.A. with geographical point locations. Each POI or geo-tagged tweet is regarded as a spatio-temporal message. We train an Online Latent Dirich-let Allocation (OLDA) (AlSumait, Barbar´a, and Domeni-coni 2008) model using our datasets. Each message is as-sociated with a topic distribution vector.
Baselines We evaluate the effectiveness and efficiency of our triplet network for learning relevancy metric (denoted by TN) and our greedy algorithm for region summarization (denoted by GRS) by comparing against the following base-lines.
(1) SVSM (Sheng et al. 2010): SVSM can be applied for solving our problem. While computing the relevancy of two regions, we first derive the spatial feature vector for each re-gion, which is calculated based on the message topics in the region, the message locations, and the average distance be-tween messages and region reference points (i.e., vertices and center). Next, we computes the cosine similarity be-tween their vectors.
(2) SP (Lazebnik, Schmid, and Ponce 2006): SP, which is designed for image categorization, can be used for solving our problem as well. SP indexes the underlying space by a Quad-tree that recursively splits the space into four cells. To compute the relevancy between two regions, we firstly cal-culate the average cell-wise similarities in each level. Next, we aggregate the average similarities in all levels.
(3) Max-Sum, Max-Min (Drosou and Pitoura 2014): These two result diversification methods are widely used for selecting a set of most diverse messages. We compare GRS against Max-Sum and Max-Min. Note that the result set re-turned by the two methods may not satisfy our constraints defined in Definition 4.
0.2 0.4 0.6 0.8 1.0
0.05 0.1 0.15 0.2 0.25
10-RR
Parameter κ
SVSM SP TN (a) FS 0.2 0.4 0.6 0.8 1.0
0.05 0.1 0.15 0.2 0.25
20−RR
Parameter κ SVSM
SP TN
(b) TT
Figure 3: Effect ofκ(FS)
0.2 0.4 0.6 0.8 1.0
0.05 0.1 0.15 0.2 0.25
10−RR
Parameter κ SVSM SP TN (a) FS 0.2 0.4 0.6 0.8 1.0
0.05 0.1 0.15 0.2 0.25
20-RR
Parameter κ SVSM
SP TN
(b) TT
Figure 4: Effect ofκ(TT)
messagemfrom the messages located in the region. If in-sertingminto the current result set will break the constraints in Definition 4, we discardmand continue selecting the next message; Otherwise, we insertminto the result set. Once the size of the result set reachesn, we return the set as the result.
Settings For evaluating TN, we build a CNN that con-sists of 3 convolutional layers. The stride is set as 2×2. We use a ReLU non-linearity between two adjacent layers. The weight decay parameterλis set to be 5×10⁻⁵. The gap pa-rametergis 0.25. We train our model on 5000 generated in-stances. For generating each relevant instance, we randomly set the two noise indicators, namelyκandυ, between the ranges(0.05,0.35)and[1km,50km], respectively.
All of the algorithms are run in memory. We report the cpu time for efficiency evaluation and report “relevant ratio of top-kresult (k-RR)” for efficacy evaluation. In particu-lar, thek-RR measures the proportion of positive instances among the result set.
Experimental Result
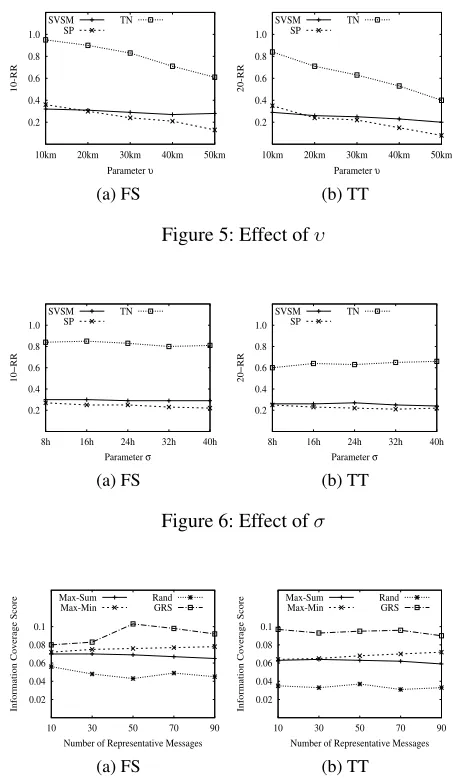
Effect of noise indicators In this set of experiments, we evaluate the effectiveness of SVSM, SP, and TN, by varying noise indicatorsκfrom 0.05 to 0.25,υfrom 10km to 50km, andσfrom 8h to 40h.
Based on Figures 3 and 4, We can see that the TN per-forms substantially better than SVSM and SP on both data-sets in terms of 10-RR and 20-RR when we varyκ. In ad-dition, we find that TN is more robust to noise compared with the other two baselines. Specifically, when we increase
κfrom 0.05 to 0.25, the 10-RR and 20-RR are only slightly reduced by 10% and 7.8%, respectively. While for SP, the 10-RR and 20-RR are moderately reduced by 22% and 31%,
0.2 0.4 0.6 0.8 1.0
10km 20km 30km 40km 50km
10-RR
Parameter υ
SVSM SP TN (a) FS 0.2 0.4 0.6 0.8 1.0
10km 20km 30km 40km 50km
20-RR
Parameter υ
SVSM SP
TN
(b) TT
Figure 5: Effect ofυ
0.2 0.4 0.6 0.8 1.0
8h 16h 24h 32h 40h
10−RR
Parameter σ SVSM SP TN (a) FS 0.2 0.4 0.6 0.8 1.0
8h 16h 24h 32h 40h
20−RR
Parameter σ SVSM
SP TN
(b) TT
Figure 6: Effect ofσ
0.02 0.04 0.06 0.08 0.1
10 30 50 70 90
Information Coverage Score
Number of Representative Messages Max-Sum
Max-Min RandGRS
(a) FS 0.02 0.04 0.06 0.08 0.1
10 30 50 70 90
Information Coverage Score
Number of Representative Messages Max-Sum
Max-Min RandGRS
(b) TT
Figure 7: Effect of # representative messages w.r.t. efficacy
10 100 1000 10000 100000
10 30 50 70 90
Runtime for Region Summarization (ms)
Number of Representative Messages Max-Sum
Max-Min RandGRS
(a) FS 10 100 1000 10000 100000
10 30 50 70 90
Runtime for Region Summarization (ms)
Number of Representative Messages Max-Sum
Max-Min RandGRS
(b) TT
Figure 8: Effect of # representative messages w.r.t. efficiency
0 40 80 120 160 200
10 40 70 100
Runtime for Region Summarization (ms)
Distance Threshold (m) Rand GRS
(a) FS
0 40 80 120 160 200
10 40 70 100
Runtime for Region Summarization (ms)
Distance Threshold (m) Rand GRS
(b) TT
Figure 9: Effect of distance threshold
Figure 5 shows the effectiveness performances of the three methods as we vary the other noise indicator υ. TN still has the best performance. Additionally, we find that 10-RR and 20-10-RR significantly decrease as we increaseυ. This is because that the increment ofυwill change the relative locations of messages, which may lower the relevancy. We also notice that SVSM does not exhibit a performance de-creasing trend as we increaseυ. The reason is that the rel-evancy metric of SVSM does not take the relative locations of messages into account.
Effect of the number of representative messages In this set of experiments, we investigate the effectiveness and effi-ciency with regard to the cardinality of representative mes-sage set. From Figure 7, we can see that all of the four methods demonstrate a stable trend for information cover-age score when we increase the size of representative mes-sage set. In particular, GRS produces the highest information coverage score. As for efficiency aspect (Figure 8), we can find that all the methods perform worse when we increase the number of representative messages in a region. The run-time performance of GRS is at least an order of magnitude better than Max-Min and Max-Sum, and it is only slightly worse than the random selection method (Rand).
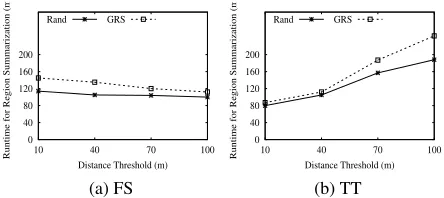
Effect of distance threshold We proceed to evaluate the effect of the distance threshold (i.e.,ζ) for region summa-rization algorithms. Figure 9 shows that when we increase the distance threshold for dataset FS, both GRS and Rand exhibit a slight decreasing trend regarding the runtime, while for dataset TT both methods exhibit a significant increasing trend. This can be explained by the fact that the density of messages in TT is much more higher than that in FS.
Related Work
Continuous query processing over spatio-temporal
data streams
Our problem is relevant to the location-based pub-lish/subscribe problem. Given a new spatio-temporal mes-sagemand a set of subscriptions, the location-based pub-lich/subscribe problem aims at finding a subset of subscrip-tions whose spatial and textual predicates matchm. Specif-ically, the subscriptions defined by some literature (Wang et al. 2015; Chen, Cong, and Cao 2013; Chen et al. 2014; Chen et al. 2017) require thatmfalls in a subscription
re-gion or m has overlapping area with the subscription re-gion (Li et al. 2013). While for others, a score that measures the spatial proximity between the query location and the lo-cation of a new spatio-temporal messagem(Hu et al. 2015a; Hu et al. 2015b; Chen et al. 2015; Chen and Shang 2018; Chen et al. 2018), or a score that measures the spatial over-lap between a continuous query and the region of a new spatio-temporal message (Yu et al. 2015), is calculated for matching process.
However, existing studies on location-based pub-lish/subscribe let subscriptions receive single-granularity items from data streams based on Boolean predicates or similarity function, which may not reflect the actual user preferences.
Online clustering and visualization algorithms for
text and geo-text streams
Threshold-based incremental clustering algorithm (Allan et al. 1998) is commonly used for detecting and track-ing news, bursty events, and trendtrack-ing topics over textual data streams (e.g., tweets) (Farzindar and Khreich 2015; Becker, Naaman, and Gravano 2011; Petrovic, Osborne, and Lavrenko 2010; Phuvipadawat and Murata 2010; Aggarwal and Yu 2006; Zhao, Chen, and Cong 2016; Tsur, Littman, and Rappoport 2013; Yin 2013). Specifically, given an ex-isting set of clusters, a stream of textual items (i.e., mes-sages), and a similarity threshold, the algorithm sequentially evaluates each new message and find a cluster that has the highest similarity score towards each message. However, if the similarities between a message and all existing clusters are less than the threshold, the message will form a new cluster. Compared to the other online text clustering algo-rithms (e.g., online k-means algorithm), the threshold-based incremental clustering algorithm often produces higher ef-ficiency. Additionally, it guarantees a real-time clustering result, which is important for modern online social media apps (Zhang, Chan, and Tan 2014). Zhong (Zhong 2005) de-velops an online text clustering algorithm based on the
clas-sick-means named the online spherical k-means (OSKM)
algorithm. The key idea of OSKM algorithm is to partition a data stream into segments. Because that the size of each segment is relatively small, it can be processed efficiently in main memory. Nevertheless, the k-means based cluster-ing algorithms require the number of clusters to be defined in advance, which is unreasonable for streaming data since the number of bursty events and trending topics is unknown. Furthermore, k-means based clustering algorithms are im-possible to generate real-time results.
Conclusion
efficacy and efficiency.
References
Aggarwal, C. C., and Yu, P. S. 2006. A framework for clustering massive text and categorical data streams. InSDM, 479–483. Allan, J.; Carbonell, J. G.; Doddington, G.; Yamron, J.; and Yang, Y. 1998. Topic detection and tracking pilot study final report. AlSumait, L.; Barbar´a, D.; and Domeniconi, C. 2008. On-line LDA: adaptive topic models for mining text streams with applica-tions to topic detection and tracking. InICDM, 3–12.
Becker, H.; Naaman, M.; and Gravano, L. 2011. Beyond trending topics: Real-world event identification on twitter. InProceedings of
the Fifth International Conference on Weblogs and Social Media.
Chen, L., and Cong, G. 2015. Diversity-aware top-k pub-lish/subscribe for text stream. InSIGMOD, 347–362.
Chen, L., and Shang, S. 2018. Approximate spatio-temporal top-k publish/subscribe.World Wide Web1–23.
Chen, L.; Cong, G.; Jensen, C. S.; and Wu, D. 2013. Spatial key-word query processing: an experimental evaluation. In PVLDB, 217–228.
Chen, L.; Cui, Y.; Cong, G.; and Cao, X. 2014. SOPS: A system for efficient processing of spatial-keyword publish/subscribe. PVLDB
7(13):1601–1604.
Chen, L.; Cong, G.; Cao, X.; and Tan, K. 2015. Temporal spatial-keyword top-k publish/subscribe. InICDE, 255–266.
Chen, Z.; Cong, G.; Zhang, Z.; Fu, T. Z. J.; and Chen, L. 2017. Dis-tributed publish/subscribe query processing on the spatio-textual data stream. InICDE, 1095–1106.
Chen, L.; Shang, S.; Zhang, Z.; Cao, X.; Jensen, C. S.; and Kalnis, P. 2018. Location-aware top-k term publish/subscribe. InICDE, 749–760.
Chen, L.; Cong, G.; and Cao, X. 2013. An efficient query indexing mechanism for filtering geo-textual data. InSIGMOD, 749–760. Drosou, M., and Pitoura, E. 2014. Diverse set selection over dy-namic data.IEEE Trans. Knowl. Data Eng.26(5):1102–1116. Farzindar, A., and Khreich, W. 2015. A survey of techniques for event detection in twitter. Computational Intelligence31(1):132– 164.
Guo, L.; Zhang, D.; Li, G.; Tan, K.; and Bao, Z. 2015. Location-aware pub/sub system: When continuous moving queries meet dy-namic event streams. InSIGMOD, 843–857.
Guo, T.; Feng, K.; Cong, G.; and Bao, Z. 2018. Efficient selection of geospatial data on maps for interactive and visualized explo-ration. InSIGMOD, 567–582.
He, Q.; Chang, K.; Lim, E.; and Zhang, J. 2007. Bursty feature representation for clustering text streams. InSDM, 491–496.
Hoffer, E., and Ailon, N. 2015. Deep metric learning using triplet network. InSIMBAD, 84–92.
Hu, H.; Liu, Y.; Li, G.; Feng, J.; and Tan, K. 2015a. A location-aware publish/subscribe framework for parameterized spatio-textual subscriptions. InICDE, 711–722.
Hu, J.; Cheng, R.; Wu, D.; and Jin, B. 2015b. Efficient top-k sub-scription matching for location-aware publish/subscribe. InSSTD, 333–351.
Krizhevsky, A.; Sutskever, I.; and Hinton, G. E. 2012. Imagenet classification with deep convolutional neural networks. InNIPS, 1106–1114.
Lazebnik, S.; Schmid, C.; and Ponce, J. 2006. Beyond bags of features: Spatial pyramid matching for recognizing natural scene categories. InCVPR, 2169–2178.
Li, G.; Wang, Y.; Wang, T.; and Feng, J. 2013. Location-aware publish/subscribe. InKDD, 802–810.
Liu, Y.; Zhao, K.; and Cong, G. 2018. Efficient similar region search with deep metric learning. InKDD, 1850–1859.
Ozsoy, M. G.; Onal, K. D.; and Altingovde, I. S. 2014. Result diversification for tweet search. InWISE, 78–89.
Petrovic, S.; Osborne, M.; and Lavrenko, V. 2010. Streaming first story detection with application to twitter. InHLT-NAACL, 181– 189.
Phuvipadawat, S., and Murata, T. 2010. Breaking news detection and tracking in twitter. InWeb Intelligence/IAT Workshops, 120– 123.
Rocha-Junior, J. B.; Gkorgkas, O.; Jonassen, S.; and Nørv˚ag, K. 2011. Efficient processing of top-k spatial keyword queries. In
SSTD, 205–222.
Sarma, A. D.; Lee, H.; Gonzalez, H.; Madhavan, J.; and Halevy, A. Y. 2012. Efficient spatial sampling of large geographical tables.
InSIGMOD, 193–204.
Sheng, C.; Zheng, Y.; Hsu, W.; Lee, M.; and Xie, X. 2010. An-swering top-ksimilar region queries. InDASFAA, 186–201. Tobler, W. R. 1970. A computer movie simulating urban growth in the detroit region. InEconomic geography 46, 234–240.
Tsur, O.; Littman, A.; and Rappoport, A. 2013. Efficient clustering of short messages into general domains. InICWSM.
Wang, X.; Zhang, Y.; Zhang, W.; Lin, X.; and Wang, W. 2015. Ap-tree: Efficiently support continuous spatial-keyword queries over stream. InICDE, 1107–1118.
Wang, C.; Lan, X.; and Zhang, X. 2017. How to train triplet net-works with 100k identities? InICCV Workshops, 1907–1915. Yin, J. 2013. Clustering microtext streams for event identification.
InIJCNLP, 719–725.
Yu, M.; Li, G.; Wang, T.; Feng, J.; and Gong, Z. 2015. Efficient filtering algorithms for location-aware publish/subscribe. IEEE
Trans. Knowl. Data Eng.27(4):950–963.
Zhang, D.; Chan, C.; and Tan, K. 2014. An efficient pub-lish/subscribe index for ecommerce databases. PVLDB7(8):613– 624.
Zhao, K.; Chen, L.; and Cong, G. 2016. Topic exploration in spatio-temporal document collections. InSIGMOD, 985–998. Zhong, S. 2005. Efficient streaming text clustering. Neural