R E S E A R C H
Open Access
Assessment of above- and belowground
carbon pools in a semi-arid forest
ecosystem of Delhi, India
Archana Meena
1*, Ankita Bidalia
2, M. Hanief
3, J. Dinakaran
2and K. S. Rao
2Abstract
Background:Assessment of carbon pools in semi-arid forests of India is crucial in order to develop a better action plan for management of such ecosystems under global climate change and rapid urbanization. This study, therefore, aims to assess the above- and belowground carbon storage potential of a semi-arid forest ecosystem of Delhi.
Methods:For the study, two forest sites were selected, i.e., north ridge (NRF) and central ridge (CRF). Aboveground tree biomass was estimated by using growing stock volume equations developed by Forest Survey of India and specific wood density. Understory biomass was determined by harvest sampling method. Belowground (root) biomass was determined by using a developed equation. For soil organic carbon (SOC), soil samples were collected at 0–10-cm and 10–20-cm depth and carbon content was estimated.
Results:The present study estimated 90.51 Mg ha−1biomass and 63.49 Mg C ha−1carbon in the semi-arid forest of Delhi, India. The lower diameter classes showed highest tree density, i.e., 240 and 328 individuals ha−1(11–20 cm), basal area, i.e., 8.7 (31–40 cm) and 6.08 m2ha−1(11–20 cm), and biomass, i.e., 24.25 and 23.57 Mg ha−1(11–20 cm) in NRF and CRF, respectively. Furthermore, a significant contribution of biomass (7.8 Mg ha−1) in DBH class 81–90 cm in NRF suggested the importance of mature trees in biomass and carbon storage. The forests were predominantly occupied by Prosopis juliflora (Sw.) DC which also showed the highest contribution to the (approximately 40%) tree biomass. Carbon allocation was maximum in aboveground (40–49%), followed by soil (29.93–37.7%), belowground or root (20–22%), and litter (0.27–0.59%).
Conclusion: Our study suggested plant biomass and soils are the potential pools of carbon storage in these forests. Furthermore, carbon storage in tree biomass was found to be mainly influenced by tree density, basal area, and species diversity. Trees belonging to lower DBH classes are the major carbon sinks in these forests. In the study, native trees contributed to the significant amount of carbon stored in their biomass and soils. The estimated data is important in framing forest management plans and strategies aimed at enhancing carbon sequestration potential of semi-arid forest ecosystems of India.
Keywords:Semi-arid forest, Carbon pool, Forest management, Species composition, Basal area, Carbon allocation pattern
© The Author(s). 2019Open AccessThis article is distributed under the terms of the Creative Commons Attribution 4.0 International License (http://creativecommons.org/licenses/by/4.0/), which permits unrestricted use, distribution, and reproduction in any medium, provided you give appropriate credit to the original author(s) and the source, provide a link to the Creative Commons license, and indicate if changes were made.
* Correspondence:archanam417@gmail.com
1Department of Botany, University of Rajasthan, Jaipur, Rajasthan 302004,
India
Introduction
Forests play a significant role in the global carbon (C) cycle and they store large quantities of C in vegetation and soil (Pan et al. 2011). For example, forests store 638 Gt of C in their ecosystem, with 238 Gt in biomass, which accounts for 80% of biomass C of terrestrial vege-tation (FAO2005). Arid and semi-arid regions cover ap-proximately 47% of the earth’s surface with an area of
6.5 million km2 and 4357 Mha of global forest cover
(Bastin et al. 2017). The combined effect of climate
change and increase in human population will result in se-vere droughts, desertification, and land degradations in these ecosystems (Huang et al.2012,2016). This will fur-ther affect the productivity, biodiversity, soil fertility, and organic matter composition which in turn reduces their C storage and sequestration potential. Among the different abiotic factors, soil water availability is considered as a sig-nificant variable controlling the soil C storage in arid and
semi-arid ecosystems (Meza et al. 2018). Management
strategies focusing on the C sequestration by restoring the existing vegetation would be effective in mitigating climate change and its effects on these ecosystems (Malagnoux et al. 2007). To date, only a few studies on biomass and C pools have been carried out in these ecosystems (Bonino 2006; Wagner et al.2015).
According to good practice guidance developed by the Intergovernmental Panel on Climate Change (IPCC), the total C stock in any forest ecosystem is derived from aboveground biomass (AGB), belowground biomass (BGB) or roots, forest floor litter biomass (LB) or de-tritus pool, wood debris, and soil organic matter (SOM). Therefore, assessment of C stored in these different pools is crucial to develop a new conservation policy related to C sequestration and combat climate change. AGB and BGB are the living pools of C in forests, which contributes a significant amount of C to the terrestrial ecosystem
(Eggleston et al. 2006). The LB contributes only a
small fraction of C to the terrestrial pool and hence considered as a minor pool (Ravindranath and Ost-wald 2008). The largest and very important C pool in the terrestrial ecosystem is SOM, which contains soil organic carbon (SOC) and plays a great role in the cycling of nutrients and C between the lithosphere
and atmosphere (Lal 2005). C pools in various forest
ecosystems are strongly influenced by temperature, rainfall, topography (Vayreda et al. 2012), forest type
and structure (Wei et al. 2013), tree species
compos-ition (Hu et al. 2015), species diversity (Arasa-Gisbert
et al. 2018), land use changes, and human-induced
disturbances (Canadell et al. 2007). An estimation of
the existing pools of C in different forest types is hence required in order to make necessary manage-ment strategies related to C sequestration and storage
(Johnson and Kern 2002).
Around 3.2 million km2
, i.e., 12% of the geographical area, is covered by arid zones of India. In India, biomass and C stock has been reported for various ecosystems based on growing stock volume (GSV) data of forest inventories and appropriate conversion factor related to
both biomass and C (Ravindranath et al. 1997; Lal and
Singh 2000; Chhabra et al. 2002; Manhas et al. 2006;
Sharma et al. 2010; Chaturvedi et al. 2011; Dar and
Sundarapandian 2015; Salunkhe et al. 2018). However,
most of these studies are limited to mainly tropical and temperate ecosystems of India and a very little infor-mation is available from semi-arid forests.
Moreover, the urban ecosystem in urban areas plays a dynamic role in reducing air pollution and sequestration of atmospheric carbon dioxide (CO2) in their vegetation
biomass and soils. Delhi, considered as one of the most polluted cities in the world, has a unique forest ecosys-tem located on ridges. The ridge areas are the extensions of Aravalli hills in Delhi with a length of 32 km and serve various ecological, environmental, and social func-tions. Delhi ridge has been notified as reserved forest, managed mainly with the objectives of increasing the
forest cover, biodiversity, conservation by public
participation, reduction in monoculture plantations, and encroachments. Both north and central ridge forests alone occupied almost 80% of the total forest area of Delhi. The growing urbanization has led to complete loss of the vegetation and only a few areas of the forests have been protected in Delhi. The regeneration of vegetation is further prevented due to excessive grazing and encroachments. Since it is very difficult to increase forest cover in such developed areas, the C sequestration
potential of these forests can be enhanced by
implementing some management strategies focusing on conservation of forests. However, there is a lack of infor-mation on biomass and C pools of this unique forest ecosystem in Delhi. Thus, the main aim of this study was to assess the above- and belowground pools of C in a semi-arid forest ecosystem of Delhi. The present study has the following objectives: (1) to estimate the C stock in different components (C pools) of a semi-arid forest ecosystem of Delhi, (2) to estimate the C alloca-tion pattern in different pools, and (3) to analyze vari-ous factors influencing the C storage pattern in these components.
Methods
Study area
recent origin. About 25% of the total area of NCT is in rural and the remaining 75% is urban. As per Census India 2011, the population of Delhi is 16.8 million with a dec-adal growth of 21.21%. As per the Land Use Statistics,
Ministry of Agriculture, Government of India (2013–
2014), net sown area, current fallow, and culturable waste-land is 221.4, 119, and 98.9 km2covering 15%, 8.07%, and 6.71% of its total geographical area, respectively. Forest’s land use covers 14.8 km2with 1% of the total geographical area. A major chunk of land, i.e., 927 km2 representing 62.85%, is not available for agriculture. With rapid urbanization in Delhi, there is a continuous decrease in rural area and agricultural land.
Delhi ridge which is the extension of Aravalli hills is estimated to be 2.4 billion years old. The ridge recorded a massive afforestation during nineteenth century and has been notified as reserved forests under the Indian Forest Act, 1927. However, due to rapid urbanization, there was a decrease in ridge forest area between 1920 and 1930. The ridge forest was, then again, declared as re-serve forest in 1980 in order to limit the anthropogenic ac-tivities. At present, the recorded forest area of Delhi state is 102 km2, which constitute 6.88% of its geographical area, with reserve and protected forests comprising 76.48% and 23.52% of total forest area, respectively (FSI 2017). The forest type is tropical thorny forest (Champion and Seth 1968). The vegetation is mainly dominated by middle storied thorny trees with open patches having scattered distribution. The soil type on the ridge has been reported as sandy loam to loam (Chibbar 1985). Prosopis juliflora (Sw.) DC, an exotic species, is the dominant tree in the forest. Acacia nilotica (L.) Delile, Acacia leucophloea (Roxb.) Willd.,Salvadora oleoidesDecne, andCassia fistula L. are among the commonly found native trees (Sinha 2014; Meena et al.2016). The commonly growing shrubs in the forests are Justicia adhatoda L.,Capparis sepiaria L., Carissa spinarumL.,Jatropha gossypifoliaL., andOpuntia dilleniiL. Two sites were selected for this study, (1) north ridge forest (NRF) and (2) central ridge forest (CRF). The NRF has an area of 87 ha and situated at 28° 36′latitudes and 77° 41′E longitudes. The CRF has an area of 864 ha and situated at 28° 41′latitudes and 77° 12′E longitudes. The climate of the study area is semi-arid and characterized by hot-dry summers (April to June), monsoon (July to October) and cool-dry winters (November to January). The study area received a total annual precipitation of 720 mm with 31 and 19 °C as mean maximum and minimum air temperature during 2012 (IMD, 2012). About 87% of the total rain was received during the monsoon. The soil in the study sites are dry and sandy in nature.
Phytosociology of the study sites
A total of 15 and 25 plots of 10 × 10 m were laid randomly in NRF and CRF sites respectively. The
phytosociological data of the study sites were collected during August and September in the year 2012. All the
trees with the diameter ≥10 cm DBH (1.37 m above
from the base) occurring in each plot were measured and identified to the species level. All the trees were considered as individuals as per Knight (1975) and indi-viduals with DBH < 10 cm were recorded as seedling/
saplings (Pande et al. 1988). The phytosociological
parameters were evaluated using the standard methods suggested by Misra (1968). Tree density (TD) was estimated by dividing the total number of individuals of a species with a total number of quadrats studied. The basal area (BA) of each tree was calculated as the ratio of CBH2(squared circumference at breast height) to 4π.
Estimation of tree biomass and C stock
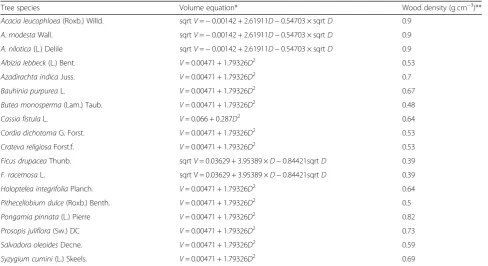
To determine the aboveground tree biomass (AGTB), the GSV (m3ha−1) of each species was first estimated by using volume tables or equations (Table1), determined by
For-est Survey of India (FSI 1996). These equations were
developed using multiple regression methods considering the DBH along with tree height or form factor. For the trees where volume equations were not available, the general or local area-based equations were used. The esti-mated GSV of the tree was then converted to AGTB (Mg ha−1) by multiplying GSV with specific wood density (g cm−3) of the respective species (Rajput et al.1996). Global wood density database was used for species-specific wood density values (Chave et al.2009; Zanne et al.2009). The BGB (fine and coarse roots) was estimated using regres-sion equations suggested by Cairns et al. (1997) as:
BGB Mg ha−1¼ expf−1:059þ0:884 ln AGBð Þ þ0:284g
The total tree biomass (TB) (Mg ha−1) is described as the sum of AGB and BGB.
Understory biomass
Litter biomass (LB)
The forest LB was estimated by collecting the litter at quarterly interval using specially designed plastic trays, laid randomly within 10 × 10 m quadrat and pooled for further analysis. The fresh weight of the litter (leaves and branches) was taken in the field. The representative samples were brought to the laboratory where the samples were oven dried at 65 °C for 48 h and subse-quently the dry weight was measured.
Soil organic carbon (SOC)
Soil samples were collected during the same period from each plot at two depths, i.e., 0–10 and 10–20 cm. The soil samples were collected randomly from three points from each plot and a composite was made. For SOC analysis, the soil samples were dried at 50 °C for 24 h and sieved through a 2-mm sieve. The sieved samples were further ground in a mortar with pestle and then analyzed using CHNS Analyzer (Elementar vario).
For bulk density, undisturbed soil samples were collected with a soil corer of known volume (31.4 cm3) which was inserted at 0–10 and 10–20-cm depth. The soil samples were oven dried at 105 °C for 72 h and the dry weight was measured. The coarse rock fragments if present in the soil were separated and weighed. SOC stock was calculated for each layer from 0 to 10 cm and 10–20-cm depth based on the bulk density and SOC concentration by using the following equation:
SOC stock Mg C ha−1¼KdBDSOCð Þ % CF10
whereKdis the depth of soil (cm), BD is the bulk
den-sity (g cm−3), SOC (%) is soil organic carbon, and CF is a correction factor for coarse fragments (> 2-mm particles) (Borah et al.2015).
Estimation of C stock
The C stock of the tree species was determined as:
Carbon Mg C ha−1¼Biomass Mg ha−1C%
where C is the carbon concentration of the
corre-sponding vegetation. Since it was difficult to separate the different components of the tree forCestimation, a uni-versal coefficient of 0.475 was used for treeCestimation
(Raghubanshi 1991; Singh and Chand 2012), indicating
approximately 47.5% of C in dry plant biomass
(West-lake1963). The understory (shrubs and herbs) and forest LB was estimated to be 50% of the biomass (Dar and
Sundarapandian2015).
The total ecosystemCwas taken as the sum of C con-tent in all the pools, i.e., AGB, BGB, SB, HB, LB, and SOC.
Statistical analysis
All the statistical analyses were done using the SPSS software package (SPSS version 16, SPSS Inc., Chicago 1 L, USA). The independentttests were performed to test Table 1Volume equation and wood density of tree species
Tree species Volume equation* Wood density (g cm−3)**
Acacia leucophloea(Roxb.) Willd. sqrtV=−0.00142 + 2.61911D−0.54703 × sqrtD 0.9
A. modestaWall. sqrtV=−0.00142 + 2.61911D−0.54703 × sqrtD 0.9
A. nilotica(L.) Delile sqrtV=−0.00142 + 2.61911D−0.54703 × sqrtD 0.9
Albizia lebbeck(L.) Bent. V= 0.00471 + 1.79326D2 0.53
Azadirachta indicaJuss. V= 0.00471 + 1.79326D2 0.7
Bauhinia purpureaL. V= 0.00471 + 1.79326D2 0.67
Butea monosperma(Lam.) Taub. V= 0.00471 + 1.79326D2 0.48
Cassia fistulaL. V= 0.066 + 0.287D2 0.64
Cordia dichotomaG. Forst. V= 0.00471 + 1.79326D2 0.53
Crateva religiosaForst.f. V= 0.00471 + 1.79326D2 0.53
Ficus drupaceaThunb. sqrtV= 0.03629 + 3.95389 ×D−0.84421sqrtD 0.39
F. racemosaL. sqrt V = 0.03629 + 3.95389 ×D−0.84421sqrtD 0.39
Holoptelea integrifoliaPlanch. V= 0.00471 + 1.79326D2 0.64
Pithecellobium dulce(Roxb.) Benth. V= 0.00471 + 1.79326D2 0.5
Pongamia pinnata(L.) Pierre V= 0.00471 + 1.79326D2 0.82
Prosopis juliflora(Sw.) DC V= 0.00471 + 1.79326D2 0.73
Salvadora oleoidesDecne. V= 0.00471 + 1.79326D2 0.59
Syzygium cumini(L.) Skeels. V= 0.00471 + 1.79326D2 0.69 *(FSI1996)
the significant differences in TD, BA, AGTB, BGB, SB, HB, and C content between NRF and CRF. For SOC, the significance was tested between the two forest sites and at different depths among a forest. The significance was tested atp< 0.05.
Results
Forest’s tree stand and biomass
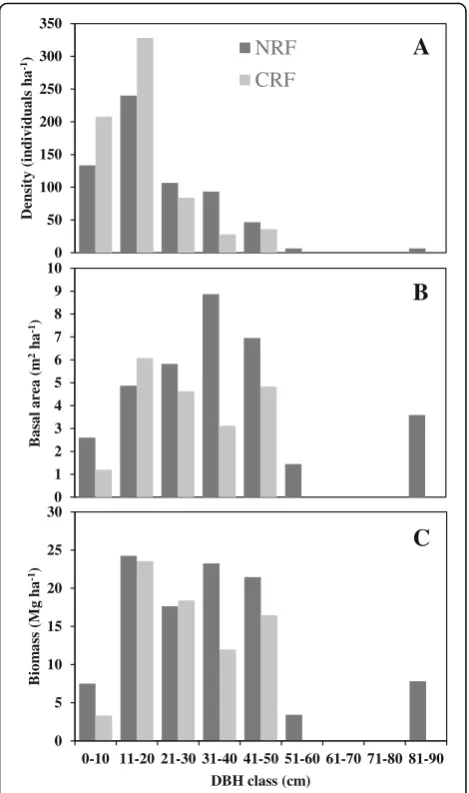
TD and BA in different DBH classes are shown in Fig.1a and b, respectively. While the total TD was high in the CRF (684 individuals ha−1) than NRF (633 individuals ha−1), most of the trees in CRF are distributed in lower DBH classes. In NRF, the distribution of the trees on the basis of the DBH class was wider with comparatively higher TD in DBH above 60 cm. In both the sites, indi-viduals within diameter class 11–20 cm were dominated
with TD of 240 and 328 individuals ha−1 in NRF and
CRF, respectively. The maximum BA was contributed by individuals in DBH class 31–40 cm (8.87 m2ha−1) in NRF and 11–20 cm (6.08 m2ha−1) in CRF site. The dis-tribution of TB in different DBH classes is shown in Fig. 2c. The maximum biomass was observed for trees
belonging to DBH class 11–20 cm in both NRF (24.25
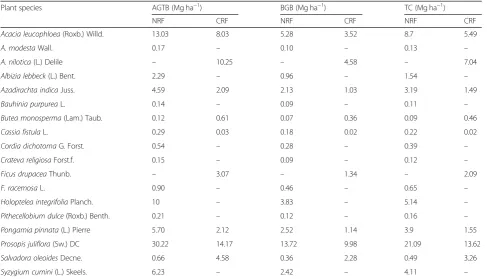
Mg ha−1) and CRF (23.57 Mg ha−1). The species-wise contribution to the TB in both forests is given in Table2. Highest contribution (~ 40%) was observed byP. juliflora, having maximum biomass at both sites (44.39 and 28.68 Mg ha−1in NRF and CRF, respectively). The other associ-ated tree species also contribute significantly to the total TB like Acacia leucophloea (18.31 and 11.55 Mg ha−1 in NRF and CRF, respectively),Pongamia pinnata(L.) Pierre (8.22 and 3.26 Mg ha−1in NRF and CRF, respectively), and Azadirachta indica Juss. (6.72 and 3.12 Mg ha−1 in NRF and CRF, respectively).
Biomass in different components or pools
The biomass in the different components of the two
dif-ferent study sites is given in Table 3. The AGTB for
NRF and CRF was estimated as 75.24 and 44.95 Mg ha−1
and BGB was 32.61 and 24.25 Mg ha−1, respectively
(Table 3). The TB, AGTB, and BGB were significantly
different between the two forest sites (p< 0.05). The understory biomass (shrubs and herbs) was 1.63 and
1.29 Mg ha−1in NRF and CRF, with a mean of 1.46 Mg
ha−1. The SB was estimated to be 1.15 and 0.80 Mg ha−1 in NRF and CRF, with a mean of 0.98 Mg ha−1. The HB ranged from 0.48 to 0.49 Mg ha−1in NRF and CRF, with
a mean of 0.49 Mg ha−1. However, we did not find a
significant difference (p> 0.05) for the biomass of SB and HB between the two forests. The forest LB was significantly higher in CRF (0.64 Mg ha−1) as compared to NRF (0.40 Mg ha−1), with the mean of 0.52 Mg ha−1.
0 50 100 150 200 250 300 350
a
h
sl
a
u
di
vi
d
ni
(
yti
s
ne
D
-1)
A
NRFCRF
0 1 2 3 4 5 6 7 8 9 10
Bas
a
l are
a
(m
2ha -1)
B
0 5 10 15 20 25 30
0-10 11-20 21-30 31-40 41-50 51-60 61-70 71-80 81-90
Bi
om
as
s (M
g
h
a
-1)
DBH class (cm)
C
Fig. 1Distribution of treeadensity,bbasal area, andcbiomass in
DBH classes. DBH diameter at breast height, NRF north ridge forest, CRF central ridge forest
Fig. 2Contribution of carbon in different pools. AGB aboveground
Allocation pattern of C in different pools
The C content in different compartments (pools) in both forests is given in Table4and the pattern of allocation is
shown in Fig. 2. Maximum C allocation was observed in
AGB pool (sum of AGTB, SB, and HB) contributing 49.02 and 40.54% in NRF and CRF, respectively, to the total for-est C stock. This was followed by SOC pool, with an allo-cation of 29.93 and 37.7% in NRF and CRF, respectively. BGB contributed 20.77 and 21.26% of C in NRF and CRF, respectively, followed by LB with an allocation of 0.27 and 0.59% of C in NRF and CRF, respectively. Within the se-lected forest sites, the C storage was found to be high in AGB (36.56 Mg C ha−1), BGB (15.49 Mg C ha−1), and SOC (74.57 Mg C ha−1), pools in NRF than CRF, whereas the C
storage in the LB was high in CRF (0.32 Mg C ha−1) as compared to NRF (0.2 Mg C ha−1).
SOC was found to be high in upper (0–10 cm) as com-pared to lower soil layers (10–20 cm) in both forest sites
(Table 5). The SOC stock at 0–10-cm depth was
esti-mated to be 26.60 and 24.36 Mg C ha−1in NRF and CRF sites, respectively. The SOC stock at 10–20-cm depth was estimated to be 18.04 and 16.50 Mg C ha−1in NRF and CRF sites, respectively. The mean SOC stock from 0 to 20-cm depth was estimated to be 22.32 and 20.43 Mg C ha−1 for NRF and CRF sites, respectively. The SOC stock both in Table 2Biomass and carbon content in different tree species
Plant species AGTB (Mg ha−1) BGB (Mg ha−1) TC (Mg ha−1)
NRF CRF NRF CRF NRF CRF
Acacia leucophloea(Roxb.) Willd. 13.03 8.03 5.28 3.52 8.7 5.49
A. modestaWall. 0.17 – 0.10 – 0.13 –
A. nilotica(L.) Delile – 10.25 – 4.58 – 7.04
Albizia lebbeck(L.) Bent. 2.29 – 0.96 – 1.54 –
Azadirachta indicaJuss. 4.59 2.09 2.13 1.03 3.19 1.49
Bauhinia purpureaL. 0.14 – 0.09 – 0.11 –
Butea monosperma(Lam.) Taub. 0.12 0.61 0.07 0.36 0.09 0.46
Cassia fistulaL. 0.29 0.03 0.18 0.02 0.22 0.02
Cordia dichotomaG. Forst. 0.54 – 0.28 – 0.39 –
Crateva religiosaForst.f. 0.15 – 0.09 – 0.12 –
Ficus drupaceaThunb. – 3.07 – 1.34 – 2.09
F. racemosaL. 0.90 – 0.46 – 0.65 –
Holoptelea integrifoliaPlanch. 10 – 3.83 – 5.14 –
Pithecellobium dulce(Roxb.) Benth. 0.21 – 0.12 – 0.16 –
Pongamia pinnata(L.) Pierre 5.70 2.12 2.52 1.14 3.9 1.55
Prosopis juliflora(Sw.) DC 30.22 14.17 13.72 9.98 21.09 13.62
Salvadora oleoidesDecne. 0.66 4.58 0.36 2.28 0.49 3.26
Syzygium cumini(L.) Skeels. 6.23 – 2.42 – 4.11 –
NRFnorth ridge forest,CRFcentral ridge forest,AGTBaboveground tree biomass,BGBbelowground biomass,TCtree carbon
Table 3Biomass in different ecosystem components
Ecosystem components
Biomass (Mg ha−1)
NRF CRF
TB 107.85 ± 2.68 a 69.2 ± 2.13 b
AGTB 75.24 ± 2.08 a 44.95 ± 1.84 b
BGB 32.61 ± 0.63 a 24.25 ± 0.6 b
SB 1.15 ± 0.52 a 0.80 ± 0.3a
HB 0.48 ± 0.03 a 0.49 ± 0.06 a
LB 0.40 ± 0.06 a 0.64 ± 0.07 b
Each value represents mean ± SE. Letters denotes significant difference atp< 0.05.
NRFnorth ridge forest,CRFcentral ridge forest,AGTBaboveground tree biomass,
BGBbelowground biomass,SBshrub biomass,HBherb biomass,LBlitter biomass
Table 4Carbon content in different pools of forests
Forest carbon pools
Carbon content (Mg C ha−1) Mean
(Mg C ha−1)
NRF CRF
AGTB 35.74 ± 0.98 a 21.35 ± 0.76 b 28.55
SB 0.57 ± 0.26 a 0.4 ± 0.15 a 0.52
HB 0.25 ± 0.02 a 0.26 ± 0.03 a 0.26
AGB 36.56 22.01 29.28
BGB 15.49 ± 0.30 a 11.52 ± 0.25 b 12.59
LB 0.2 ± 0.03 a 0.32 ± 0.04 b 0.26
SOC 22.32 ± 3.26 a 20.43 ± 1.58 a 21.36
Total carbon stock 74.57 54.28 63.49
Each value represents mean ± SE. Letters denotes significant difference atp< 0.05.
NRFnorth ridge forest,CRFcentral ridge forest,AGTBaboveground tree biomass,
BGBbelowground biomass,SBshrub biomass,HBherb biomass,LBlitter biomass,
0–10 and 10–20 cm depth did not vary significantly (p> 0.05) between the two forest sites. Furthermore, no significant differences (p> 0.05) were observed in SOC stock between two depths in NRF forest sites. However, in CRF site, the SOC stock between two depths varied significantly (p< 0.05).
Discussion
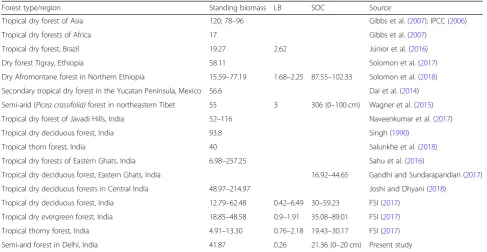
The estimated total biomass of the forest sites range between 71.13 and 109.88 Mg ha−1, with an average of 90.51 Mg ha−1, within the range reported for Indian fo-rest systems (27.4 to 251.8 Mg ha−1) (Chhabra et al. 2002), but is higher than the average (40 Mg ha−1) value reported for thorn forest system (Ravindranath et al. 1997). This clearly shows that the studied forest system in Delhi has the potential to store more C in its plant biomass. The C stored in different pools was estimated
as aboveground (29.28 Mg C ha−1), roots or
below-ground (12.59 Mg C ha−1), litter (0.26 Mg C ha−1), and SOC (21.36 Mg C ha−1). The estimated average forest standing biomass C (sum of AGB and BGB), i.e., 41.87 Mg C ha−1, was lower than the values reported for
tropical dry forests of Asia (Gibbs et al. 2007; IPCC
2006) and forests from Mexico (Dai et al. 2014) and
Ethiopia (Solomon et al. 2017, 2018), but higher than
forests from Africa (Gibbs et al. 2007; IPCC 2006) and
Brazil (Júnior et al. 2016). Carbon in AGB was also
lower than that of a semi-arid (Picea crassifolia) forest
in the North Eastern Tibet (Wagner et al. 2015). The
mean standing biomass C for the present forests is within the range reported for tropical dry deciduous (12.79–62.48 Mg C ha−1) and evergreen forests (18.85–48.58 Mg C ha−1) but higher than tropical thorn forests (4.91–13.3 Mg C ha−1) from India (FSI2017) (Table6).
Tree species composition also affects the total biomass and C stock of forest (Yang et al.2005; Borah et al.2015; Solomon et al.2017). In the present study,P. juliflorawas found to be the most dominant tree species in both forest
sites, having the highest TD, BA (Meena et al. 2016),
biomass, and C stock. However, the other associated tree species like Holoptelea integrifolia, Acacia leucophloea, Acacia nilotica, Azadirachta indica, Syzygium cumini, Pongamia pinnata, and Albizia lebbeck, though having a low TD, contribute significantly to the total biomass in NRF site. High tree species diversity in NRF than CRF fur-ther indicates its effect on forest productivity, increased biomass, and C stock. Management interventions and in-creased soil moisture content in NRF than in CRF pro-mote the establishment of different species (Meena et al. 2016). Additionally, differences in TD may also contribute to differences in C density among the forest types (Baker et al.2004; Behera et al. 2017). BGB/AGB ratio indicates the biomass allocation and stability. A high ratio was observed for species likeBauhinia purpurea(0.64),Cassia fistula (0.62), Acacia modesta (0.58), and Butea mono-sperma(0.62) in these forests. Furthermore, a higher
ra-tio for P. juliflora in CRF (0.7) than in NRF (0.45)
suggested a deep rooting system allowing more pene-tration and establishment in dry areas. The low ratio in NRF (0.43) than in CRF (0.54) indicated trees with a shal-low rooting system, which easily uprooted by the wind. Furthermore, the higher investment to BGB in CRF than in NRF could be due to lower water tables in CRF.
The significant role of understory pool (shrubs and herbs) in C sequestration and maintaining the biodiver-sity of the forest necessitates its estimation in C stock studies (Hou et al. 2015; Yue et al.2018). The contribu-tion of understory (shrubs and herbs) C storage to total forest C ranges between 1.09–2.02%, which is within the values (3%) as reported by Brown et al. (1997). However, the allocation of understory biomass is high when com-pared to the other forests of India, i.e., 0.13% in
temper-ate forests of Kashmir (Dar and Sundarapandian 2015),
0.15% in the humid tropics in the Northeast (Baishya and Barik2011), 0.1–0.3% in spruce forests in Northwest
China (Yue et al. 2018), and also with similar forest
type of Picea crassifolia forests (0.4%) in the Qilian Mountains (northeastern Tibetan Plateau) (Wagner et al. 2015). The difference in the understory pool of the arid zone could be attributed to species composition, canopy cover, nutrients, and light (Abdallah and Chaieb 2012). As the studied forest is an open forest covering 8.09% of the total forest cover (11.88%), the lower TD favors the growth of ground vegetation, which subse-quently increases the biomass and C storage in this pool.
Forest floor litter represents the detritus C considered as the most active pool in the forest C cycle (Yanai et al. 2003). The contribution of C in LB pool to the total C stock is smaller (0.2–1%) as compared to other compo-nents but is quite significant (FAO2005). The estimated litter C is within the range reported for the tropical
thorn forest of India (FSI 2017). The contribution of
Table 5Soil organic carbon content at different depths
Parameters Soil
depth (cm)
Sites
NRF CRF
C (g kg−1) 0
–10 16.83 ± 2.84 15.20 ± 2.03
10–20 10.93 ± 1.75 9.19 ± 1.17
BD (g cm−3) 0
–10 1.58 1.56
10–20 1.65 1.62
SOC stock (Mg ha−1) 0
–10 26.6 ± 4.49* a 24.36 ± 2.09*a
10–20 18.04 ± 2.88* a 16.5 ± 1.49*b
forest litter pool was similar or close to the values re-ported for different forest types by Baishya and Barik (2011) (0.5%); Zhang et al. (2013) (2–4%); Dar and Sun-darapandian (2015) (2.06%), and from a similar forest type by Wagner et al. (2015) (0.9%). The amount of litter C is controlled by various factors like age and density of trees (Yue et al. 2018), soil nutrient levels (Ovington 1956), species composition, quantity and quality of an-nual litter input (Zhang and Wang2010), decomposition
rate (Chaturvedi and Singh 1987; Taylor et al. 2007),
anthropogenic disturbances, and management history. The average SOC stock for the forest up to 20-cm depth was estimated as 21.36 Mg ha−1. These values were lower than those reported for tropical dry deciduous forests (37.5 Mg ha−1for 50 cm, Chhabra et al.2003), south-ern thorn forest of India (76.85 Mg ha−1, Ramachandran et al. 2007), forests of Kolli hills of Tamil Nadu (175– 369 Mg ha−1, Mohanraj et al.2011), tropical dry forest of Brazil (47.73–61.6 Mg ha−1, Santos et al.2016), and a semi-arid thicket of South Africa (168 Mg ha−1, Mills
et al.2005). However, these estimated SOC values are
comparable to those reported for other tropical dry forests of India at 0–30-cm depth for Sathnur reserve forest (16.92–44.65 Mg ha−1, Gandhi and Sundarapandian 2017), Uttar Pradesh (21.8 Mg ha−1, Chaturvedi et al. 2011), thorn forest of India (19.43–30.17 Mg ha−1, FSI 2017), and also with tropical dry forest of Australia (29.98 Mg ha−1, Gray et al.2015). The amount of SOC content is determined by the rate of organic matter inputs, accumu-lation, rate of mineralization in different organic C pools
(Post and Kwon 2000), stand type, and stand age
(Cao et al.2018). The overall contribution of SOC to
total forest C stock was found to be 29–38%. The re-duced SOC concentrations in the present forest type probably result from the high lignin-containing litter from P. julifloraand other associated semi-arid trees and low soil moisture content which limits the soil microbial activity and decomposition of organic mat-ter (Wagner et al. 2015; Yue et al. 2018). The rate of litter decomposition also significantly control the SOC stock in a forest. Exposure to high solar radia-tions in the semi-arid ecosystems results in loss of litter mass and C via altering the rate of litter
decom-position (Zhang et al. 2008). UV exposure along with
interannual variability in precipitation changes the foliar traits and litter chemistry by causing photo-degradation of lignin and C, hence affecting the over-all litter decomposition in these ecosystems (Gaxiola
and Armesto2015).
Over the years, the studied forests are influenced by anthropogenic disturbances including encroachments, resource exploitation, construction, deforestation, over-grazing, exotic plantation, and urbanization which re-sulted in forest fragmentation and have altered the forest
structure and species composition (Sinha 2014). This
has serious impacts on future biomass and C storage po-tential of these forests (Pan et al.2011). A similar study by Muhati et al. (2018) in a sub-humid disturbed montane forest of Kenya reported decreased values of AGB than indigenous dry tropical forests, which was suggested due Table 6Comparison of carbon content (Mg C ha−1) in standing biomass, litter, and soil of dry forests
Forest type/region Standing biomass LB SOC Source
Tropical dry forest of Asia 120; 78–96 Gibbs et al. (2007); IPCC (2006)
Tropical dry forests of Africa 17 Gibbs et al. (2007)
Tropical dry forest, Brazil 19.27 2.62 Júnior et al. (2016)
Dry forest Tigray, Ethiopia 58.11 Solomon et al. (2017)
Dry Afromontane forest in Northern Ethiopia 15.59–77.19 1.68–2.25 87.55–102.33 Solomon et al. (2018)
Secondary tropical dry forest in the Yucatan Peninsula, Mexico 56.6 Dai et al. (2014)
Semi-arid (Picea crassifolia)forest in northeastern Tibet 55 3 306 (0–100 cm) Wagner et al. (2015)
Tropical dry forest of Javadi Hills, India 52–116 Naveenkumar et al. (2017)
Tropical dry deciduous forest, India 93.8 Singh (1990)
Tropical thorn forest, India 40 Salunkhe et al. (2018)
Tropical dry forests of Eastern Ghats, India 6.98–257.25 Sahu et al. (2016)
Tropical dry deciduous forest, Eastern Ghats, India 16.92–44.65 Gandhi and Sundarapandian (2017)
Tropical dry deciduous forests in Central India 48.97–214.97 Joshi and Dhyani (2018)
Tropical dry deciduous forest, India 12.79–62.48 0.42–6.49 30–59.23 FSI (2017)
Tropical dry evergreen forest, India 18.85–48.58 0.9–1.91 35.08–89.01 FSI (2017)
Tropical thorny forest, India 4.91–13.30 0.76–2.18 19.43–30.17 FSI (2017)
Semi-arid forest in Delhi, India 41.87 0.26 21.36 (0–20 cm) Present study
to the dominance of young trees having low BA and height, a characteristic of a regenerating forest. In our study, lower values of C in AGB could be attributed to a high TD of individuals belonging to lower DBH classes. However, the presence of more trees in higher DBH classes has significantly increased the biomass in NRF as compared to CRF, indicating the importance of mature trees in C stor-age in a forest. The contribution of large trees (DBH > 70 cm) to AGB in the forest was reported up to 50% in
previ-ous studies (Brown and Lugo 1992; Brown et al. 1996;
Clark and Clark1996; Baishya et al. 2009). Therefore, the increased volume of mature trees has made a noteworthy contribution to total AGB and C sequestration in NRF site
as observed in other studies (Stephenson et al. 2014;
Kauppi et al.2015; Behera et al.2017). The C stock of tree species correlates positively with BA, TD, diversity, and forest productivity (Baishya et al.2009; Borah et al.2015; Joshi and Dhyani 2018). Furthermore, the age of forest stand also influences the biomass and correlates positively with forest C stock in previous studies, indicating an in-crease in C storage with stand age (Wei et al.2013; Köhl et al.2017). The older stand age of these forests results in temporal net primary productivity (NPP) accumulation and increases the overall tree C storage (Chen et al.2016). Overall, our study shows that the living portions (AGB + BGB) of the mature and young trees in the studied forest ecosystem in Delhi could play a significant role in the stor-age of more C in their plant biomass than soils. The SOC pool significantly increases the total C stock in such forest types and therefore has the potential for C sequestration. The study also emphasized the minor pools of C in the forest, i.e., the understory C pool and detritus pool which although have a small but significant contribution to the total C stock in the studied forest.
Conclusion
The study estimated the C content in different pools in a semi-arid forest ecosystem in Delhi, in order to understand their allocation and C sequestration potential. Our study estimated maximum storage of C in plant biomass contri-buting 40–49% of the total forest C stock suggesting it as a great potential pool of C storage in these forests. Further-more, it was found that the C storage potential in the for-ests is influenced by tree basal area, density, and species composition. Maximum biomass contribution by trees in lower DBH classes revealed the importance of young trees as major sinks of C in these forests. However, our results emphasize the protection of old-growth mature tree species having low TD but high BA as these are under the threat of extinction. In the present forest,P. juliflora, being the most dominant tree species, adapts better to moisture stress condition and showed highest biomass and C storage. However, attention should be given for the conser-vation of other native tree species likeAcacia leucophloea,
Acacia nilotica,and Albizia lebbeckshowing high storage of biomass and C. The study also focuses on SOC pool contributing 29–38% to total C stock of forest, which sug-gests it as a potential sink in C sequestration. The minor pools (LB) also contribute significantly to the total C stor-age in these forests and therefore should be considered in C stock studies. The studied semi-arid forest is notified as reserved forest, but over the years, forest destruction for construction and expansion leads to the loss of indigenous trees. The C stock studies are difficult in such areas as the forests have more fragmented patches resulting in greater uncertainty and difficulty in estimation of tree biomass. Our study shows the importance of semi-arid areas in C stock and provides necessary data to the researchers and forest managers for developing management plans in arid and semi-arid forests of India.
Abbreviations
AGB:Aboveground biomass; AGTB: Aboveground tree biomass; BA: Basal area; BGB: Belowground biomass; C: Carbon; CRF: Central ridge forest; DBH: Diameter at breast height; GSV: Growing stock volume; HB: Herbaceous biomass; LB: Litter biomass; NRF: North ridge forest; SB: Shrub biomass; SOC: Soil organic carbon; TB: Tree biomass; TD: Tree density
Acknowledgments
Authors thankfully acknowledge the Council of Scientific and Industrial Research (CSIR), University Grants Commission (UGC) (UGC-DSK-PDF (BSR)/BL/16-17/0146) and Department of Science and Technology (DST), India for financial support. We also thanks University of Delhi for providing Research and Development for providing grant for doctoral research program.
Availability of data and materials
The datasets used and/or analysed during the current study are available from the corresponding author on reasonable request.
Authors’contributions
AM proposed the idea and conducted the field sampling, data collection, laboratory analysis, data interpretation, and manuscript writing. AB and MH carried out field sampling and data collection. JD helped in the analysis of data and edited the manuscript. KSR guided the study, interpreted the results, and critically reviewed the idea. All authors read and approved the final manuscript.
Ethics approval and consent to participate Not applicable.
Consent for publication Not applicable.
Competing interests
The authors declare that they have no competing interests.
Publisher’s Note
Springer Nature remains neutral with regard to jurisdictional claims in published maps and institutional affiliations.
Author details
1
Received: 23 December 2018 Accepted: 27 February 2019
References
Abdallah F, Chaieb M (2012) The influence of trees on nutrients, water, light availability and understorey vegetation in an arid environment. Appl Veg Sci 15(4):501–512
Arasa-Gisbert R, Vayreda J, Román-Cuesta RM, Villela SA, Mayorgab R, Retana J (2018) Forest diversity plays a key role in determining the stand carbon stocks of Mexican forests. For Ecol Manag 415-416:160–171
Baishya R, Barik SK (2011) Estimation of tree biomass, carbon pool and net primary production of an old-growthPinus kesiyaRoyle ex. Gordon forest in north-eastern India. Ann For Sci 68(4):727–736
Baishya R, Barik SK, Upadhaya K (2009) Distribution pattern of aboveground biomass in natural and plantation forests of humid tropics in Northeast India. Trop Ecol 50(2):295–304
Baker T, Phillips OL, Malhi Y, Almeidas S, Arroyo L, Fiore AD, Killeen TJ, Laurance SG, Laurance WF, Lewis SL, Lloyd J, Monteagudo A, Neill DA, Patiño S, Pitman NCA, Silva JNM, Martínez RV (2004) Variation in wood density determines spatial patterns in Amazonian forest biomass. Glob Chang Biol 10(5):545–562
Bastin J, Berrahmouni N, Grainger A, Maniatis D, Mollicone D, Moore R, Patriarca C, Picard N, Sparrow B, Abraham EM, Aloui K, Atesoglu A, Attore F, Bassüllü Ç, Bey A, Garzuglia M, García-Montero LG, Groot N, Guerin G, Laestadius L, Lowe AJ, Mamane B, Marchi G, Patterson P, Rezende M, Ricci S, Salcedo I, Sanchez-Paus Diaz A, Stolle F, Surappaeva V, Castro R (2017) The extent of forest in dryland biomass. Science 356(6338):635–638
Behera SK, Sahu N, Mishra AK, Bargali SS, Behera MD, Tuli R (2017) Aboveground biomass and carbon stock assessment in Indian tropical deciduous forest and relationship with stand structural attributes. Ecol Eng 99:513–524 Bonino E (2006) Changes in carbon pools associated with a land use gradient in
the Dry Chaco, Argentina. For Ecol Manag 223(1–3):183–189
Borah M, Das D, Kalita J (2015) Tree species composition, biomass and carbon stocks in two tropical forest of Assam. Biomass Bioenergy 78:25–35 Brown S, Lugo AE (1992) Aboveground biomass estimates for tropical moist
forests of the Brazilian Amazon. Interciencia 17:8–18
Brown S, Sathaye J, Cannell M, Kauppi PE (1996) Mitigation of carbon emission to the atmosphere by forest management. Commonw For Rev 75(1):80–91 Brown S, Schroeder P, Birdsey R (1997) Aboveground biomass distribution of US
eastern hardwood forests and the use of large trees as an indicator of forest development. For Ecol Manag 96(1–2):37–47
Cairns MA, Brown S, Helmer EH, Baumgardner GA (1997) Root biomass allocation in the world’s upland forests. Oecologia 111(1):1–11
Canadell JG, Le Quéré C, Raupach MR, Field CB, Buitenhuis ET, Ciais P, Conway TJ, Gillett NP, Houghton RA, Marland G (2007) Contribution to accelerating atmospheric CO2growth from economic activity, carbon intensity and
efficiency of natural sinks. Proc Natl Acad Sci 104(47):18866–18870 Cao J, Zhang X, Deo R, Gong Y, Feng Q (2018) Influence of stand type and stand
age on soil carbon storage in China’s arid and semi-arid regions. Land Use Policy 78:258–265
Champion HG, Seth SK (1968) A revised survey of the forest types of India. Govt. of India Publications, New Delhi, p 404
Chaturvedi OP, Singh JS (1987) A quantitative study of the forest floor biomass, litter fall and nutrient return in aPinus roxburghiiforest in Kumaun Himalaya. Vegetatio 71(2):97–106
Chaturvedi RK, Raghubanshi AS, Singh JS (2011) Carbon density and
accumulation in woody species of tropical dry forest in India. For Ecol Manag 262(8):1576–1588
Chave J, Coomes DA, Jansen S, Lewis SL, Swenson NG, Zanne AE (2009) Towards a worldwide wood economics spectrum. Ecol Lett 12(4):351–366
Chen L, Liang M, Wang S (2016) Carbon stock density in planted versus natural
Pinus massonianaforests in sub-tropical China. Ann Forest Sci 73(2):461–472 Chhabra A, Palria S, Dadhwal VK (2002) Growing stock-based forest biomass
estimate for India. Biomass Bioenergy 22(3):187–194
Chhabra A, Palria S, Dadhwal VK (2003) Soil organic carbon pool in Indian forests. For Ecol Manag 173(1):187–199
Chibbar RK (1985) Soils of Delhi and their management. In: Biswas BC, Yadav DS, Maheshwari S (eds) Soils of India and their management. Fertiliser Association of India, New Delhi, pp 72–86
Clark DB, Clark DA (1996) Abundance, growth, and mortality of very large trees in neotropical lowland rain forest. For Ecol Manag 80(1–3):235–244
Dai Z, Birdsey RA, Johnson KD, Dupuy JM, Hernandez-Stefanoni JL, Richardson K (2014) Modeling carbon stocks in a secondary tropical dry forest in the Yucatan Peninsula, Mexico. Water Air Soil Pollut 225:1925
Dar JA, Sundarapandian S (2015) Variation of biomass and carbon pools with forest type in temperate forests of Kashmir Himalaya, India. Environ Monit Assess 187(2):55
Eggleston HS, Buendia L, Miwa K, Ngara T, Tanabe K (2006) IPCC guidelines for national greenhouse gas inventories, volume - IV agriculture, forestry and other land use. Institute of Global Environmental Strategies (IGES), Hayama FAO (2005) Global forest resources assessment: progress towards sustainable
forest management. In: Davis R (ed) Food and agriculture organization of the united extent of forest resources nations, Rome
FSI (1996) Volume equations for forests of India, Nepal and Bhutan. Forest Survey of India, Ministry of Environment and Forests, Government of India, India FSI (2017) State of forest report. Forest Survey of India, Ministry of Environment
and Forests, Government of India, India
Gandhi DS, Sundarapandian S (2017) Soil carbon stock assessment in the tropical dry deciduous forest of the Sathanur reserve forest of Eastern Ghats, India. J Sustainable For 36(2):1–17
Gaxiola A, Armesto JJ (2015) Understanding litter decomposition in semiarid ecosystems: linking leaf traits, UV exposure and rainfall variability. Front Plant Sci 6:40
Gibbs HK, Brown S, Niles JO, Foley JA (2007) Monitoring and estimating tropical forest carbon stocks: making REDD a reality. Environ Res Lett 2(4):1–13 Gray JM, Bishop TFA, Wilson BR (2015) Factors controlling soil organic carbon
stocks with depth in eastern Australia. Soil Sci Soc Am J 79(6):1741–1751 Hou L, Xi WM, Zhang SX (2015) Effect of understory on a natural secondary
forest ecosystem carbon budget. Russ J Ecol 46(1):51–58
Hu Y, Su Z, Li W, Li J, Ke X (2015) Influence of tree species composition and community structure on carbon density in a subtropical forest. PLoS One 10(8):e0136984
Huang J, Guan X, Ji F (2012) Enhanced cold-season warming in semi-arid regions. Atmos Chem Phys 12(12):5391–5398
Huang J, Yu H, Guan X, Wang G, Guo R (2016) Accelerated dryland expansion under climate change. Nat Clim Chang 6:166–171
IPCC (2006) IPCC (Intergovernmental Panel on Climate Change) guidelines for national greenhouse gas inventories. In: Eggleston HS, Buendia L, Miwa K, Ngara T, Tanabe K (eds) National greenhouse gas inventories programme, Institute For Global Environmental Strategies, Japan
Johnson MG, Kern JS (2002) Quantifying the organic carbon held in forested soils of the United States and Pueto Rico. In: Kimble JM, Heath LS, Birdsey RA, Lal R (eds) The potential of U.S. forest soils to sequester carbon and mitigate the greenhouse effects. Lewis Publishers, Boca Raton
Joshi RK, Dhyani S (2018) Biomass, carbon density and diversity of tree species in tropical dry deciduous forests in Central India. Acta Ecol Sinhttps://doi.org/ 10.1016/j.chnaes.2018.09.009
Júnior LRP, Andrade EMD, Palácio HADQ, Raymer PCL, Ribeiro FJC, Pereira FJS (2016) Carbon stocks in a tropical dry forest in Brazil. Rev Ciênc Agron 47(1):32–40
Kauppi PA, Birdsey RA, Pan Y, Ihalainen A, Nöjd P, Lehtonen A (2015) Effect of land management on large trees and carbon stock. Biogeosciences 12:855–862
Knight DH (1975) A phytosociological analysis of species-rich tropical forest on Barro Colorado Island, Panama. Ecol Monogr 45(3):259–284
Köhl M, Neupane PR, Lotfiomran N (2017) The impact of tree age on biomass growth and carbon accumulation capacity: a retrospective analysis using tree ring data of three tropical tree species grown in natural forests of Suriname. PLoS One 12(8):e0181187
Lal M, Singh R (2000) Carbon sequestration potential of Indian forests. Environ Monit Assess 60(3):315–327
Lal R (2005) World crop residues production and implication of its use as a biofuel. Environ Int 31(4):575–586
Malagnoux M, Sène EH, Atzmon N (2007) Forests, trees and water in arid lands: a delicate balance. Unasyla 58:24–29
Manhas RK, Negi JDS, Kumar R, Chauhan PS (2006) Temporal assessment of growing stock, biomass and carbon stock of Indian forests. Clim Chang 74(1–3):191–221 Meena A, Hanief M, Bidalia A, Rao KS (2016) Structure, composition and diversity of tree strata of semi-arid forest community in Delhi, India. Phytomorphology 66(3–4):95–102
evapotranspiration in a Mediterranean semiarid savanna of Central Chile. Sci Rep 8:8570
Mills AJ, O'Connor TG, Donaldson JS, Fey MV, Skowno AL, Sigwela AM, Lechmere-Oertel RG, Bosenberg JD (2005) Ecosystem carbon storage under different land uses in three semi-arid shrublands and a mesic grassland in South Africa. S Afr J Sci 22(3):183–190
Misra R (1968) Ecology work book. Calcutta, Oxford and IBH Publishing company, New Delhi, p 242
Mohanraj R, Saravanan J, Dhanakumar S (2011) Carbon stock in Kolli forests, Eastern Ghats (India) with emphasis on aboveground biomass, litter, woody debris and soils. IFOREST 4:61–65
Muhati GL, Olago D, Olaka L (2018) Quantification of carbon stocks in Mount Marsabit Forest Reserve, a sub-humid montane forest in northern Kenya under anthropogenic disturbance. Glob Ecol Conserv 14:e00383 Naveenkumar J, Arunkumar KS, Sundarapandian SM (2017) Biomass and carbon
stocks of a tropical dry forest of the Javadi Hills, Eastern Ghats, India. Carbon Manag 8(5–6):351–361
Ovington JD (1956) The composition of tree leaves. Forestry 29(1):22–28 Pan Y, Birdsey RA, Fang J, Houghton R, Kauppi PE, Kurz WA, Phillips OL,
Shvidenko A, Lewis SL, Canadell JG, Ciais P, Jackson RB, Pacala SW, McGuire AD, Piao S, Rautiainen A, Sitch S, Hayes D (2011) A large and persistent carbon sink in the world’s forests. Science 333(6045):988–993
Pande PK, Bisht APS, Sharma SC (1988) Comparative vegetation analysis of some plantation ecosystems. Ind For 114(7):379–388
Post WM, Kwon KC (2000) Soil carbon sequestration and land use change: processes and potential. Glob Chang Biol 6(3):317–327
Raghubanshi AS (1991) Dynamics of soil biomass C, N, and P in a dry tropical forest in India. Biol Fertil Soils 12(1):55–59
Rajput SS, Shukla NK, Gupta VK, Jain JD (1996) Timber mechanics: strength classification and grading of timber. Indian Council of Forestry Research and Education, New Forest, Dehradun, p 189
Ramachandran A, Jayakumar S, Haroon RM, Bhaskaran A, Arockiasamy DI (2007) Carbon sequestration: estimation of carbon stock in natural forests using geospatial technology in the Eastern Ghats of Tamil Nadu, India. Curr Sci 92(3):323–331
Ravindranath NH, Ostwald M (2008) Methods for estimating above ground biomass. In: Ravindranath NH, Ostwald M (eds) Carbon inventory methods: handbook for greenhouse gas inventory, carbon mitigation and round wood production projects, Springer Science + Business Media B.V, Netherlands Ravindranath NH, Somasekhar BS, Gadgil M (1997) Carbon flows in Indian forest.
Clim Chang 35(3):297–320
Sahu SC, Suresh HS, Ravindranath NH (2016) Forest structure, composition and above ground biomass of tree community in tropical dry forests of Eastern Ghats, India. Not Sci Biol 8(1):125–133
Salunkhe O, Khare PK, Kumari R, Kumari R, Khan ML (2018) A systematic review on the aboveground biomass and carbon stocks of Indian forest ecosystems. Ecol Process 7:17
Santos LTD, Marra DM, Trumbore S, Camargo PB, Chambers JQ, Negrón-Juárez RI, Lima AJN, Ribeiro GHPM, Santos JD, Higuchi N (2016) Windthrows increase soil carbon stocks in a Central Amazon forest. Biogeosciences 12:19351–19372
Sharma CM, Baduni NP, Gairola S, Ghildiyal SK, Suyal S (2010) Tree diversity and carbon stocks of some major forest types of Garhwal Himalaya, India. For Ecol Manag 260(12):2170–2179
Singh J (1990) Nature and distribution of soil humic substances of some plant communities at Ooty, Nilgiri. Myoforestry 26:143–147
Singh K, Chand P (2012) Above-ground tree outside forest (TOF) phytomass and carbon estimation in the semi-arid region of southern Haryana: a synthetic approach of remote sensing and field data. J Earth Syst Sci 121(6):1469–1482 Sinha GN (2014) An introduction to the Delhi ridge. Department of Forests and
Wildlife, Govt. of NCT of Delhi, New Delhi, India, p Xxiv + 154
Solomon N, Birhane E, Tadesse T, Treydte AC, Meles K (2017) Carbon stocks and sequestration potential of dry forests under community management in Tigray, Ethiopia. Ecol Process 6:20
Solomon N, Pabi O, Annang T, Asante IK, Birhane E (2018) The effects of land cover change on carbon stock dynamics in a dry Afromontane forest in northern Ethiopia. Carbon Balance Mange 13:14
Stephenson NL, Das AJ, Condit R, Russo SE, Baker PJ, Beckman NG, Coomes DA, Lines ER, Morris WK, Rüger N, Álvarez E, Blundo C, Bunyavejchewin S, Chuyong G, Davies SJ, Duque Á, Ewango CN, Flores O, Franklin JF, Grau HR, Hao Z, Harmon ME, Hubbell SP, Kenfack D, Lin Y, Makana JR, Malizia A,
Malizia LR, Pabst RJ, Pongpattananurak N, Su SH, Sun IF, Tan S, Thomas D, van Mantgem PJ, Wang X, Wiser SK, Zavala MA (2014) Rate of tree carbon accumulation increases continuously with tree size. Nature 507:90–93 Taylor AR, Wang JR, Chen HY (2007) Carbon storage in a chronosequence of red
spruce (Picea rubens) forests in central Nova Scotia, Canada. Can J For Res 37(11):2260–2269
Vayreda J, Gracia M, Canadell JG, Retana J (2012) Spatial patterns and predictors of forest carbon stocks in western Mediterranean. Ecosystems 15(8):1258–1270
Wagner B, Liang E, Li X, Dulamsuren C, Leuschner C, Hauck M (2015) Carbon pools of semi-aridPicea crassifoliaforests in the Qilian Mountains (north-eastern Tibetan Plateau). For Ecol Manag 343:136–143
Wei Y, Li M, Chen H, Lewis BJ, Yu D, Zhou W, Fang X, Zhao W, Dai L (2013) Variation in carbon storage and its distribution by stand age and forest type in boreal and temperate forests in Northeast China. PLoS One 8(8):e72201 Westlake DF (1963) Comparison of plant productivity. Biol Rev 38(3):385–425 Yanai RD, Stehman SV, Arthur MA, Prescott CE, Friedland AJ, Siccama TG,
Binkley D (2003) Detecting change in forest floor carbon. Soil Sci Soc Am J 67(5):1583–1593
Yang YS, Guo JF, Chen G, Xie J, Gao R, Zhen L, Zhao J (2005) Carbon and nitrogen pools in Chinese fir and evergreen broadleaved forests and changes associated with felling and burning in mid-subtropical China. For Ecol Manag 216(1–3):216–226
Yue J, Guan J, Deng L, Zhang J, Li G, Du S (2018) Allocation pattern and accumulation potential of carbon stock in natural spruce forests in Northwest China. PeerJ 6:e4859
Zanne AE, Lopez Gonzalez G, Comes DA, Ilic J, Janson S, Lewis SL, Miller RB, Swenson NG, Wiemann MC, Chave J (2009) Global wood density database. Dryad digital repository
Zhang D, Hui D, Luo Y, Zhou G (2008) Rates of litter decomposition in terrestrial ecosystems: global patterns and controlling factors. J Plant Ecol 1(2):85–93 Zhang Q, Wang C (2010) Carbon density and distribution of six Chinese
temperate forests. Sci Chin 53(7):831–840