O R I G I N A L R E S E A R C H
Open Access
Reproducible quantification of cardiac
sympathetic innervation using graphical
modeling of
carbon-11-meta-hydroxyephedrine kinetics with dynamic
PET-CT imaging
Tong Wang
1,2†, Kai Yi Wu
1†, Robert C. Miner
1, Jennifer M. Renaud
1, Rob S. B. Beanlands
1and Robert A. deKemp
1*Abstract
Background:Graphical methods of radiotracer kinetic modeling in PET are ideal for parametric imaging and data quality assurance but can suffer from noise bias. This study compared the Logan and Multilinear Analysis-1 (MA1) graphical models to the standard one-tissue-compartment (1TC) model, including correction for partial-volume effects, in dynamic PET-CT studies of myocardial sympathetic innervation in the left ventricle (LV) using [11C]HED.
Methods:Test and retest [11C]HED PET imaging (47 ± 22 days apart) was performed in 18 subjects with heart failure symptoms. Myocardial tissue volume of distribution (VT) was estimated using Logan and MA1 graphical methods and compared to the 1TC standard model values using intraclass correlation (ICC) and Bland-Altman analysis of the non-parametric reproducibility coefficient (NPC).
Results:A modeling start-time oft* = 5 min gave the best fit for both Logan and MA1 (R2= 0.95) methods. Logan slightly underestimated VTrelative to 1TC (p= 0.002), whereas MA1 did not (p= 0.96). Both the MA1 and Logan models exhibited good-to-excellent agreement with the 1TC (MA1-1TC ICC = 0.96; Logan-1TC ICC = 0.93) with no significant differences in NPC between the two comparisons (p= 0.92). All methods exhibited good-to-excellent test-retest repeatability with no significant differences in NPC (p= 0.57).
Conclusions:Logan and MA1 models exhibited similar agreement and variability compared to the 1TC for
modeling of [11C]HED kinetics. Usingt* = 5 min and partial-volume correction produced accurate estimates of VTas an index of myocardial sympathetic innervation.
Keywords:Logan, MA1, One tissue compartment, Sympathetic nervous system, HED
Background
Developed as a positron emission tomography (PET) im-aging agent to target the cardiac sympathetic nervous sys-tem, carbon-11-labeled meta-hydroxyephedrine ([11C]HED) is a norepinephrine analog that is taken up by nerve terminal varicosities in the myocardium, and used to assess sympa-thetic nerve function [1]. Since its genesis, it has been the
cornerstone PET tracer for cardiac sympathetic innervation, employed in determination of neuronal-based defects leading to improved diagnosis and prognosis for pathologies such as heart failure, arrhythmia, and cardiomyopathy, in which cardiac neuronal function is often compromised, leading to decreased catecholamine sensitivity and lowered beta adren-ergic receptor density [1]. Using PET [11C]HED imaging of cardiac tissues, the volume of distribution (VT) of the injected radiotracer is an invaluable metric that quantifies the uptake and retention of tracer, providing an index of sympathetic nerve density and reuptake-1 transporter activ-ity. For cardiac PET applications especially, VTand other
* Correspondence:[email protected]
†Tong Wang and Kai Yi Wu contributed equally to this work.
1National Cardiac PET Centre, University of Ottawa Heart Institute, 40 Ruskin
St, Ottawa, ON K1Y 4W7, Canada
Full list of author information is available at the end of the article
kinetic modeling parameters measured in the myocardium may be used to aid in the diagnosis of various innervation and perfusion-based pathologies.
In PET imaging studies, VT is defined as the equilib-rium ratio of tracer concentration in tissue to that of unmetabolized parent tracer in plasma, but this direct measurement is typically not feasible due to the long time needed to reach equilibrium. Alternatively, kin-etic modeling is commonly used to determine VTfrom a significantly shorter temporal sample following tracer in-jection [2]. While the physiological kinetics of [11C]HED may be modeled using a two-tissue-compartment model, the one-tissue-compartment (1TC) model has been shown to provide a robust representation with optimal clinical re-producibility in myocardial uptake studies, without sacri-ficing the accuracy of VTquantification [3]. Two graphical methods reported in the literature for kinetic modeling of reversible-binding tracers are the Logan [4] and Multilinear Analysis-1 (MA1) models [5], which are both computationally simpler than non-graphical (compart-mental) methods [6], while being able to provide visual representations of kinetic parameters. The Logan method has been established as the standard graphical model to estimate VT in a wide range of PET applications in the brain and heart, while MA1 was proposed as an alternative numerical formulation to estimate VTwith lower noise bias compared to Logan estimates [5]. Although [11C]HED is a widely used tracer, a comprehensive evaluation of the per-formance of the graphical and non-graphical methods to quantify its kinetics has not been performed. Furthermore, the effects of partial-volume losses on quantification of VT have not been well defined in the context of graphical kin-etic modeling in the heart, where the effects of blood-pool spillover and motion are more apparent compared to the brain. The goal of this study was to determine a method of partial-volume correction applicable to graphical kinetic modeling and to compare the Logan and MA1 models to the standard 1TC kinetic model for accurate quantification of myocardial sympathetic innervation using dynamic [11C]HED PET-CT studies.
Methods
Patient study design
Twenty-three heart failure patients were recruited as control subjects for a previous study (PET-OSA: NCT00756366) in-vestigating the effects of continuous positive airway pressure (CPAP) on sympathetic nerve function and cardiac energet-ics in heart failure patients with obstructive sleep apnea (OSA) [7]. These control patients had the same inclusion and exclusion criteria as the PET-OSA study, except they did not have OSA. Patient demographics were collected at base-line and follow-up visits.
Three of the 23 patients were missing baseline or follow-up PET scans and were excluded. Two other
patients were also excluded: one with atrial fibrillation at baseline that was treated before the follow-up scan and the other with uncorrectable severe motion artifact, leav-ingN= 18 subjects included in the final analysis. All pa-tients provided written informed consent, according to the research protocol approved by the Human Research Ethics Board at the University of Ottawa Heart Institute.
[11C]HED PET imaging
[11C]HED was synthesized from [11C]methyl-iodide and metaraminol-free base, with the use of standard methods for high purity and specific activity [8]. Images were ob-tained at baseline and follow-up (47 ± 22 days apart) on the ECAT-ART PET (Siemens/CTI, Knoxville, TN) or Discovery RX PET-VCT (GE Healthcare, Waukesha, WI) scanner, with ECG, heart rate, and blood pressure monitored at regular intervals. A transmission scan for attenuation correction was performed using Cs-137 iso-tope or X-ray CT [9], immediately after which 10– 15 mCi (370–550 MBq) of [11C]HED was injected over 30 s and a dynamic PET series was acquired over a 40-min period (10 × 10 s; 1 × 60 s; 5 × 100 s; 3 × 180 s; 4 × 300 s) [10]. Image reconstruction was performed using filtered-back-projection with a 12-mm Hann filter and all corrections enabled for quantification of radio-activity concentration [11].
Tracer kinetic modeling Blood metabolites correction
Quantitative analysis of [11C]HED kinetics requires correction for radiolabeled metabolites that accumulate over time in the bloodstream, which are not present in the myocardium [12]. The arterial whole-blood tracer concen-tration CWB(t) is typically measured using an image-derived region of interest (ROI) placed in the LV cavity and must be differentiated from the unchanged parent tracer concentra-tion in plasma Cp(t) as defined using the standardized no-menclature of Innis et al. [13]. The relation between Cp(t) and CWB(t) was characterized as a time-varying function of plasma-to-whole-blood and unchanged parent-to-metab olized radiotracer in the bloodstream and expressed as a combined parent fraction in plasma pfp(t) function (Additional file 1: Figure S1) derived from studies per-formed previously in humans [3]:
Cpð Þ ¼t CWBð Þ t pfp tð Þ ð1Þ
VT ¼CTð ÞTE Cpð ÞTE ;
when dCT
dt ¼0 ð2Þ
Where CTis the concentration of tracer in myocardial tissue and Cp is the concentration of tracer in plasma. For a reversible 1TC kinetic model, the rate-of-change of tracer concentration in myocardial tissue is defined using the rate of influx from arterial plasma-to-tissue (K1) and the rate of efflux from the tissue compartment (k2) according to Eq.3.
dCTð Þt
dt ¼K1Cpð Þ−t k2CTð Þt ð3Þ
At equilibrium (t≥TE), the rate-of-change of tracer concentration in tissue is equal to zero (dCTðtÞ
dt ¼0Þ[14].
Combining (2) and (3), the volume of distribution may be expressed as:
VT ¼K1 k2 ¼
CTð ÞTE
Cp TEð Þ ð4Þ
This simple derivation is applied widely in the analysis of neuro-PET imaging studies. However, in cardiac PET applications, additional image blurring due to cardiac contractile and respiratory motion makes it difficult to deduce the exact boundaries of myocardial tissue based on the measured ROI. There is also a 10–15% fraction of blood volume within normal myocardial tissue that must be considered. These effects may be lessened with modern PET-CT hybrid scanners with improved spatial and contrast resolution, but for cardiac imaging, these effects are still pronounced, necessitating implementation of partial-volume corrections [15,16]. With partial-volume spillover considered, our model of the imaging process becomes:
CROIð Þ ¼t RCCTð Þ þt FWBCWBð Þt ð5Þ
where CROI(t) is the measured tracer concentration in the PET myocardial image ROI. FWB is the fraction of whole-blood signal CWB(t) contained in the measured ROI curve due to imaging spillover effects and anatom-ical blood volume in the myocardial tissue [11]. CT(t) is the tracer concentration in the myocardial tissue (ex-cluding blood), and RC is the partial-volume recovery coefficient describing the fractional underestimation of CT(t) due to limited spatial resolution and myocardial motion blurring. In this study, the value of RC was esti-mated regionally as 1−FWB,according to the method of Hutchins et al. [15] used commonly in the compartmen-tal analysis of cardiac PET dynamic imaging studies. Blood spillover from the right ventricle cavity to the interventricular septum was not modeled explicitly. Spillover from the myocardium to blood-pool was not
corrected, which might affect CWB(t) at later time points. Isolating for CT(t) we have:
CTð Þ ¼t CROIð Þ−t FWBCWBð Þt
RC ð6Þ
Substituting CT from (5) into the definition of VT ¼CTðTEÞ
CpðTEÞin (1) and assumingt≥TE, we obtain:
CROIð Þ−TE FWBCWBð ÞTE RC
Cpð ÞTE ¼VT ð
7Þ
CROIð Þ−TE FWBCWBð ÞTE
½
Cpð ÞTE ¼VTRC ð
8Þ
CWB may be expressed in terms of Cp from (1), only consideringt≥TE:
CROIð Þ−TE FWB Cpð ÞTE pfp Tð ÞE
Cpð ÞTE ¼VTRC ð
9Þ
Maintaining the same logic as (2) and distinguishing between VT for the volume of distribution that corre-sponds to the true myocardial tissue compartment (CT) and VROIfor the volume of distribution that corresponds to the measured region of interest (CROI), VROI may be expressed as the ratio: CROIðTEÞ
CpðTEÞ ¼VROI. This can hence
be substituted into (9); then, Cp(t) may also be canceled from the second term of (9), yielding:
VROI− FWB
pfp Tð ÞE ¼VTRC ð
10Þ
where pfp(TE) represents the equilibrium value of pfp(t). Then, (10) can be rearranged to isolate VTas:
VT ¼
VROI− FWB
pfp Tð ÞE
RC ð11Þ
From (11), we propose that VTmay be estimated from VROI, with plasma-to-whole-blood and metabolite cor-rections as well as partial-volume effects considered explicitly.
Graphical kinetic modeling
RT
0 CROIð Þt dt
CROIð ÞT ¼ðVROIÞ
RT 0 Cpð Þt dt
CROIð ÞT þInt ð12Þ
CROI(t) and Cp(t) time-activity curves are used as mea-sured input data. At a certain time (t*), the intercept term (Int) will become a constant value [17], at which point the equation becomes a linear system where the slope represents the volume of distribution in the ROI. Since the measured tissue curve CROI(t) is subject to blood spillover and partial-volume losses, only VROImay be obtained from the graphical model directly. Previous applications of this model have estimated VROI without explicit correction factors for partial-volume effects, which is required for cardiac applications. In our pro-posed model, Eq. (11) may be used to determine VT from the slope determined by the Logan model.
The second graphical method investigated is the MA1 model, originally formulated as a more numerically stable alternative to the Logan model [6]:
CROIð Þ ¼T 1 Int
Z T
0 CROI t
ð Þdt−ðVROIÞ
Int
Z T
0 Cp t
ð Þdt
ð13Þ
As with the Logan model, onlyT>t* are used for MA1 analysis. MA1 is a multilinear equation with two inde-pendent variables, and the corresponding Logan slope VROIis equal to the negative ratio of the two coefficients, such that:
VROI ¼− − VROI ð Þ Int 1 Int 0 B @ 1 C
A ð14Þ
VTmay again be determined from the VROI value esti-mated using MA1, according to the relation defined in (11).
Determination of t* for graphical models
The estimation start-time (t*) was varied systematic-ally from 1.5 to 20 min for a subset of five [11C]HED studies to determine the optimal value to be used for the main analysis. Goodness-of-fit was evaluated on the Logan plot as the Pearson correlation (r2) of the points from t* to 40 min, indicating the subset of points best described by a line. Since the r2 is not ef-fective to assess goodness-of-fit of the near-horizontal fitted plane on the MA1 plots, an alternative metric was computed using the relative standard error of the estimate (rSEE) as 1−SEE/mean. The optimal t* was determined by comparing VT values from the graph-ical methods to the 1TC model standard. Then, all subsequent analysis was performed using the same start-time for both Logan and MA1 models.
PET image analysis
The compartmental and graphical analysis models were im-plemented in the FlowQuant® analysis software (University of Ottawa Heart Institute, ON). The operator reliability of this automated software has been reported previously [18]. Briefly, the left ventricle (LV) myocardium was segmented automatically and partitioned into voxels using a 2D polar-map representation, with each voxel representing a transmural sub-region of the LV myo-cardial tissue. The arterial whole-blood (WB) ROI was positioned automatically at the center of the left atrioventricular valve plane. Time-activity curves were generated based on measured tracer activity in the LV cavity CWB(t) and myocardial tissue CT(t) ROIs, as in-put to the tracer kinetic models.
In each polar-map voxel, the 1TC model rate constants K1and k2, as well as VTand the blood spillover fraction FWB, were estimated using weighted least-squares regres-sion, according to Eqs. (3), (4), and (5). The Logan and MA1 graphical models in Eqs. (12) and (13) were used to calculate LV polar-maps of VROI. Scan-specific spillover values were calculated as the polar-map median FWBand the corresponding partial-volume recovery coefficient RC (1−FWB), which were then used to estimate VTfrom the graphical model estimates of VROIaccording to Eq. (11). Image and data analyses were performed using MATLAB 2013b (The Mathworks, Natick, MA).
Statistical analysis
LV median VT values obtained from the 1TC, Logan, and MA1 methods were tabulated. Inter-model and test-retest mean effects were evaluated using two-way repeated measures ANOVA. Bland-Altman analyses and Intra-class correlation (ICC) were employed to evaluate the inter-model (MA1 vs 1TC, and Logan vs 1TC) and test-retest (baseline vs follow-up) reliability [19, 20]. Absolute-agreement ICC with two-way mixed effects was used for the inter-model reproduci-bility and test-retest repeatareproduci-bility [21]. To correct for skew in the VT distributions, VT values were logarith-mically transformed before the ANOVA and ICC ana-lyses. ICC values were categorized as: ICC > 0.90 excellent, > 0.75 very good, > 0.40 good, and ≤0.40 poor [22]. The limits-of-agreement of repeated measures were estimated using the following: (i) median difference ± non-parametric repeatability coefficient (NPC = 1.45 × IQR) to account for the variable effect of outliers and (ii) mean difference ± coefficient-of-repeatability (CR = 1.96 × SD). √(3/N) × SDdifference(t95%, n −1) was used to calculate the 95% confidence intervals on the limits-of-agreement, where
measure of repeatability [23]. Non-parametric Levene’s test was used to assess the equality of variance between groups. Bias in the Bland-Altman plots was assessed using the one-sample Wilcoxon Signed Ranked test against zero. A 2-tailed p value < 0.05 was considered statistically signifi-cant for all tests. Statistical analyses were performed using Excel 2016 (Microsoft) and SPSS 20.0 (IBM).
Results
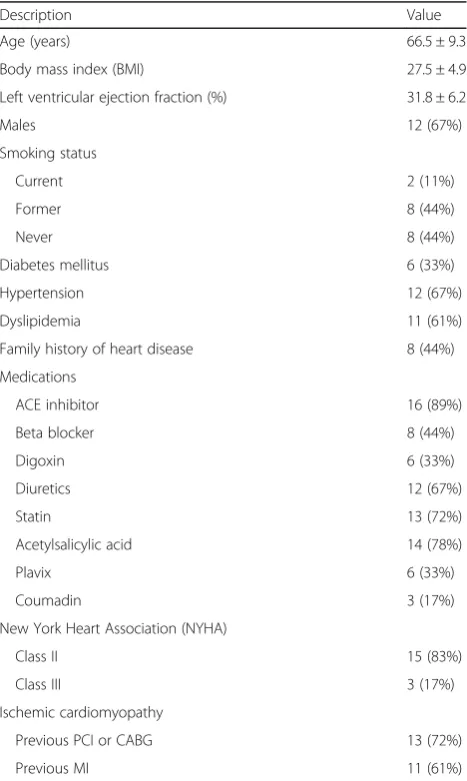
Patient demographics
Baseline patient demographics are listed in Table 1. Most patients in this study were male (66.5%) with mean age of 66.5 ± 9.3 years. The majority (83.3%) were classi-fied as having NYHA Class II heart failure and were tak-ing one or more cardiac medications. The demographics were stable at follow-up compared those reported at baseline.
Adjustment of start-time (t*) for graphical models
Table 2 shows the goodness-of-fit metrics for the five patients randomly sampled from the entire cohort used for this study. These ranged from 0.80 to 0.99 across all scans and t* values of 1.5–20 min, as summarized in Fig. 1. Corresponding VT values ranged from 9 to 21 mL/cm3for Logan and 10–28 mL/cm3for MA1. The Logan VT increased systematically up to approximately 5–15 min, interpreted as the start of the steady-state (linear) phase. There was not* value with Logan VT esti-mates equal to the 1TC reference value (20 mL/cm3); therefore, t* = 5 min was selected as the optimal start-time based on agreement of the MA1 VT values with the reference 1TC model. This value oft* also dem-onstrated the highest Logan r2 value (0.96), suggesting the best fit of a line was obtained for the points starting at 5 min. MA1 plots exhibited a steady increase in goodness-of-fit up to 5 min (0.97) with relatively little improvement at later start times.
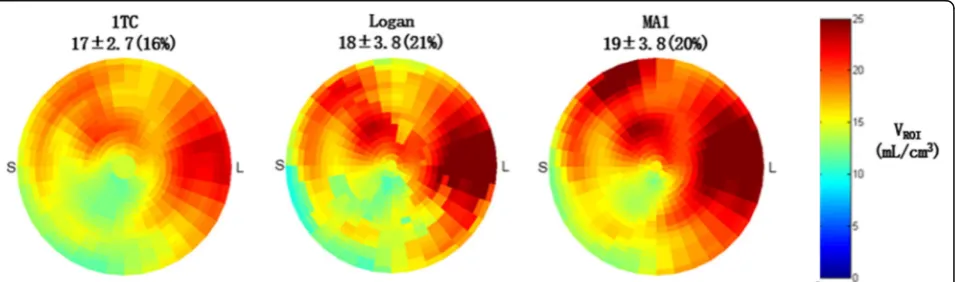
PET image analysis
Figure2shows VTpolar-maps from a single patient scan using all 3 models, including graphical representations of the Logan and MA1 plots as well as the 1TC model-ing results in Fig. 3. VTpolar-maps were found to show very similar spatial distributions for all three kinetic models, as expected.
Comparison of Logan and MA1 versus 1TC
At baseline, VTvalues were 20 ± 8 mL/cm3for 1TC, 17 ± 8.0 mL/cm3for Logan, and 20 ± 16 mL/cm3for MA1, as shown in Table 3. At follow-up, VTvalues were 21 ± 11 mL/cm3for 1TC, 19 ± 12 mL/cm3for Logan, and 23 ± 16 mL/cm3 for MA1. Intra-model comparison of the VT values at baseline vs. follow-up revealed that there was no significant difference between baseline and Table 1Patient characteristics (N= 18)
Description Value
Age (years) 66.5 ± 9.3
Body mass index (BMI) 27.5 ± 4.9
Left ventricular ejection fraction (%) 31.8 ± 6.2
Males 12 (67%)
Smoking status
Current 2 (11%)
Former 8 (44%)
Never 8 (44%)
Diabetes mellitus 6 (33%)
Hypertension 12 (67%)
Dyslipidemia 11 (61%)
Family history of heart disease 8 (44%)
Medications
ACE inhibitor 16 (89%)
Beta blocker 8 (44%)
Digoxin 6 (33%)
Diuretics 12 (67%)
Statin 13 (72%)
Acetylsalicylic acid 14 (78%)
Plavix 6 (33%)
Coumadin 3 (17%)
New York Heart Association (NYHA)
Class II 15 (83%)
Class III 3 (17%)
Ischemic cardiomyopathy
Previous PCI or CABG 13 (72%)
Previous MI 11 (61%)
Values are mean ± standard deviation or number (percent) of patients
Table 2Effect of graphical modeling start-times (t*) on measured VTand goodness-of-fit values (N= 5)
t* (min) Logan VT Loganr2 MA1 VT MA1 1−rSEE
1.5 11.2 0.90 13.0 0.85
2 12.1 0.91 13.6 0.87
2.5 13.2 0.92 14.6 0.89
3 14.6 0.94 15.4 0.92
4 16.4 0.94 17.0 0.94
5 18.2 0.96 19.8 0.97
10 18.8 0.95 21.4 0.97
15 19.2 0.92 22.2 0.97
20 17.6 0.92 21.4 0.98
The start-time of 5 min (values shown in italics) was selected with the MA1 VT
value closest to the 1TC model reference value of 20 mL/cm3
follow-up VT values for any of the models (p= 0.379). However, on average, VTvalues generated by Logan were 15% lower than those generated by MA1 (p= 0.002) and 12% lower than the 1TC values (p= 0.002). VT values generated by MA1 were not significantly different from those of 1TC (p= 0.958).
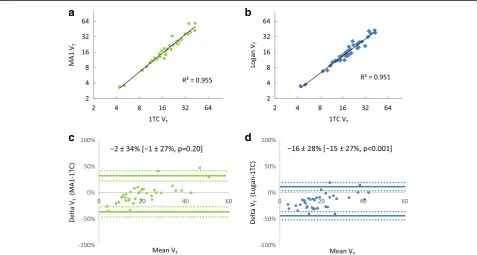
To evaluate reproducibility between the three models, the 1TC model was taken as the reference standard for compari-son with the Logan and MA1 models. Of the 36 scans com-pared in the inter-model analysis (Table 4, Fig. 4), the Logan-vs-1TC and MA1-vs-1TC comparisons exhibited similar reproducibility with NPC ~ 26.5%. However, the VT values generated from the Logan model were systematically lower than those generated from the 1TC model (median bias =−14.5% and mean bias =− 16.3%,p< 0.001), but there was no systematic difference in
VT when comparing MA1-vs-1TC models,p= 0.2). There was excellent agreement between MA1-vs-1TC values (ICC = 0.955, 95% CI [0.915, 0.977]) and good-to-excellent agreement between Logan-vs-1TC (ICC = 0.928, 95% CI [0.432, 0.978]). There was no difference in reproducibility between the MA1-vs-1TC and Logan-vs-1TC NPC values (nonparametric Levene’s test,p= 0.915).
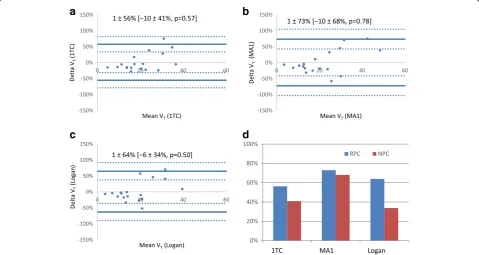
Test-retest repeatability of kinetic models
All models demonstrated very good repeatability (Table 5) with consistent ICC values = 0.837–0.852. The mean test-retest differences were all < 2% without any sys-tematic bias observed between baseline and follow-up (Fig.5), but this could be the result of relatively small sam-ple size with fewer points (N= 18) compared to the inter-method analysis (N= 36). There was no difference in Fig. 1Adjustment of MA1 and Logan model start-timet*, showing the goodness-of-fit metrics for Logan (Pearsonr2) and MA1 (1−rSEE) as well
as the trend of VTvalues (blue and green lines) for both models compared to the 1TC reference (red line).t* = 5 min produced the highest
Loganr2with corresponding V
T= 18.2 mL/cm3, and MA1 VT= 19.8 mL/cm3which was close to the reference 1TC value of 20 mL/cm3
(black diamond)
Fig. 2Example polar-maps of VROIestimated from a single patient scan using the one-tissue-compartment (1TC), Logan, and MA1 models. The
the test-retest reproducibility (NPC) values between the three methods (non-parametric Levene’s test,p= 0.57).
Discussion
In an effort to improve and expand the use of kinetic model-ing in cardiac PET studies of sympathetic innervation, we
sought to evaluate multiple kinetic models for the analysis of [11C]HED studies. This was achieved by comparing the inter-method differences in VTquantified by the Logan and MA1 graphical models compared to the reference 1TC model in a sample of heart failure patients and assessing the test-retest repeatability between baseline and follow-up scans. Fig. 3Model fitting results for the same patient scan shown in Fig.2.aOne-tissue-compartment (1TC) analysis of [11C]HED PET data showing time-activity curves in arterial whole-blood (red) and metabolite-corrected arterial plasma (dotted red), as well as LV myocardial ROI (dark blue) and myocardial tissue alone (cyan). Residuals (measured–modeled PET data) are shown in green.bLogan andcMA1 plots of LV myocardial uptake demonstrating that steady-state (linear response) is reached after approximately 5 min post-injection (frame #15)
Table 3[11C]HED PET V
TMeasurements (N= 18)
Parameter 1TC Logan* MA1
Baseline Follow-up Baseline Follow-up Baseline Follow-up
VT 19.7 ± 7.8 21.3 ± 11.5 17.3 ± 8.0 18.8 ± 12.0 20.1 ± 9.5 22.6 ± 16.2
HED PET is often used to evaluate therapy or disease pro-gression in heart failure patients; therefore, evaluation of the test-retest repeatability is most relevant in this same popula-tion, as opposed to healthy normal subjects who generally have lower sympathetic tone. The patients’ heart failure symptoms and medications were stable over the test-retest interval; therefore, any impact on the repeatability data should be minimal.
The MA1 model exhibited excellent agreement with 1TC, the Logan model exhibited good-to-excellent agreement with 1TC, and all models had good-to-excellent test-retest repeat-ability. Logan VTvalues were significantly lower than MA1 and 1TC VTvalues, while MA1 VTvalues were not signifi-cantly different from those obtained using the 1TC model (Table3). While 1TC is the reference standard kinetic model in this instance, graphical models such as the Logan and MA1 are computationally simpler alternatives that allow for linearized visualization and analysis of tracer kinetic data. Our findings support the reliable use of both graphical
analysis methods in addition to the standard 1TC model for tracer kinetic analysis of VT. These findings agree with previous studies using other PET tracers that compared vari-ous graphical models, including the Logan method, finding the results to be in agreement with standard compartment models, but computationally simpler, and potentially more robust [24–27].
In the present cardiac PET study, partial volume and spillover corrections were critical to implement into the graphical modeling calculations to avoid misinterpretation. The commonly used Logan and MA1 methods (Eqs. 12 and 13) only estimate the volume of distribution in the PET image region (VROI) as opposed to the myocardial tis-sue of interest (VT). Compared to PET measurements in other organ systems such as the brain, in cardiac studies, the measured ROI region contains much more spillover of blood signal within and adjacent to the myocardial tissues. Our implementation of a partial-volume correction method based on estimated recovery coefficients and whole-blood Table 4Inter-model reproducibility of VTmeasurements (N= 36)
Models compared ICC [95%CI] Average Delta ± RPC Median Delta ± NPC
Logan vs 1TC 0.928 [0.432, 0.978] −16.3 ± 27.8%† −14.5 ± 26.6%† MA1 vs 1TC 0.955 [0.915, 0.977] −2.3 ± 34.2% −1.0 ± 26.5%
†Significant bias vs zero (p< 0.001)
a
b
c
d
Fig. 4Inter-model reproducibility of [11C]HED PET measurements of V
Tusing MA1 (a,b)and Logan (c,d) models. Scatter-plots (a,c) show
excellent correlation of the graphical model values versus the 1TC standard withR2> 0.95. Bland Altman plots (b,d) show the 95%
spillover fractions allowed accurate measurement of myo-cardial VTvalues using Logan and MA1 graphical models on a scan-specific basis. In this validation study, FWB was estimated first using the 1TC with spillover model, and then used to calculate the corresponding RC values for consistent partial-volume and spillover correction of the graphical model VROIestimates. It is clear that independent estimates of RC and FWB are required to determine VT from VROIas shown in Eq.11; therefore, any error in the estimation of these correction factors in practice will be propagated directly into the corresponding values of VT. In the present study, the average FWB value was 0.37 ± 0.07, which could be used to estimate RC and hence VTin similar patient population studies with minimal added variability.
We investigated the effect of varyingt* on the graphical model results (Table2), which quantified VTusing the plot-ted values att≥t*. It has been reported thatt* may be de-duced directly from kinetic modeling data for some tracers [5], but the method we presented used a simpler and
systematic approach to determine the t* which produced the same VTvalues on average compared to the MA1 plots. This approach is beneficial for tracers for which it is more difficult to estimatet* directly from the study data, such as those with relatively slower kinetics [28]. It also removes the need to estimatet* for each individual scan, which may be subject to variable noise effects. We proposet* = 5 min as an effective start-time for cardiac studies employing [11C]HED as it also gave the highest quality of linear fit (r2> 0.95) using the Logan model, in addition to MA1 esti-mates of VTthat were equal to the 1TC reference value on average. This start time was shown with our comparison of the three models to be robust, producing results for VT with excellent goodness-of-fit to the graphical models and inter-method agreement. It is worth noting that a slightly later start time of 10–15 min may have provided Logan VT values that correspond better with 1TC and MA1 (Fig.1), but at the cost of a lower quality fit of the linear model and wider variability due to fewer fitted points.
Interestingly, the VTvalues determined by Logan were significantly lower than those determined by both MA1 and 1TC, while VTvalues determined by MA1 did not show a significant difference to those obtained from 1TC. More precisely, Logan exhibited a greater negative bias where VT was underestimated relative to 1TC, whereas a bias was not present between MA1 and 1TC (Table 4). In a similar kinetic model comparison using Table 5Test-retest repeatability of VTmeasurements (N= 18)
Model ICC [95%CI] Average Delta ± RPC Median Delta ± NPC
1TC 0.852 [0.645, 0.942] 1.3 ± 56.2% −9.6 ± 40.9%
Logan 0.852 [0.646, 0.942] 0.8 ± 73.0% −10.4 ± 68.1%
MA1 0.837 [0.614, 0.936] 0.9 ± 63.9% −5.5 ± 33.7%
a
b
c
d
Fig. 5Test-retest repeatability of [11C]HED PET measurements (N = 18 scans) for 1TC (a), MA1 (b), and Logan (c) methods. 95%
[18F]FCWAY and [11C]MDL neurological tracers, Ichise et al. [6] demonstrated that the MA1 model generated higher VTestimates than Logan, and that MA1 exhibited less bias compared to Logan at multiple imaging noise levels. Our results are consistent with these findings, affirming the original report of MA1 as a method to re-duce the magnitude of bias inre-duced by noise when using the Logan model [6]. Although Logan seemed to under-estimate VTin our study population, it should be realized that the median bias of −14.5% relative to the 1TC gold standard did not greatly affect the inter-model reproduci-bility of the models, which exhibited good to excellent agreement despite the bias that was present.
The use of [11C]HED to examine sympathetic func-tion in cardiac PET is becoming increasingly wide-spread. Recently, it has been shown to be a powerful diagnostic and prognostic tool for patients with heart failure, arrhythmias, flow-innervation mismatches, and microvascular dysfunction in both infarcted and non-infarcted tissues [1, 29–33]. This field continues to be improved and shows promise for a wider variety of applications [34]. As cardiac innervation tracers increase in prevalence, the optimization and validation of kinetic modeling techniques becomes more important; ex-tensions of the current study may be anticipated, such as those investigating the use of a two-tissue-compartment model to quantify cardiac NET re-uptake function more spe-cifically. Moreover, comparisons of multiple kinetic modeling options, in particular those of a graphical nature as presented here, are possible with other cardiac innervation-based tracers such as the [18F]-labeled sympathetic innervation tracers MFBG, MHPG, LMI1195, etc., for more detailed evaluation of their kinetics [35,36].
A few limitations were present in this study. The current study is a retrospective, single-center study that examined stable heart failure patients only from the PET-OSA trial. The results may be limited by the rela-tively small sample size (N= 18). Larger prospective studies would be beneficial to further validate the per-formance of the kinetic models as proposed.
Conclusion
A start time of 5 min was found to provide the best fit for Logan and MA1 models. The MA1-1TC comparison demonstrated excellent agreement while Logan-1TC and test-retest comparisons demonstrated good-to-excellent agreement when quantifying VTwith partial volume cor-rection. Although Logan underestimated VT due to the recognized noise bias, Logan and MA1 both exhibited similar test-retest variability, suggesting that they may be used in addition to 1TC in the modeling of [11C]HED kinetics, with benefits of greater computational simpli-city and the ability to mathematically visualize kinetic parameters for better quality assurance.
Additional file
Additional file 1:Figure S1.Unchanged parent fraction in plasma (cyan) is calculated as the product of the plasma-to-whole blood fraction (green) times the unchanged parent fraction (blue) curves, derived from the human data presented in Harms et al. [3]. (DOCX 61 kb)
Funding
Networks of Centres of Excellence of Canada (NCE-15-P06-001), Ontario Research Foundation (ORF-RE07-021).
Availability of data and materials
The data will not be shared because it will be used in other upcoming studies.
Authors’contributions
TW performed kinetic analysis, created figures, and wrote the manuscript. KYW performed statistical analysis, created figures and tables, and wrote the manuscript with TW. TW and RdK formulated partial volume correction. RCM processed clinical studies and assisted in creation of figures. JMR assisted in implementation of kinetic analysis tools. RSB and RdK supervised project development and analysis. All authors were involved in the editing process. All authors read and approved the final manuscript.
Ethics approval and consent to participate
All research subjects provided written informed consent, as approved by the Human Research Ethics Board at the University of Ottawa Heart Institute.
Consent for publication
Consent has been obtained from participants to publish this work.
Competing interests
RSB and RdK have received unrestricted university-industry grant funding from the Ontario Research Fund and Lantheus Medical Imaging.
Publisher’s Note
Springer Nature remains neutral with regard to jurisdictional claims in published maps and institutional affiliations.
Author details
1National Cardiac PET Centre, University of Ottawa Heart Institute, 40 Ruskin
St, Ottawa, ON K1Y 4W7, Canada.2Department of Physiology, University of Toronto, 1 Kings College Circle, Toronto, ON M5S 1A8, Canada.
Received: 21 March 2018 Accepted: 2 July 2018
References
1. Boschi S, Lodi F, Boschi L, Nanni C, Chondrogiannis S, Colletti PM, et al. 11C-Meta-Hydroxyephedrine. Clin Nucl Med. 2015;40(2):e96–103. Available from:
https://www.ncbi.nlm.nih.gov/pubmed/24999701.
2. Logan J, Fowler JS, Volkow ND, Wang GJ, Ding YS, Alexoff DL. Distribution volume ratios without blood sampling from graphical analysis of PET data. J Cereb Blood Flow Metab. 1996;16(5):834–40.
3. Harms HJ, Haan SD, Knaapen P, Allart CP, Rijnierse MT, Schuit RC, et al. Quantification of [11C]-meta-hydroxyephedrine uptake in human myocardium. EJNMMI Res. 2014;4:52.
4. Logan J, Fowler JS, Volkow ND, Wolf AP, Dewey SL, Schlyer DJ, et al. Graphical analysis of reversible radioligand binding from time-activity measurements applied to [N-11C-methyl]-(−)-cocaine PET studies in human subjects. J Cereb Blood Flow Metab. 1990;10(5):740–7. Available from: http:// dx.doi.org/10.1038/jcbfm.1990.127
5. Ichise M, Toyama H, Innis RB, Carson RE. Strategies to improve neuroreceptor parameter estimation by linear regression analysis. J Cereb Blood Flow Metab. 2002;22(10):1271–81. Available from:http://www.ncbi. nlm.nih.gov/pubmed/12368666
7. Hall AB, Ziadi MC, Leech JA, Chen S-Y, Burwash IG, Renaud J, et al. Effects of short-term continuous positive airway pressure on myocardial sympathetic nerve function and energetics in patients with heart failure and obstructive sleep apnea: a randomized study. Circulation. 2014;130(11):892–901. Available from:http://www.ncbi.nlm.nih.gov/pubmed/24993098
8. Rosenspire KC, Haka MS, Van Dort ME, Jewett DM, Gildersleeve DL, Schwaiger M, et al. Synthesis and preliminary evaluation of carbon-11-meta-hydroxyephedrine: a false transmitter agent for heart neuronal imaging. J Nucl Med. 1990;31(8):1328–34. Available from:http://www.ncbi.nlm.nih.gov/ pubmed/2384800
9. Yoshinaga K, Burwash IG, Leech JA, Haddad H, Johnson CB, deKemp RA, et al. The effects of continuous positive airway pressure on myocardial energetics in patients with heart failure and obstructive sleep apnea. J Am Coll Cardiol. 2007;49(4):450–8.
10. Allman KC, Wieland DM, Muzik O, Degrado TR, Wolfe ER, Schwaiger M. Carbon-11 hydroxyephedrine with positron emission tomography for serial assessment of cardiac adrenergic neuronal function after acute myocardial infarction in humans. J Am Coll Cardiol. 1993;22(2):368–75.
11. Cherry SR, Sorenson JA, Phelps ME. Physics in Nuclear Medicine; Chapter 18: Positron Emission Tomography. Philadelphia: Elsevier Saunders; 2012. 12. Thackeray JT, Beanlands RS, Dasilva JN. Presence of specific
11C-meta-Hydroxy-ephedrine retention in heart, lung, pancreas, and brown adipose tissue. J Nucl Med. 2007;48(10):1733–40. Available from:http://www.ncbi. nlm.nih.gov/pubmed/17873125
13. Innis RB, Cunningham VJ, Delforge J, Fujita M, Gjedde A, Gunn RN, et al. Consensus nomenclature for in vivo imaging of reversibly binding radioligands. J Cereb Blood Flow Metab. 2007;27:1533–9. 14. Wahl R, Buchanan J. Principles and Practice of positron emission
tomography. Philidelphia: Lippincott Williams & Wilkins; 2002. 15. Hutchins GD, Caraher JM, Raylman RR. A region of interest strategy for
minimizing resolution distortions in quantitative myocardial PET studies. J NucI Med. 1992;33:1243–50.
16. Iida H, Rhodes CG, de Silva R, Yamamoto Y, Araujo LI, Maseri A, et al. Myocardial tissue fraction–correction for partial volume effects and measure of tissue viability. J Nucl Med. 1991;32(11):2169–75. Available from:http:// www.ncbi.nlm.nih.gov/pubmed/1941156
17. Hany TF, Steinert HC, Goerres GW, Buck A, von Schulthess GK. PET diagnostic accuracy: improvement with in-line PET-CT system: initial results. Radiology. 2002;225(2):575–81.
18. Patlak CS, Blasberg RG. Graphical evaluation of blood-to-brain transfer constants from multiple-time uptake data. Generalizations. J Cereb Blood Flow Metab. 1985;5(4):584–90. Available from:http://journals.sagepub.com/ doi/pdf/10.1038/jcbfm.1985.87.
19. Klein R, Renaud JM, Ziadi MC, Thorn SL, Adler A, Beanlands RS, deKemp RA. Intra- and inter-operator repeatability of myocardial blood flow and myocardial flow reserve measurements using rubidium-82 pet and a highly automated analysis program. J Nucl Cardiol. 2010;17(4):600–16.https://doi. org/10.1007/s12350-010-9225-3.
20. Shrout PE, Fleiss JL. Intraclass correlations: uses in assessing rater reliability. Psychol Bull. 1979;86(2):420–8.
21. Bland JM, Altman DG. Statistical methods for assessing agreement between two methods of clinical measurement. Lancet. 1986;327:307–10. Available from:http://www.sciencedirect.com/science/article/pii/S0140673686908378
22. Koo TK, Li MY. A guideline of selecting and reporting Intraclass correlation coefficients for reliability research. J Chiropr Med. 2016;15(2):155–63. Available from:http://linkinghub.elsevier.com/retrieve/pii/ S1556370716000158
23. Fleiss JL. Reliability of measurement. In: The design and analysis of clinical experiments [Internet]; 1999. p. 1–32. Available from: http://dx.doi.org/10. 1002/9781118032923.ch1.
24. Klein R, Ocneanu A, Renaud JM, Ziadi MC, Beanlands RSB, DeKemp RA. Consistent tracer administration profile improves test-retest repeatability of myocardial blood flow quantification with (82)Rb dynamic PET imaging. J Nucl Cardiol. 2016; Available from:http://www.ncbi.nlm.nih.gov/pubmed/27804067
25. Rizzo G, Veronese M, Zanotti-Fregonara P, Bertoldo A. Voxelwise quantification of [11C](R)-rolipram PET data: a comparison between model-based and data-driven methods. J Cereb Blood Flow Metab. 2013;33(7):1032–40. Available from:http://journals.sagepub.com/doi/abs/10.1038/jcbfm.2013.43. 26. Treyer V, Streffer J, Wyss MT, Bettio A, Ametamey SM, Fischer U, et al.
Evaluation of the metabotropic glutamate receptor subtype 5 using PET and 11C-ABP688: assessment of methods. J Nucl Med. 2007;48(7):1207–15.
27. Grafström J, Stone-Elander S. Comparison of methods for evaluating radiolabelled Annexin A5 uptake in pre-clinical PET oncological studies. Nucl Med Biol. 2014;41(10):793–800.
28. Wong K, Kepe V, Small G, Satyamurthy N, Barrio J, Huang S. Comparison of simplified methods for quantitative analysis of [F-18]FDDNP PET data. IEEE Nucl Sci Symp Conf Rec. 2007;1–11:3146.
29. Wilks MQ, Knowles SM, Wu AM, Huang S-C. Improved modeling of in vivo kinetics of slowly diffusing radiotracers for tumor imaging. J Nucl Med. 2014;55(9):1539–44. Available from:http://jnm.snmjournals.org/content/ early/2014/07/02/jnumed.114.140038
30. Boutagy N, Sinusas A. Recent Advances and Clinical Applications of PET Cardiac Autonomic Nervous System ImagingNo Title. Curr Cardiol Rep. 2017;19(4):33.https://doi.org/10.1007/s11886-017-0843-0. 31. Magota K, Hattori N, Manabe O, Naya M, Oyama-Manabe N, Shiga T, et al.
Electrocardiographically gated 11C-hydroxyephedrine PET for the simultaneous assessment of cardiac sympathetic and contractile functions. Ann Nucl Med. 2014;28(3):187–95.
32. Capitanio S, Nanni C, Marini C, Bonfiglioli R, Martignani C, Dib B, et al. Heterogeneous response of cardiac sympathetic function to cardiac resynchronization therapy in heart failure documented by 11[C]-hydroxy-ephedrine and PET/CT. Nucl Med Biol. 2015;42(11):858–63.
33. Harms HJ, Lubberink M, de Haan S, Knaapen P, Huisman MC, Schuit RC, et al. Use of a Single 11C-Meta-Hydroxyephedrine Scan for Assessing Flow-Innervation Mismatches in Patients with Ischemic Cardiomyopathy. J Nucl Med. 2015;56(11):1706–11. Available from:http://jnm.snmjournals.org/cgi/ doi/10.2967/jnumed.115.154377
34. Rijnierse MT, Allaart CP, De Haan S, Harms HJ, Huisman MC, Wu L, et al. Sympathetic denervation is associated with microvascular dysfunction in non-infarcted myocardium in patients with cardiomyopathy. Eur Heart J Cardiovasc Imaging. 2015;16(7):788–98.
35. Thackeray JT, Bengel FM. PET imaging of the autonomic nervous system. Q J Nucl Med Mol Imaging. 2016;60(4):362–82. Available from:http://www. ncbi.nlm.nih.gov/pubmed/27611712
![Table 3 [11C]HED PET VT Measurements (N = 18)](https://thumb-us.123doks.com/thumbv2/123dok_us/9623590.1944523/7.595.59.537.88.498/table-c-hed-pet-vt-measurements-n.webp)