R E S E A R C H
Open Access
Revisiting the evolution of mouse LINE-1 in the
genomic era
Akash Sookdeo
1, Crystal M Hepp
2,3,4, Marcella A McClure
4and Stéphane Boissinot
1,5*Abstract
Background:LINE-1 (L1) is the dominant category of transposable elements in placental mammals. L1 has significantly affected the size and structure of all mammalian genomes and understanding the nature of the interactions between L1 and its mammalian host remains a question of crucial importance in comparative genomics. For this reason, much attention has been dedicated to the evolution of L1. Among the most studied elements is the mouse L1 which has been the subject of a number of studies in the 1980s and 1990s. These seminal studies, performed in the pre-genomic era when only a limited number of L1 sequences were available, have significantly improved our understanding of L1 evolution. Yet, no comprehensive study on the evolution of L1 in mouse has been performed since the completion of this genome sequence.
Results:Using the Genome Parsing Suite we performed the first evolutionary analysis of mouse L1 over the entire
length of the element. This analysis indicates that the mouse L1 has recruited novel 5’UTR sequences more
frequently than previously thought and that the simultaneous activity of non-homologous promoters seems to be one of the conditions for the co-existence of multiple L1 families or lineages. In addition the exchange of genetic
information between L1 families is not limited to the 5’UTR as evidence of inter-family recombination was observed
in ORF1, ORF2, and the 3’UTR. In contrast to the human L1, there was little evidence of rapid amino-acid
replacement in the coiled-coil of ORF1, although this region is structurally unstable. We propose that the structural instability of the coiled-coil domain might be adaptive and that structural changes in this region are selectively equivalent to the rapid evolution at the amino-acid level reported in the human lineage.
Conclusions:The pattern of evolution of L1 in mouse shows some similarity with human suggesting that the nature of the interactions between L1 and its host might be similar in these two species. Yet, some notable differences, particularly in the evolution of ORF1, suggest that the molecular mechanisms involved in host-L1 interactions might be different in these two species.
Keywords:Retroposon, Retrotransposon, LINE-1, L1,Mus musculus, Recombination
Background
Long interspersed nuclear element-1 (LINE-1 or L1) constitutes the dominant category of transposable ele-ments in mammalian genomes. L1s have accumulated in the genomes of their mammalian hosts in extremely large numbers and contribute to more than 20% of gen-ome size in human and mouse [1,2]. L1s have been a rich source of evolutionary novelties by providing motifs that can be recruited by the host either for the
regulation of its own genes or within its coding sequences [3-6]. However, L1 activity can also be detri-mental to the fitness of the host [7,8], either by inserting within genes [9,10] or by mediating chromosomal rear-rangements through ectopic (non-allelic) recombination [11,12]. L1 elements replicate using a copy-and-paste mechanism that involves the reverse-transcription of the L1 RNA at the insertion site [13-15]. L1 encodes the replicative machinery necessary for the retrotransposi-tion reacretrotransposi-tion. It contains two open-reading frames (ORFs) that are both indispensable for L1 retrotransposi-tion. ORF1 encodes a trimeric protein with RNA-binding properties and nucleic-acid chaperone activity [16-20]. ORF2 encodes an endonuclease that makes the * Correspondence:[email protected]
1Department of Biology, Queens College, the City University of New York, 65-30 Kissena Boulevard, Flushing, NY 11367-1597, USA
5The Graduate Center, the City University of New York, New York, NY, USA Full list of author information is available at the end of the article
first nick at the insertion site and a reverse-transcriptase that copies L1 RNA into DNA at the site of insertion [21,22]. L1 has a 5’untranslated region (UTR) that acts as an internal promoter [23,24] and a 3’ UTR with a conserved poly-G tract of unknown function [25]. The L1 retrotransposition reaction produces mostly 5’ trun-cated elements that are transpositionally inactive [26,27]. As the vast majority of L1 insertions do not serve a function for the host, they accumulate mutations at the neutral rate so that young families of L1 elements are less divergent than older ones [28-32].
The pattern of L1 element evolution in mammals is very unusual. In most species analyzed so far, L1 evolves as a single lineage: a family of elements emerges, ampli-fies to hundreds or thousands of copies and then becomes extinct, being replaced by a more recently evolved family [30,33-35]. This process is exemplified in human where a single lineage of replicatively dominant families has evolved over the last 40 MY [30]. The rea-son(s) why L1 evolves as a single lineage remains unclear but the similarity between L1 and H3N2 influenza A virus evolution [36-38] suggests that the single lineage mode of evolution could result from a co-evolutionary arms race between L1 and its host. This hypothesis is supported by the observation that the coiled-coil domain of ORF1 harbors the signature of adaptive evolution, possibly in response to host repression [39], and that adaptive evolution apparently correlates with the replica-tive success of L1 families [30]. However, in early pri-mate evolution (from 70 to 40MY), multiple L1 lineages have co-existed in the human genome [30]. Interestingly, co-existing lineages always had non-homologous 5’UTRs suggesting that their co-existence could be due to their reliance on different host factors for their transcription.
The patterns described above result mostly from the analysis of the human genome and it is unclear how pat-terns of evolution in human recapitulate L1 evolution in other species. It is thus important to examine in greater detail the evolution of L1 lineages in other mammals. Pre-genomics studies in the house mouse (Mus
muscu-lus) have demonstrated the presence of multiple con-currently active L1 families with non-homologous promoters [33,40-48]. Recently active families are clas-sified into two groups based on their promoter types (A or F types), whereas ancestral L1 families carry a third promoter, the V type. The co-existence of multiple L1 families with different promoters in extant mice recapitu-lates the situation in early primate evolution and provides a unique opportunity to investigate the interactions be-tween concurrent L1 families and the molecular proper-ties that would allow for such co-existence.
Previous L1 studies in mice were limited to sequence analysis performed on a few L1 loci, the majority of which were fragments of L1 inserts. No detailed study of
L1 evolution in mouse has been performed since the completion of the mouse genome sequence [2]. With the availability of this genome, we decided to perform a comprehensive analysis of full-length L1 elements to in-vestigate the evolutionary dynamics of L1 in mouse. We present evidence that the diversification of mouse L1 has been influenced by frequent events of recombination across the entire length of the element, rapid structural changes in ORF1, as well as lateral transfer by inter-specific hybridization.
Results
A total of 20,459 L1 inserts with complete reverse transcriptase (RT) domains were identified using the Genome Parsing Suite (GPS). L1 elements were first
grouped based on their 5’UTR. This was done by
comparing the 5’ end of all elements with a library of previously described mouse 5’UTR using the Repeatmas-ker program [49]. The A, F, V, and Lx 5’UTR types have long been characterized [33,50,51] and the majority of elements could be assigned to one of these 5’UTR sequences. A number of elements however carried 5’UTRs distinct from these four types. These elements were aligned to each other and grouped into three novel types of 5’UTR: (1) a 5’UTR with similarity to the F type but with distinctive features, named Fanc (for F ances-tral); (2) a 5’UTR that was not characterized before, named Mus (because it is absent from the rat genome); and (3) a 5’UTR that shows no similarity with any others, named N (for novel).
Once elements were sorted based on their 5’UTRs, they were further categorized into families using a phylogenetic analysis of the 3’ terminus. A family is defined as a collection of elements that result from the activity of a highly homogenous group of progenitors, which are characterized by a unique combination of characters. In the first step of the phylogenetic analysis, neighbor joining trees [52] of elements sharing similar 5’UTRs were built. Distinct clusters of sequences were provisionally considered families and were validated by a second round of phylogenetic analysis based on the principle that elements belonging to the same family should yield a star phylogeny (that is, a phylogenetic tree devoid of structure) because these elements result from the activity of very similar progenitors. These families were further confirmed by phylogenetic analysis per-formed on other regions of L1 to ensure that the homo-geneity of the families extend over the entire length of the element.
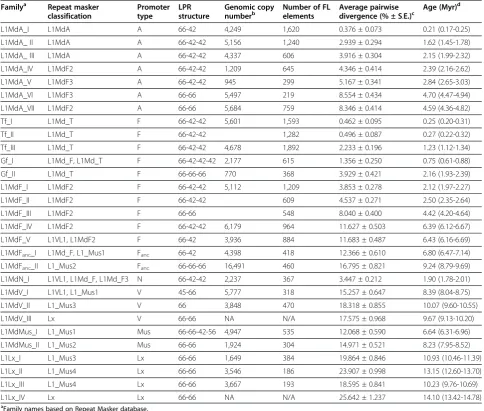
which are parsimony-informative. The number of vari-able sites differs among regions, ORF2 having the largest number (785 out of 3,835 sites) followed by the 3’UTR (324 out of 652) and ORF1 (318 out of 1,218). However, ORF2 has the least number of variable and parsimony-informative sites relative to its length (20.5% and 13.9%, respectively) and the 3’UTR the most (49.7% and 32.5%), ORF1 having an intermediate number (26.1% and 19.2%). The length of the consensus varies between 6,000 and 8,000 bp, depending on the number of mono-mer repeats in the promoter region. The number of full-length (FL) elements varied greatly between families as FL elements belonging to older families tend to be less numerous in comparisons to younger families. This is expected as L1 inserts decay over time because of
internal deletions. The copy number of a few older fam-ilies was too low (<10 copies) to derive accurate FL con-sensus sequences. Such families were removed from the dataset as we maintained a strict rule of using only FL elements, that is elements with intact 5’UTR, ORF1, ORF2, and 3’UTR. Thus our dataset represents relatively high copy number families which have inserted in the mouse genome since the split between mouse and rat, about 13 MY ago [53]. It is very likely that additional an-cient, small copy number families exist but were missed by our approach.
Phylogenetic analysis of L1 families based on ORF2
As L1 families have extensively recombined with each other (see below), various regions of L1 yield different Table 1 Copy number, divergence, and age of mouse L1 families
Familya Repeat masker classification
Promoter type
LPR structure
Genomic copy
numberb Number of FLelements Average pairwisedivergence (% ± S.E.)c Age (Myr) d
L1MdA_I L1MdA A 66-42 4,249 1,620 0.376 ± 0.073 0.21 (0.17-0.25)
L1MdA_ II L1MdA A 66-42-42 5,156 1,240 2.939 ± 0.294 1.62 (1.45-1.78)
L1MdA_ III L1MdA A 66-42-42 4,337 606 3.916 ± 0.304 2.15 (1.99-2.32)
L1MdA_IV L1MdF2 A 66-42-42 1,209 645 4.346 ± 0.414 2.39 (2.16-2.62)
L1MdA_V L1MdF3 A 66-42-42 945 299 5.167 ± 0.341 2.84 (2.65-3.03)
L1MdA_VI L1MdF3 A 66-66 5,497 219 8.554 ± 0.434 4.70 (4.47-4.94)
L1MdA_VII L1MdF2 A 66-66 5,684 759 8.346 ± 0.414 4.59 (4.36-4.82)
Tf_I L1Md_T F 66-42-42 5,601 1,593 0.462 ± 0.095 0.25 (0.20-0.31)
Tf_II L1Md_T F 66-42-42 1,282 0.496 ± 0.087 0.27 (0.22-0.32)
Tf_III L1Md_T F 66-42-42 4,678 1,892 2.233 ± 0.196 1.23 (1.12-1.34)
Gf_I L1Md_F, L1Md_T F 66-42-42-42 2,177 615 1.356 ± 0.250 0.75 (0.61-0.88)
Gf_II L1Md_T F 66-66-66 770 368 3.929 ± 0.421 2.16 (1.93-2.39)
L1MdF_I L1MdF2 F 66-42-42 5,112 1,209 3.853 ± 0.278 2.12 (1.97-2.27)
L1MdF_II L1MdF2 F 66-42-42 609 4.537 ± 0.271 2.50 (2.35-2.64)
L1MdF_III L1MdF2 F 66-66 548 8.040 ± 0.400 4.42 (4.20-4.64)
L1MdF_IV L1MdF2 F 66-42-42 6,179 964 11.627 ± 0.503 6.39 (6.12-6.67)
L1MdF_V L1VL1, L1MdF2 F 66-42 3,936 884 11.683 ± 0.487 6.43 (6.16-6.69)
L1MdFanc_I L1Md_F, L1_Mus1 Fanc 66-42 4,398 418 12.366 ± 0.610 6.80 (6.47-7.14)
L1MdFanc_II L1_Mus2 Fanc 66-66-66 16,491 460 16.795 ± 0.821 9.24 (8.79-9.69)
L1MdN_I L1VL1, L1Md_F, L1Md_F3 N 66-42-42 2,237 367 3.447 ± 0.212 1.90 (1.78-2.01)
L1MdV_I L1VL1, L1_Mus1 V 45-66 5,777 318 15.257 ± 0.647 8.39 (8.04-8.75)
L1MdV_II L1_Mus3 V 66 3,848 470 18.318 ± 0.855 10.07 (9.60-10.55)
L1MdV_III Lx V 66-66 NA N/A 17.575 ± 0.968 9.67 (9.13-10.20)
L1MdMus_I L1_Mus1 Mus 66-66-42-56 4,947 535 12.068 ± 0.590 6.64 (6.31-6.96)
L1MdMus_II L1_Mus2 Mus 66-66 1,924 304 14.971 ± 0.521 8.23 (7.95-8.52)
L1Lx_I L1_Mus3 Lx 66-66 1,649 384 19.864 ± 0.846 10.93 (10.46-11.39)
L1Lx_II L1_Mus4 Lx 66-66 3,546 186 23.907 ± 0.998 13.15 (12.60-13.70)
L1Lx_III L1_Mus4 Lx 66-66 3,667 193 18.595 ± 0.841 10.23 (9.76-10.69)
L1Lx_IV Lx Lx 66-66 NA N/A 25.642 ± 1.237 14.10 (13.42-14.78)
a
Family names based on Repeat Masker database. b
The genomic copy number of Tf_I and II and F_I, II, and III were combined due to the small number of diagnostic characters at the 3' end. c
Average pairwise divergences were calculated using the maximum composite likelihood method (MEGA 4.0 package). d
evolutionary histories and it is impossible to build a sin-gle phylogenetic tree based on the entire length of the element. Figure 1 shows the tree built using the longest non-recombining segment of ORF2 (2.5Kb). This seg-ment recapitulates the evolutionary history of L1 lineages more faithfully than other regions because it has not recruited older sequences that would have dis-torted its evolution. In addition, the branching order on this tree is generally consistent with the age of the
families (Table 1), so that older families are closer to the base of the tree and younger families appear more derived. The most recently active families, the L1MdA lineage (characterized by an A promoter) and the L1MdTf lineage (characterized by an F promoter), clus-ter into well supported paraphyletic and monophyletic lineages, respectively. Each of these lineages contains three families, namely L1MdA_I, II, and III and L1MdTf_I, II, and III. We also identified two families
Tf_I
Tf_II
Tf_III
Gf_I
A_III
Gf_II
A_I
A_II
A_IV
N_I
A_V
A_VI
A_VII
F_IV
F_V
F_I
F_II
F_III
V_I
Mus_II
Mus_I
Fanc_I
Fanc_II
Lx_I
V_II
Lx_II
V_III
Lx_III
Lx_IV
87 100
82
100
100 100
80
100
47 100
100
64
100
100 100
100 100
99
100 99
65
100
99
69
0.01
93
c
c
c
A
F
V
N
Mus
Lx
Promoter
Types
Figure 1Phylogenetic tree of mouse L1 families based on the longest non-recombining region of ORF2,including the reverse
transcriptase domain.This segment corresponds to the region between nucleotide 2095 and 4489 on the alignment provided as
that could be classified as L1MdGf, based on similarity with a previously described family [43]. However, these two families (provisionally named L1MdGf_I and II) do not form a monophyletic group as L1MdGf_I appears more related to L1MdTf and L1MdGf_II groups with L1MdA families. The branch leading to this group of ac-tive and recently acac-tive families is composed of four families with an A promoter (L1MdA_IV to VII) and the only family carrying the N promoter (L1MdN_I). These families evolved from a group of sequences carrying an F promoter (L1MdF_IV and V). Families L1MdF_I, II, and III constitute a lineage that evolved independently and in parallel with the main A lineage. The F lineage possibly evolved from a family which was carrying a V promoter and which appears to be the last active family with this promoter type. This family in turn evolved from a family carrying the Mus promoter, which appar-ently evolved from a family carrying the Fanc promoter (L1MdFanc_II). At the same time two families branched independently from the main lineage, one carrying a Mus promoter (L1MdMus_I) the other one the Fanc pro-moter (L1MdFanc_I). Preceding the L1MdFanc_II family a lineage made of four families with an Lx promoter was active. At two points in time the Lx promoter was replaced by the V promoter (yielding L1MdV_II and III) but these families did not persist or produce novel lineages.
One of the most striking features visible on the tree is that families with similar 5’UTRs do not form monophy-letic groups indicating that L1 families have frequently recruited novel 5’UTR, either from unknown sources or from ancient families. The oldest families in our study carried an Lx promoter, which was replaced three times: once by the Fanc promoter (L1MdFanc_II) and by the V promoter twice (L1MdV_II and III). The Fanc promoter was replaced independently twice by the Mus promoter as L1MdMus_I and L1MdMus_II do not form a mono-phyletic group. The Mus promoter was eventually replaced by the V promoter (L1MdV_I) and went ex-tinct. The F promoter was then resuscitated approxi-mately 6.4 MY ago and gave rise to families L1MdF_I to V. Approximately 4.6 MY ago the A promoter was recruited yielding the modern A lineage which extend from families L1MdA_VII to I. Within this lineage, an additional recruitment occurred resulting in the L1MdN_I family. Finally the F promoter was recently recruited twice, approximately 2.2 MY by the L1MdGf_II family and approximately 1.2 MY by the Tf/Gf_I lineage. Thus we estimate that L1 in mouse has experienced 11 replace-ments of 5’UTR.
The topology of the ORF2 tree indicates that mouse L1 families evolved mostly as a single lineage. This does not mean that a single family or single lineage was active at a time. In fact, the co-existence of multiple active
families characterizes the evolution of L1 for the last 13MY of mouse evolution. For instance between 1 and 2.5 MY ago, six families (L1MdTf_III, L1MdA_II, L1MdA_III, L1MdGf_II, LMdN_I, and L1MdF_I) were active in the mouse genome as attested by the overlap in their average pairwise divergence (Table 1). In some cases, several families evolved into lineages that diversi-fied and co-existed with the dominant lineage for several MY. The lineage composed of L1MdF_I, II, and III is the one that co-existed the longest with the lineage that yielded the currently active families. L1MdF_I was active 2.12 MY ago, at about the same time as families L1MdA_III and L1MdN_I. These families, however, are all descendants of family L1MdF_IV which was active 6.4 MY ago (Figure 1 and Table 1). Thus the lineage consisting of L1MdF_I, II, and III co-existed with the lineage that produced L1MdA_III and L1MdN_I for more than 4 MY. Eventually the L1MdF lineage became extinct. Thus the cascade structure of the ORF2 tree, typical of the single lineage mode of evolution reported in other mammals, is consistent with a model in which multiple families are concurrently active until one of them attains replicative supremacy, coinciding with the extinction of its competitors.
Detection of recombination among murine L1 families
Because L1 families have frequently recruited novel pro-moters we decided to examine if L1 lineages have exchanged genetic information in other regions of the element. To this end, several methods implemented in the RDP 3.0 software were used: two substitution-based approaches, MaxChi [54] and Chimera [55], and two phylogenetic approaches, Bootscan [56] and RDP [57]. Breakpoints and statistically significant events of genetic recombination detected by RDP were verified by visual inspection of the FL consensus alignment (see Additional file 3) and phylogenetic analyses. A minimum of six re-combination events was detected.
An
An
5’UTR ORF1 ORF2 3’UTR
A
F_I Gf_I F_II Gf_II F_III F_IV A_IV A_III A_I A_II V_I 99 100 100 49 98 83 74 92 A_I A_II Gf_II Gf_I A_III A_IV F_III F_I F_II F_IV V_I 82 100 81 100 100 92 100 61C
An Tf_I Tf_II Tf_III F_II F_I F_III A_IV A_III A_I A_II F_IV V_I 100 100 99 100 74 100 99 99 99 A_I A_II A_III Tf_III Tf_I Tf_II A_IV F_I F_II F_III F_IV V_I 99 89 94 100 100 100 98 92 95B
An A_I A_II A_III A_IV N_I A_V A_VI F_III F_I F_II F_IV V_I 99 66 99 100 95 98 84 98 63 A_I A_II A_III A_IV F_II F_III F_I A_VI N_I A_V F_IV V_I 100 97 76 99 91 98 61 71 97 A_I A_II A_III A_IV A_VI N_I A_V F_III F_I F_II F_IV V_I 100 100 99 98 100 96 53 42 99D
E
Gf_II F_II F_III A_IV A_VI A_V A_VII Mus_IIFanc_II
100 99 95 97 100 58 A_VI A_VII Gf_II F_III Fanc_II
Mus_II A_IV A_V F_II 85 99 59 74 A_V A_VI A_IV A_VII Gf_II F_II F_III Mus_II
Fanc_II
98 99 79 95 62 An (1541-2041) (2042-2542) (839-1339) (1367-1867)
(1-213) (214-471) (472-1218)
(4007-4507) (4546-5265) (5265-5760)
Figure 2Evidence for recombination between mouse L1 families.(A) Schematic structure of an L1 element; (B) Recombinant origin of the Tf
between L1MdGf_I and L1MdGf_II in ORF1 (see below). Based on differences in ORF1 we determined that L1MdGf_II could result from a recombination event between L1MdF_III and L1MdA_III and L1MdGf_I from recombination between L1MdF_I or II and L1MdA_III. The three L1MdTf families result from re-combination between L1MdF_II and L1MdA_III, but the breakpoint for the Tf families is located approximately 700 bp downstream from the breakpoints detected in the Gf families. This breakpoint is shared among the three Tf families suggesting the recombination event oc-curred at the origin of the Tf lineage.
The next oldest recombination event is between the ancestor of L1MdA_IV (which is the ancestor of L1MdA_I, II, and III) and L1MdF_II, near the 3’ end of the element (Figure 2D). A 666 bp region was trans-ferred from L1MdF_II to the L1MdA_IV family. This fragment is also found in all L1MdA sequences derived from L1MdA_IV as well as the Gf and Tf families since
they also acquired their ORF2 and 3’UTR from an
ancestral L1MdA family. Similarly, a segment located in the coiled-coil domain of ORF1 was transferred from L1MdMus_II to L1MdA_VII and L1MdA_VI (Figure 2E). Subsequently an overlapping region was transferred from L1MdA_VII or L1MdA_VI to L1MdF_III. This segment is also found in L1MdGf_II as this family got its ORF1 from L1MdF_III.
It should be noted that our criteria for identifying re-combination events were stringent, as we only considered the recombination of large segments to be significant. Thus it is plausible that exchanges of sequences of shorter length have occurred between L1 families but were not detected due to the small number of defining characters in some conserved regions of L1, such as ORF2. The number of recombination events reported here suggests that recombination has played a significant role in the evolution of novel L1 families in mouse and can occur across the entire length of L1.
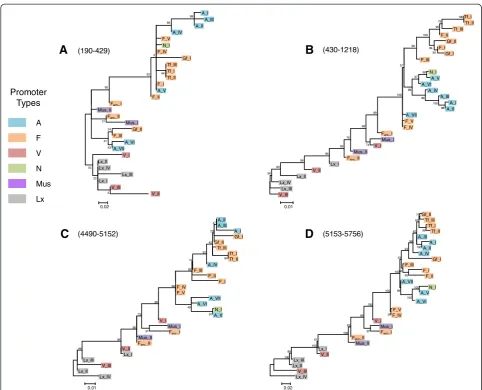
The exchange of genetic information between families constitutes a significant challenge for evolutionary ana-lyses as most phylogenetic algorithms do not allow for recombination. Thus we performed phylogenetic ana-lyses using regions of L1 delimited by recombination breakpoints to fully assess the impact of recombination on the evolutionary history of FL L1 elements (Figure 3). Trees A and B are based on the coiled coil domain of ORF1 and the 3’ half of ORF1 through the 5’ end of ORF2, respectively. The main difference between the ORF2 tree and tree B is that recently active families with similar 5’UTRs form monophyletic groups: families L1MdA_I to VI cluster together and families L1MdF_I, II, and III, Tf_I, II, and III, and Gf_I and II group to-gether (tree B on Figure 3). Further upstream in the coiled coil domain (tree A on Figure 3) this monophyly
vanishes because of the transfer of the coiled-coil motif from L1MdMus_II to L1MdA_VI, L1MdA_VII, L1MdGf_II, and L1MdF_III. Tree C is based on the 3’terminus of ORF2 and the 5’end of the 3’UTR. The main difference with the ORF2 tree is the position of all families that are descendant of families L1MdA_IV (that is L1MdA_I to III, the Tf, and the Gf families). These families appear closer to families L1MdF_I to III than to families L1MdA_V to VII because of the transfer of this segment from L1MdF_II to L1MdA_IV. Further downstream, the tree based on the 3’terminus of L1 (tree D) lacks resolution because of the length of the se-quence analyzed and the small number of characters differ-entiating the families. The main difference with tree C is the position of family L1MdGf_II which branch outside a
monophyletic group composed of families L1MdTf,
L1MdGf_I, and L1MdA_I to IV, consistent with the inde-pendent origin of this recombining family.
Evolution of the ORFs
We then examined the evolution of the protein coding sequences encoded in L1, ORF1, and ORF2. ORF2 is the most conserved region of L1. There are very few amino acid changes, in particular in the endonuclease and re-verse transcriptase domains which are functionally indis-pensable [21,58]. All the methods we used to assess the impact of selection on ORF2 indicate that this region is evolving under strong purifying selection, that is selec-tion against amino acid changes (Table 2). We analyzed separately the 5’and 3’ termini of ORF2 because of the presence of recombination. In both regions, the PARRIS methods found no evidence that a subset of amino-acid is evolving under positive selection and estimated a mean dN/dS of 0.308 and 0.229, for the 5’and 3’termini, respectively. Similarly, the values of dN/dS estimated by the GABranch method were all significantly lower than 1. In addition, two of the three methods used to detect selection at specific amino acid (SLAC and REL) failed to find evidence of positive selection, although they identified a large number of amino acid under negative selection (not shown). The FEL method identified two amino acids that could have evolved under positive se-lection but as these two residues have not been recov-ered by the two other methods, it is likely they constitute false-positives.
analyzed independently the 5’terminus, the CC domain, and the 3’ half of ORF1 for evidence of selection using recombination breakpoints as boundaries. All the meth-ods used strongly indicated that the 5’terminus and the 3’ half of ORF1 are evolving under purifying selection.
The PARRIS method rejected the hypothesis that a sub-set of amino acid is evolving under positive selection and the GABranch method showed that dN/dS has remained significantly lower than 1 in these regions dur-ing the entire evolutionary span covered by the analysis. A_I A_III A_II A_IV F_V N_I F_IV Gf_I Tf_III Tf_I Tf_II F_I A_V F_II Fanc_I
Mus_II Fanc_II
Mus_I Gf_II F_III A_VI A_VII V_I Lx_II Lx_IV Lx_III Lx_I V_III V_II 98 69 22 54 3 77 43 41 24 85 64 93 2 0.02 Tf_I Tf_II Tf_III F_II Gf_II F_I Gf_I F_III N_I A_V A_VI A_IV A_III A_I A_II A_VII F_V F_IV Fanc_I
Mus_I V_I Mus_II Fanc_II Lx_I V_II Lx_II Lx_IV Lx_III V_III 58 93 99 100 99 99 76 98 100 74 98 89 99 98 79 96 90 84 100 97 99 99 57 100 0.01 A_II A_III A_I Gf_I Gf_II Tf_III Tf_I Tf_II A_IV F_III F_II F_I F_IV F_V A_VII A_VI N_I A_V V_I Mus_I Fanc_I Mus_II Fanc_II
V_II Lx_I Lx_III V_III Lx_II Lx_IV 44 91 98 91 73 86 80 49 96 84 82 12 52 47 20 42 0.01 Gf_II Tf_III Tf_I Tf_II A_III A_I A_II A_IV Gf_I F_III F_I F_II A_VII N_I A_V A_VI F_V F_IV V_I Mus_I Fanc_I Fanc_II
Mus_II Lx_I V_II Lx_III Lx_II V_III Lx_IV 100 89 100 61 100 83 97 99 100 100 100 59 100 95 99 66 10052 43 100 94 56 76 67 62 0.02
A
C
B
D
A F V N Mus Lx Promoter Types (190-429) (4490-5152) (5153-5756) (430-1218)Figure 3Phylogenetic trees of mouse L1 families based on (A) the coiled coil domain, (B) the 3’end of ORF1 and the 5’terminus of
ORF2, (C) the 3’terminus of ORF2 and the 5’end of the 3’UTR and (D) the 3’terminus of the 3’UTR.The trees were built with the maximum-likelihood method using the JC (treeA), TN93+G (B), HKY+G (treeC) or T92 (treeD) models. The numbers indicate the percentage of time the labeled node was present in 1,000 bootstrap replicates of the data. The numbers in parentheses correspond to the position of the fragments used to build the tree relative to the alignment provided as supplementary material and beginning at position 1 of ORF1.
Table 2 Summary of selection detection tests
PARRIS GABranch Positively selected sites
ORF Regions Mean dN/dS Number of branches with positive selection SLAC FEL REL
ORF1 5' terminus 0.494 ± 0.275 0 0 0 0
Coiled coil 0.608 ± 0.401 0 0 0 8,089
3' terminus 0.354 ± 0.371 0 0 0 348,351
ORF2 5' terminus (1–1,170) 0.308 ± 0.411 0 0 0 0
This is not surprising, especially for the 3’half of ORF1, as the RRM and CTD motifs were shown to be con-served across mammals [60]. The SLAC, FEL, and REL programs failed to identify a single amino acid under positive selection at the 5’ end. In 3’, the REL method identified two amino acids under positive selection but these residues are likely to be false-positive as the changes in amino acid result from independent events of mutation at CpG nucleotides, which are known for their unusually high mutation rate.
More surprising is the degree of conservation at the amino acid level of the CC domain. Previous studies have shown that the CC domain of ORF1 has evolved under positive selection in primates [30,39]. In the case of the mouse, surprisingly, the PARRIS method rejected the hypothesis that some amino acid evolved under posi-tive selection, although a moderately high dN/dS ratio was obtained (0.608), and the GA Branch method failed to identify a single branch in the evolution of the coiled coil with a dN/dS >1. Out of the three methods (SLAC, FEL, and REL) used to detect selection at specific amino
acids, only one (REL) identified two amino acids that could have evolved under positive selection. It is thus plausible that these two sites are false-positive as they have been identified by a single method. Even if these sites are evolving under positive selection, it remains true that the signature of positive selection in the mouse CC is much weaker than it is in human [30,39].
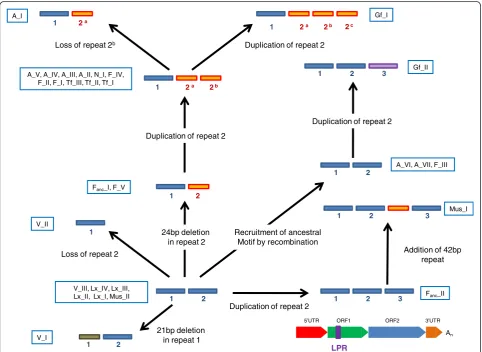
Although the CC domain is relatively conserved at the amino acid level, it shows a high level of structural vari-ation. Previous studies have identified a region called length polymorphism region (LPR) [33,61]. Using our FL consensus alignments we were able to reconstruct the complex history of this region (depicted on Figure 4). The ancestral state is found in the oldest families (Lx_I, Lx_II, Lx_III, Lx_IV, and L1MdMus_II) and contains two 66 bp repeats. From this ancestral motif, four inde-pendent modifications have occurred: the loss of the sec-ond 66 bp repeat in L1MdV_II, a 21 bp deletion in the first 66 bp repeat found in the L1MdV_I family, a dupli-cation of the second repeat resulting in three 66 bp repeats in L1MdFanc_II and a 24 bp deletion in the
Loss of repeat 2
1 2
1
1 2
V_II
V_III, Lx_IV, Lx_III, Lx_II, Lx_I, Mus_II
Fanc_I, F_V
1 2 3 Fanc_II
Duplication of repeat 2 Duplication of repeat 2
1 1
2 a 2b
2 a
Loss of repeat 2b
A_I
1 2 a 2b
24bp deletion in repeat 2
Recruitment of ancestral Motif by recombination
1 2
A_VI, A_VII, F_III Duplication of repeat 2
1 2 3 Gf_II
Gf_I
Duplication of repeat 2
A_V, A_IV, A_III, A_II, N_I, F_IV, F_II, F_I, Tf_III, Tf_II, Tf_I
1 2 Mus_I
Addition of 42bp repeat
1 2
V_I
21bp deletion in repeat 1
2c
3
An
5’UTR ORF1 ORF2 3’UTR
LPR
Figure 4Evolution of the length polymorphic region of ORF1 in mouse.The blue boxes correspond to the 66 bp motifs and the orange
second repeat found in L1MdFanc_I and L1MdF_IV. The 66–42 bp motif was followed by a duplication of the 42 bp unit resulting in a 66-42-42 bp structure which is found in families L1MdA_V to II, L1MdN_I, L1MdTf_III to I, and L1MdF_I, II, and V. This motif further evolved by the loss of the second 42 bp repeats in L1MdA_I and L1MdF_IV and by the addition of a third 42 bp unit in family L1MdGf_I. The ancestral 66–66 bp motif was recruited by recombination in families L1MdF_III, L1MdA_VI, and VII, and acquired a third 66 bp unit in family L1MdGf_II. These structural changes in the LPR resulted in changes in the length and structure of the CC. Coiled coils are formed from two or moreα-helical peptide chains that contain a distinct arrangement of non-polar side chains. Domains that can form CC con-sist of heptads (or seven residue repeats) with non-polar or hydrophobic residues in the first and fourth positions [62]. The CC in L1 plays an important role in holding together the dumbbell-shape ORF1p trimers [18]. The shortest CC domain is 66 amino acids long and contains seven heptads (based on predictions using the program COILS) in family L1MdV_I. The longest CC is 111 amino acids long and contains 12 heptads in family L1MdGf_I. Between these two extremes, families with 8, 10, and 11 heptads were found.
Evidence for the lateral transfer of L1 families
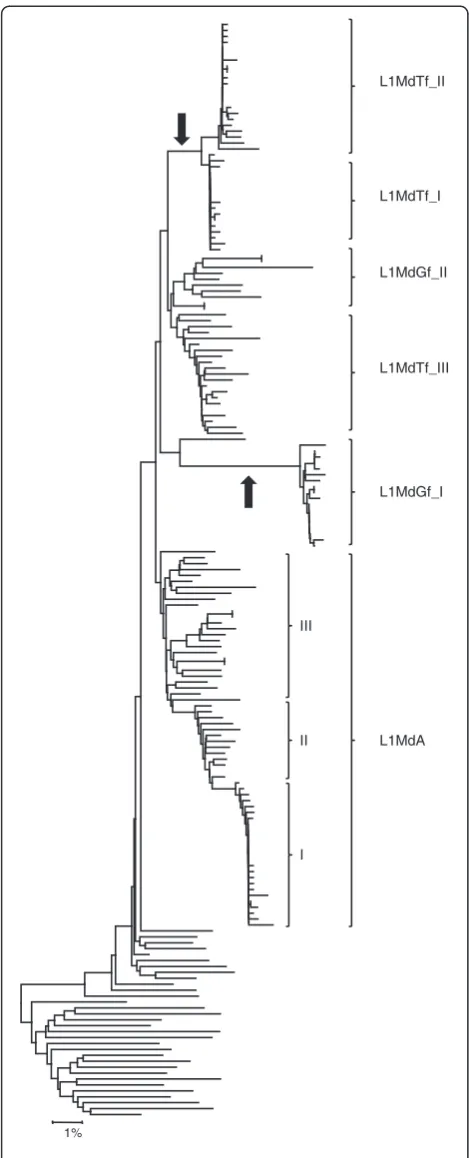
Finally, we examined the possibility of lateral transfer in the evolution of murine L1. In mammals, L1 is transmit-ted vertically and there is no evidence of lateral transfer [63], except in case of inter-specific hybridization. Inter-specific hybridization had previously been described among mice of the genusMusand it has been proposed that some L1 families in the house mouse genome were acquired by hybridization [44,64,65]. In order to detect hybridization we used a phylogenetic approach: if a L1 family is invading a genome through hybridization, long branches might be expected with a lack of intermediate sequence on a tree built using genomic copies. In con-trast, under the strict vertical mode of transmission, intermediate sequences would be expected between all families. We built a tree using the 3’ UTR of a large number of genomic copies representative of the most re-cently active families (Figure 5). Two cases of long branches with no intermediate sequences were found: one leading to the L1MdTf_I and II families, and the other leading to L1MdGf_I. This analysis suggests that the L1MdGf_II and L1MdTf_III families evolved within the house mouse genome but that the L1MdTf_I and II and the L1MdGf_I families were acquired through inter-specific hybridization. We can also infer that these trans-fers resulted from two independent hybridization events since the two Tf families amplified approximately 0.25
MY ago whereas L1MdGf_I amplified approximately 0.75 MY ago.
Discussion
We performed the first comprehensive analysis of L1 evolution since the completion of the mouse genome [2]. The analysis is limited to the most recently active L1 families and covers approximately the last 13 MY of mouse evolution. As murine rodents evolve approxi-mately eight times faster than hominoids, the amount of evolutionary change investigated here is similar to previ-ous studies in humans that covered more than 80 MY of primate evolution [30,35]. The results are consistent with the large number of analyses performed in the pre-genomic era [32,33,41-45,50,65-68] but, by focusing solely on intact FL elements, we were able to provide for the first time a complete picture of the evolution of mouse L1 families over the entire length of the element.
Evolution of L1 as a single lineage
that the conditions that allow for multiple lineages to co-exist are the same in mouse and in human. Unlike in modern human where a single family is currently active (the Ta family) [28], the modern house mouse genome harbors several families with different 5’ UTR and con-sequently present an excellent model to test experimen-tally the hypothesis that the activity of different 5’UTR is one of the conditions for the co-existence of families and lineages.
Acquisition and exchange of sequence during L1 evolution
The analysis of FL elements has revealed the extraordin-ary ability of L1 families to acquire novel motifs and to exchange sequences (Figures 2 and 3). The recruitment of novel 5’UTR sequences [30,33] as well as the recom-binant nature of some L1 families in mouse [45,46] and rat [34,69,70] have long been described. Three mechan-isms have been proposed to account for the mosaic na-ture of some families. First, recombination between genomic copies, that is at the level of DNA templates, could result in the formation of a novel transpositionally competent family. This hypothesis has been discounted on the basis that it is highly unlikely that a chance re-combination event between two replicatively competent elements occurred while recombination between any of the hundreds of thousands L1 pseudogenes, the majority of which have suffered the effect of inactivating muta-tions, is much more likely to produce an inactive elem-ent [69]. Second, recombination could occur at the time the L1 RNA is reverse-transcribed and could result from the formation of a RNA/DNA heteroduplex between the L1 RNA and a genomic copy at the insertion site [71]. This model is supported by the observation that the re-cruitment of novel motifs seems to be directional as it is always a chronologically young 3’ end that recruits an older 5’ terminus [69]. Third, mosaic elements could be produced if the L1 encoded reverse transcriptase switches RNA strand at the time of insertion. Polymer-ase strand-switching is a well-known feature of RNA viruses [72,73]. This mechanism insures that recombin-ation occurs between replicatively competent elements, that is elements that carry a 5’UTR capable of driving
1%
L1MdGf_II
L1MdTf_III
L1MdGf_I
L1MdA L1MdTf_I L1MdTf_II
I II III
Figure 5Phylogeny of genomic copies showing lateral transfer
their transcription. The third model predicts that recom-bination occurs only between families that are simultan-eously active whereas the first and second models do not have such a requirement. We found that the ex-change of genetic information occurs both between sim-ultaneously active families and by resuscitation of motifs from extinct families. For instance, the coiled-coil do-main of L1MdMus_II has been recruited by L1MdA_VII about 4.6 MY ago, long after the extinction of L1MdMu-s_II which was active 8.23 MY ago. The L1MdGf_II fam-ily is also the product of a recombination between two families that were not active simultaneously, the L1MdF_III and the L1MdA_III families (which amplified 4.42 and 2.15 MY ago, respectively). All other instances of recombination occurred between families that were simultaneously active, which is consistent with the poly-merase strand-switching model. Similarly, the acquisi-tion of novel 5’UTRs tend to result from the transfer of 5’ termini between families that were active at the same time. This is exemplified by the evolution of the F-type which was transferred from L1MdFanc_I (active 6.80 MY ago) to the ancestor of L1MdF_V (at 6.43 MY) and subsequently transferred from L1MdF_I (active 2.12 MY ago) to the recently active L1MdTf and L1MdGf families.
Evolution of ORF1
The first ORF is arguably the least understood region of L1, although it has been the subject of much attention in the past few years [17-20,59,60,74-78]. Its secondary structure has been resolved as a dumbbell shape result-ing from the formation of a trimeric structure mediated by the coiled coil domain [18]. It is established that it has RNA-binding abilities, mediated by the RRM, can act as a nucleic acid chaperone [19,20] and form multi-mers in the presence of nucleic acids [78]. Previous studies have shown that the 3’half of ORF1 is very con-served [60] and our analysis confirms this is the case in mouse. In contrast, studies in human have demonstrated that the coiled-coil domain is evolving under strong positive selection as indicated by the high values of dN/ dS reported in the evolution of this region [30,39]. Such a rapid evolution at the amino-acid level is certainly adaptive and it was proposed that this was the result of an arms-race between L1 and its human host. This hy-pothesis was further supported by the fact that periods of adaptive evolution in the coiled coil coincide with period of intense L1 activity [30]. However, we failed to find strong evidence of adaptive evolution in the mouse coiled coil. In contrast we found an extraordinary level of structural instability in this region (Figure 4), unex-pected in a protein coding region critical for the multi-meric structure of the functional protein. Instability in this region has also been described in the rat L1
suggesting a common role for these structural changes in these two species [34,69]. Structural changes in the coiled coil occur so frequently that it is tempting to speculate that they are adaptive, and are evolutionarily equivalent to periods of intense amino acid replacement in humans.
Conclusions
We performed a comprehensive analysis of L1 evolution in mouse. This analysis covered the last 13 MY of mouse evolution, since the split between mouse and rat. The mouse L1 has evolved as a single lineage for most of its evolution, although co-existence between families carry-ing different promoter sequences was observed. L1 fam-ilies have frequently acquired novel 5’UTR and have exchanged sequences over the entire length of the elem-ent. No evidence of rapid amino acid replacement in the ORF1 was detected, although it is likely that the struc-tural instability of the CC domain is adaptive. The gen-eral pattern of evolution of mouse L1 is similar to the one in human suggesting that the nature of the interac-tions between L1 and its host might be similar in these two species. There are however some intriguing differ-ences between mouse and human, particularly in the evolution of ORF1. These differences suggest that the molecular mechanisms involved in host-L1 interactions might be different in these two species.
Methods
Collection and classification of full-length L1 elements
Full-length (FL) elements were collected from the Mus
musculus2006 (mm8) genome built using the GPS [79].
families and were validated by a second round of phylo-genetic analysis based on the principle that elements belonging to the same family should yield a star phyl-ogeny because they result from the activity of similar progenitors. These families were further confirmed by phylogenetic analysis performed on other regions of L1 to verify that the homogeneity of the families extend over the entire length of the element. Full-length con-sensus sequences were derived for each family and are available on Repbase. Phylogenetic analyses were per-formed using the neighbor joining (NJ) method [52] based on the maximum composite likelihood parameters distance included in the MEGA 5.01 software package [80]. The model that best fits the data was determined for each alignment using MEGA. The robustness of each phylogenetic tree was assessed using a bootstrap proced-ure with 1,000 replicates. Families were named by the name of the 5’ promoter (A, F, Fanc, V, Lx, Mus, or N; see result) followed by a roman number. The smaller the roman number, the younger the family is. For instance families L1MdA_I, L1MdA_II, and L1MdA_III are sub-sets of the previously described L1MdA family; family L1MdA_I is younger than family L1MdA_II and family L1MdA_III is the oldest of the three. We kept the Gf [43] and Tf [42] names for the recently active Tf and Gf families because these names have been widely used in the literature.
Analysis of FL elements
NJ, maximum parsimony (MP), and maximum likeli-hood (ML) trees were calculated for each region of L1. Phylogenetic trees were reconstructed using the MEGA 5.01 package [80]. The RDP3.0 program (Recombination Detection Program 3.0, available at http://darwin.uvigo. es/rdp/rdp.html) was used to search for evidence of recombination among families. RDP allows for the use of several recombination detection methods includ-ing substitution and phylogeny-based methods. Two substitution-based methods, MaxChi [54] and Chimaera [55], as well as a phylogenetic method, bootscan [56], were used to analyze the datasets. The RDP software also includes its own unique algorithm termed ‘RDP’ [57] which is also a phylogenetic approach to detecting recombination. A window size of 50 bp was used to de-tect breakpoints between consensus sequences. Statisti-cally significant events of recombination were verified by comparing phylogenetic trees on each side of the puta-tive breakpoint.
To test for evidence of selection in the evolution of L1 several methods implemented in the web server www. datamonkey.com [81] of the HyPhy program [82] were used. The first method uses a maximum likelihood ap-proach (PARRIS) to determine if a proportion of site in an alignment evolves with a ratio dN/dS>1 [83]. A ratio
significantly >1 is indicative of positive selection whereas a ratio <1 is indicative of purifying selection. The second method, GABranch [84] can detect lineage-specific vari-ation in selective pressure and requires noa priori specifi-cation of branches in a phylogeny that may have evolved under different values of dN/dS. The dN/dS test is how-ever not very sensitive, particularly if selection acts on a few codons. For this reason we used three methods designed to detect the action of positive or negative selec-tion at specific sites in an alignment: Single Likelihood Ancestor Counting (SLAC), a Random Effects Likelihood (REL), and Fixed Effects Likelihood (FEL) [85]. For each dataset, the model that best fits the data was determined using the tool available at datamonkey.com. As selection detection methods are sensitive to recombination, we per-formed our analyses independently for each segment of L1 flanked by recombination breakpoint. Previous studies on human L1 have documented positive selection in the coiled-coil (CC) domain of ORF1 [30,39]. CC structures are formed from two or moreα-helical peptide chains that contain a distinct arrangement of non-polar side chains [62]. Domains that can form CC consist of heptads (or seven residue repeats) with non-polar or hydrophobic residues in the first and fourth positions. The program COILS [62] was used to identify the position of the CC domain in each consensus sequence as well as the number of constitutive heptads.
Age and copy number of L1 families
The age of each subfamily was estimated by calculating the average pairwise divergence based on the 3’UTR. CpG dinucleotides and the highly mutable polypurine tract located in the 3’UTR were removed from align-ment. The average divergence between copies as well as the standard error was calculated using the maximum likelihood parameter distance (using the MEGA 5.01 software). Divergences were converted to time assuming a neutral rodent genomic substitution rate of 1.1%/MY (calculated using the data presented on Table 5 of [86] and assuming a divergenceMus/Rattusat 13MY [53]).
Availability of supporting data
The consensus sequences are available in Repbase (http://www.girinst.org/repbase/).
Additional files
Additional file 1:Alignment of mouse L1 consensus sequences
starting at the beginning of ORF1.ORF1 spans positions 1 to 1,218 and ORF2 spans positions 1,262 to 5,096.
Additional file 2:Matrix of pairwise divergence based on the
Additional file 3:Alignments showing recombination break-points among L1 families.Only the parsimony-informative sites are shown.
Abbreviations
CC: Coiled coil; FL: Full length; LINE-1 L1: Long Interspersed Nuclear Elements-1; MY: Million of year; ORF: Open reading frame; UTR: Untranslated region.
Competing interests
The authors declare they have no competing interests.
Authors’contributions
AS collected data, performed alignments, analyzed the sequences evolutionarily, and wrote an early draft of the manuscript. CH and MM collected the data using GPS and provided editorial suggestions. SB designed the research and wrote the paper. All authors read and approved the final manuscript.
Author details
1Department of Biology, Queens College, the City University of New York, 65-30 Kissena Boulevard, Flushing, NY 11367-1597, USA.2School of Life Sciences, Arizona State University, Tempe, AZ, USA.3Center for Evolutionary Medicine and Informatics, Biodesign Institute, Arizona State University, Tempe, AZ, USA.4Department of Microbiology, Montana State University, Bozeman, MT, USA.5The Graduate Center, the City University of New York, New York, NY, USA.
Received: 19 July 2012 Accepted: 25 October 2012 Published: 3 January 2013
References
1. Lander ES, Linton LM, Birren B, Nusbaum C, Zody MC, Baldwin J, Devon K, Dewar K, Doyle M, FitzHugh W, Funke R, Gage D, Harris K, Heaford A, Howland J, Kann L, Lehoczky J, LeVine R, McEwan P, McKernan K, Meldrim J, Mesirov JP, Miranda C, Morris W, Naylor J, Raymond C, Rosetti M, Santos R, Sheridan A, Sougnez C,et al:Initial sequencing and analysis of the human genome.Nature2001,409:860–921.
2. Mouse Genome Sequencing C, Waterston RH, Lindblad-Toh K, Birney E, Rogers J, Abril JF, Agarwal P, Agarwala R, Ainscough R, Alexandersson M, An P, Antonarakis SE, Attwood J, Baertsch R, Bailey J, Barlow K, Beck S, Berry E, Birren B, Bloom T, Bork P, Botcherby M, Bray N, Brent MR, Brown DG, Brown SD, Bult C, Burton J, Butler J, Campbell RD,et al:Initial sequencing and comparative analysis of the mouse genome.Nature2002,420:520–562. 3. Han JS, Boeke JD:LINE-1 retrotransposons: Modulators of quantity and
quality of mammalian gene expression?Bioessays2005,27:775–784. 4. Han JS, Szak ST, Boeke JD:Transcriptional disruption by the L1
retrotransposon and implications for mammalian transcriptomes.Nature
2004,429:268–274.
5. Horie K, Saito ES, Keng VW, Ikeda R, Ishihara H, Takeda J:Retrotransposons influence the mouse transcriptome: implication for the divergence of genetic traits.Genetics2007,176:815–827.
6. Akagi K, Li J, Stephens RM, Volfovsky N, Symer DE:Extensive variation between inbred mouse strains due to endogenous L1 retrotransposition. Genome Res2008,18:869–880.
7. Boissinot S, Davis J, Entezam A, Petrov D, Furano AV:Fitness cost of LINE-1 (L1) activity in humans.Proc Natl Acad Sci U S A2006,103:9590–9594. 8. Boissinot S, Entezam A, Furano AV:Selection against deleterious
LINE-1-containing loci in the human lineage.Mol Biol Evol2001,18:926–935. 9. Kazazian HH, Wong C, Youssoufian H, Scott AFDGP, Antonarakis SE:
Haemophilia A resulting fromde novoinsertion of L1 sequences represents a novel mechanism for mutation in man.Nature1988, 332:164–166.
10. Chen JM, Stenson PD, Cooper DN, Ferec C:A systematic analysis of LINE-1 endonuclease-dependent retrotranspositional events causing human genetic disease.Hum Genet2005,117:411–427.
11. Burwinkel B, Kilimann MW:Unequal homologous recombination between LINE-1 elements as a mutational mechanism in human genetic disease. J Mol Biol1998,277:513–517.
12. Song M, Boissinot S:Selection against LINE-1 retrotransposons results principally from their ability to mediate ectopic recombination.Gene
2007,390:206–213.
13. Cost GJ, Feng Q, Jacquier A, Boeke JD:Human L1 element target-primed reverse transcription in vitro.EMBO J2002,21:5899–5910.
14. Luan DD, Eickbush TH:RNA template requirements for target DNA-primed reverse transcription by the R2 retrotransposable element.Mol Cell Biol1995,15:3882–3891.
15. Luan DD, Korman MH, Jakubczak JL, Eickbush TH:Reverse transcription of R2Bm RNA is primed by a nick at the chromosomal target site: a mechanism for non-LTR retrotransposition.Cell1993,
72:595–605.
16. Januszyk K, Li PW, Villareal V, Branciforte D, Wu H, Xie Y, Feigon J, Loo JA, Martin SL, Clubb RT:Identification and solution structure of a highly conserved C-terminal domain within ORF1p required for
retrotransposition of long interspersed nuclear element-1.J Biol Chem
2007,282:24893–24904.
17. Martin SL:Nucleic acid chaperone properties of ORF1p from the non-LTR retrotransposon, LINE-1.RNA Biol2010,7:706–711.
18. Martin SL, Branciforte D, Keller D, Bain DL:Trimeric structure for an essential protein in L1 retrotransposition.Proc Natl Acad Sci U S A2003, 100:13815–13820.
19. Martin SL, Bushman FD:Nucleic acid chaperone activity of the ORF1 protein from the mouse LINE-1 retrotransposon.Mol Cell Biol2001, 21:467–475.
20. Martin SL, Cruceanu M, Branciforte D, Wai-Lun Li P, Kwok SC, Hodges RS, Williams MC:LINE-1 retrotransposition requires the nucleic acid chaperone activity of the ORF1 protein.J Mol Biol2005,348:549–561. 21. Feng Q, Moran JV, Kazazian HH, Boeke JD:Human L1 retrotransposon
encodes a conserved endonuclease required for retrotransposition.Cell
1996,87:905–916.
22. Mathias SL, Scott AF, Kazazian HH, Boeke JD, Gabriel A:Reverse transcriptase encoded by a human transposable element.Science1991, 254:1808–1810.
23. Minakami R, Kurose K, Etoh K, Furuhata Y, Hattori M, Sakaki Y:Identification of an internal cis-element essential for the human L1 transcription and a nuclear factor(s) binding to the element.Nucleic Acids Res1992, 20:3139–3145.
24. Swergold GD:Identification, characterization, and cell specificity of a human LINE-1 promoter.Mol Cell Biol1990,10:6718–6729.
25. Howell R, Usdin K:The ability to form intrastrand tetraplexes is an evolutionarily conserved feature of the 3' end of L1 retrotransposons. Mol Biol Evol1997,14:144–155.
26. Martin SL, Li W-HP, Furano AV, Boissinot S:The structures of mouse and human L1 elements reflect their insertion mechanism.Cytogenet Genome Res2005,110:223–228.
27. Ostertag EM, Kazazian HH Jr:Twin priming: a proposed mechanism for the creation of inversions in L1 retrotransposition.Genome Res2001, 11:2059–2065.
28. Boissinot S, Chevret P, Furano AV:L1 (LINE-1) retrotransposon evolution and amplification in recent human history.Mol Biol Evol2000,17:915–928. 29. Hardies SC, Martin SL, Voliva CF, Hutchison CA 3rd:An analysis of
replacement and synonymous changes in the rodent L1 repeat family. Mol Biol Evol1986,3:109–125.
30. Khan H, Smit A, Boissinot S:Molecular evolution and tempo of amplification of human LINE-1 retrotransposons since the origin of primates.Genome Res2006,16:78–87.
31. Pascale E, Liu C, Valle E, Usdin K, Furano AV:The evolution of long interspersed repeated DNA (L1, LINE 1) as revealed by the analysis of an ancient rodent L1 DNA family.J Mol Evol1993,36:9–20.
32. Voliva CF, Martin SL, Hutchison CA 3rd, Edgell MH:Dispersal process associated with the L1 family of interspersed repetitive DNA sequences. J Mol Biol1984,178:795–813.
33. Adey NB, Schichman SA, Graham DK, Peterson SN, Edgell MH, Hutchison CA 3rd:Rodent L1 evolution has been driven by a single dominant lineage that has repeatedly acquired new transcriptional regulatory sequences. Mol Biol Evol1994,11:778–789.
34. Cabot EL, Angeletti B, Usdin K, Furano AV:Rapid evolution of a young L1 (LINE-1) clade in recently speciatedRattustaxa.J Mol Evol1997,45:412–423. 35. Smit AF, Toth G, Riggs AD, Jurka J:Ancestral, mammalian-wide subfamilies
36. Ferguson NM, Galvani AP, Bush RM:Ecological and immunological determinants of influenza evolution.Nature2003,422:428–433. 37. Holmes EC, Grenfell BT:Discovering the phylodynamics of RNA viruses.
PLoS Comput Biol2009,5:e1000505.
38. Fitch WM, Leiter JM, Li XQ, Palese P:Positive Darwinian evolution in human influenza A viruses.Proc Natl Acad Sci U S A1991,88:4270–4274. 39. Boissinot S, Furano AV:Adaptive evolution in LINE-1 retrotransposons.
Mol Biol Evol2001,18:2186–2194.
40. Adey NB, Comer MB, Edgell MH, Hutchison CA 3rd:Nucleotide sequence of a mouse full-length F-type L1 element.Nucleic Acids Res1991,19:2497. 41. Casavant NC, Hardies SC:The dynamics of murine LINE-1 subfamily
amplification.J Mol Biol1994,241:390–397.
42. DeBerardinis RJ, Goodier JL, Ostertag EM, Kazazian HH Jr:Rapid amplification of a retrotransposon subfamily is evolving the mouse genome.Nat Genet1998,20:288–290.
43. Goodier JL, Ostertag EM, Du K, Kazazian HH Jr:A novel active L1 retrotransposon subfamily in the mouse.Genome Res2001,11:1677–1685. 44. Hardies SC, Wang L, Zhou L, Zhao Y, Casavant NC, Huang S:LINE-1 (L1)
lineages in the mouse.Mol Biol Evol2000,17:616–628.
45. Mears ML, Hutchison CA 3rd:The evolution of modern lineages of mouse L1 elements.J Mol Evol2001,52:51–62.
46. Saxton JA, Martin SL:Recombination between subtypes creates a mosaic lineage of LINE-1 that is expressed and actively retrotransposing in the mouse genome.J Mol Biol1998,280:611–622.
47. Schichman SA, Adey NB, Edgell MH, Hutchison CA 3rd:L1 A-monomer tandem arrays have expanded during the course of mouse L1 evolution. Mol Biol Evol1993,10:552–570.
48. Wincker P, Jubier-Maurin V, Roizes G:Unrelated sequences at the 5' end of mouse LINE-1 repeated elements define two distinct subfamilies.Nucleic Acids Res1987,15:8593–8606.
49. Smit AFA, Hubley R, Green P:RepeatMasker Open-3.0. 2010.
50. Jubier-Maurin V, Cuny G, Laurent A-M, Paquereau L, Roizes G:A new 5' sequence associated with mouse L1 elements is representative of a major class of L1 termini.Mol Biol Evol1992,9:41–55.
51. Jubier-Maurin V, Wincker P, Cuny G, Roizes G:The relationships between the 5' end repeats and the largest members of the L1 interspersed repeated family in the mouse genome.Nucleic Acids Res1987,15:7395–7410. 52. Saitou N, Nei M:The neighbor-joining method: a new method for
reconstructing phylogenetic trees.Mol Biol Evol1987,4:406–425. 53. Jaeger J-J, Tong H, Buffetaut E:The age ofMus-Rattusdivergence:
paleontological data compared with the molecular clock.C R Acad Sci III
1986,302:917–922.
54. Maynard Smith J:Analyzing the mosaic structure of genes.J Mol Evol
1992,34:126–129.
55. Posada D, Crandall KA:Evaluation of methods for detecting recombination from DNA sequences: computer simulations.Proc Natl Acad Sci U S A2001,98:13757–13762.
56. Martin DP, Posada D, Crandall KA, Williamson C:A modified bootscan algorithm for automated identification of recombinant sequences and recombination breakpoints.AIDS Res Hum Retroviruses2005,21:98–102. 57. Martin D, Rybicki E:RDP: detection of recombination amongst aligned
sequences.Bioinformatics2000,16:562–563.
58. Moran JV, Holmes SE, Naas TP, DeBerardinis RJ, Boeke JD, Kazazian HH Jr: High frequency retrotransposition in cultured mammalian cells.Cell1996, 87:917–927.
59. Hohjoh H, Singer MF:Sequence-specific single-strand RNA binding protein encoded by the human LINE-1 retrotransposon.EMBO J1997, 16:6034–6043.
60. Khazina E, Weichenrieder O:Non-LTR retrotransposons encode noncanonical RRM domains in their first open reading frame.Proc Natl Acad Sci U S A2009,106:731–736.
61. Schichman SA, Severynse DM, Edgell MH, Hutchison CA 3rd:Strand-specific LINE-1 transcription in mouse F9 cells originates from the youngest phylogenetic subgroup of LINE-1 elements.J Mol Biol1992,224:559–574. 62. Lupas A, Van Dyke M, Stock J:Predicting coiled coils from protein
sequences.Science1991,252:1162–1164.
63. Kordis D, Lovsin N, Gubensek F:Phylogenomic analysis of the L1 retrotransposons in Deuterostomia.Syst Biol2006,55:886–901. 64. Casavant NC, Hardies SC:Shared sequence variants ofMus spretusLINE-1
elements tracing dispersal to within the last 1 million years.Genetics
1994,137:565–572.
65. Rikke BA, Zhao Y, Daggett LP, Reyes R, Hardies SC:Mus spretusLINE-1 sequences detected in the Mus musculus inbred strain C57BL/6J using LINE-1 DNA probes.Genetics1995,139:901–906.
66. Casavant NC, Lee RN, Sherman AN, Wichman HA:Molecular evolution of two lineages of L1 (LINE-1) retrotransposons in the california mouse, Peromyscus californicus.Genetics1998,150:345–357.
67. Martin SL, Voliva CF, Hardies SC, Edgell MH, Hutchison CA 3rd:Tempo and mode of concerted evolution in the L1 repeat family of mice.Mol Biol Evol1985,2:127–140.
68. Padgett RW, Hutchison CA 3rd, Edgell MH:The F-type 5' motif of mouse L1 elements: a major class of L1 termini similar to the A-type in organization but unrelated in sequence.Nucleic Acids Res1988, 16:739–749.
69. Furano AV:The biological properties and evolutionary dynamics of mammalian LINE-1 retrotransposons.Prog Nucleic Acid Res Mol Biol2000, 64:255–294.
70. Hayward BE, Zavanelli M, Furano AV:Recombination creates novel L1 (LINE-1) elements inRattus norvegicus.Genetics1997,146:641–654. 71. Symer DE, Connelly C, Szak ST, Caputo EM, Cost GJ, Parmigiani G, Boeke JD:
Human L1 retrotransposition is associated with genetic instability in vivo.Cell2002,110:327–338.
72. Coffin JM:Structure, replication, and recombination of retrovirus genomes: some unifying hypotheses.J Gen Virol1979,42:1–26. 73. Gilboa E, Mitra SW, Goff S, Baltimore D:A detailed model of reverse
transcription and tests of crucial aspects.Cell1979,18:93–100. 74. Kolosha VO, Martin SL:In vitro properties of the first ORF protein from
mouse LINE-1 support its role in ribonucleoprotein particle formation during retrotransposition.Proc Natl Acad Sci U S A1997,94:10155–10160. 75. Kolosha VO, Martin SL:High-affinity, non-sequence-specific RNA binding
by the open reading frame 1 (ORF1) protein from long interspersed nuclear element 1 (LINE-1).J Biol Chem2003,278:8112–8117. 76. Martin SL:Ribonucleoprotein particles with LINE-1 RNA in mouse
embryonal carcinoma cells.Mol Cell Biol1991,11:4804–4807.
77. Martin SL:The ORF1 protein encoded by LINE-1: structure and function during L1 retrotransposition.J Biomed Biotechnol2006,2006:45621. 78. Callahan KE, Hickman AB, Jones CE, Ghirlando R, Furano AV:Polymerization
and nucleic acid-binding properties of human L1 ORF1 protein.Nucleic Acids Res2012,40:813–827.
79. McClure MA, Richardson HS, Clinton RA, Hepp CM, Crowther BA, Donaldson EF:Automated characterization of potentially active retroid agents in the human genome.Genomics2005,85:512–523.
80. Tamura K, Peterson D, Peterson N, Stecher G, Nei M, Kumar S:MEGA5: Molecular evolutionary genetics analysis using maximum likelihood, evolutionary distance and maximum parsimony methods.Mol Biol Evol
2011,28:2731–2739.
81. Delport W, Poon AF, Frost SD, Kosakovsky Pond SL:Datamonkey 2010: a suite of phylogenetic analysis tools for evolutionary biology. Bioinformatics2010,26:2455–2457.
82. Pond SL, Frost SD, Muse SV:HyPhy: hypothesis testing using phylogenies. Bioinformatics2005,21:676–679.
83. Scheffler K, Martin DP, Seoighe C:Robust inference of positive selection from recombining coding sequences.Bioinformatics2006,22:2493–2499. 84. Pond SL, Frost SD:A genetic algorithm approach to detecting
lineage-specific variation in selection pressure.Mol Biol Evol2005,22:478–485. 85. Kosakovsky Pond SL, Frost SD:Not so different after all: a comparison of
methods for detecting amino acid sites under selection.Mol Biol Evol
2005,22:1208–1222.
86. Gibbs RA, Weinstock GM, Metzker ML, Muzny DM, Sodergren EJ, Scherer S, Scott G, Steffen D, Worley KC, Burch PE, Okwuonu G, Hines S, Lewis L, DeRamo C, Delgado O, Dugan-Rocha S, Miner G, Morgan M, Hawes A, Gill R, Celera, Holt RA, Adams MD, Amanatides PG, Baden-Tillson H, Barnstead M, Chin S, Evans CA, Ferriera S, Fosler C,et al:Genome sequence of the Brown Norway rat yields insights into mammalian evolution.Nature
2004,428:493–521.
doi:10.1186/1759-8753-4-3