Fuel ethanol production using novel carbon sources
and fermentation medium optimization
with response surface methodology
Weihua Wu
(Department of Biological and Agricultural Engineering, University of California, Davis, CA 95616, USA)
Abstract: In this study, ethanol production abilities of the novel carbon sources: sodium and calcium gluconate in different minimal and rich media were compared with glucose using Escherichia coli KO11. The strain produced higher ethanol yield in the rich medium Luria-Bertani (LB) than the other two minimal media: corn steep liquor (CSL) and M9 for two substrates (sodium and calcium gluconate). Additionally, higher ethanol yields were achieved when the strain was grown in LB and M9 medium with calcium gluconate than sodium gluconate, while the ethanol yields were similar when both sodium and calcium gluconate were added into CSL medium respectively. Response surface methodology was used to optimize the fermentation medium components for enhancing ethanol production using strain E. coli KO11 in CSL medium with calcium gluconate as the substrate in batch culture. The concentration of the potassium phosphate buffer is the only significant factor among five factors considered. A quadratic model was developed to describe the relationship between ethanol production and the factors. The optimal conditions predicted for five factors were 14.38 g/L CSL, 0.0398 g/L FeCl3·6H2O, 1.12 g/L MgSO4·6H2O, 15.41 g/L
(NH4)2SO4, and 1.58/1.26 g/L KH2PO4/K2HPO4 (2:1 molar ratio). The highest ethanol concentration under optimal conditions
was 31.5 g/L, which was 5.6 g/L higher than that from the same fermentation concentration of calcium gluconate in LB media. The high correlation between the predicted and experimental values confirmed the validity of the model.
Keywords: gluconate salts, ethanol, response surface methodology, medium optimization, biofuel DOI: 10.3965/j.ijabe.20130602.006
Citation: Wu W H. Fuel ethanol production using novel carbon sources and fermentation medium optimization with response surface methodology. Int J Agric & Biol Eng, 2013; 6(2): 42-53.
1 Introduction
Amid rising global energy demand and pressing
environmental issues, there are growing interests in the production of fuels and chemicals from renewable resources. Ethanol remains the most actively pursued
biofuel at the industrial level. However, the lack of low-cost technology to overcome the recalcitrance of cellulosic biomass impedes widespread of ethanol
production from lignocellulosic biomass feedstocks[1,2]. An important strategy for lowering the overall process cost
Received date: 2012-10-31 Accepted date: 2013-04-28 Biography: Weihua Wu, PhD, Research interests: biomass deconstruction, synthetic biology, protein engineering, bioprocess engineering. Tel: (+1)-925-294-3326; Fax: (+1)-925-294-1489; E-mail: [email protected]; [email protected].
is process consolidation[3,4]. A novel biochemical route for fuels and chemicals production was proposed by Fan et al.[5], in which sugar acids were produced from cellulosic materials instead of sugars for subsequent
conversion to fuels and chemicals. Advantage of the process is the consolidation of cellulase production and enzymatic hydrolysis steps, and potentially the
pretreatment step. Sugar acids (majorly gluconate) produced from cellulosic biomass could potentially be
cheaper than sugars produced from cellulosic biomass[5]. Gluconate was utilized via the Entner-Doudoroff pathway by Escherichia coli KO11 to produce ethanol and acetate
85% of the theoretical yield, while acetate production
reached the theoretical yield when Luria-Bertani (LB)
medium was used[5].
Ec = E. coli; Bs = B. stearothermophilus; Zm = Z. mobilis; PTS = phosphotransferase system; PGKEc = phosphoglycerate kinase; PYKBs = heterologous
pyruvate kinase; PYKA = pyruvate kinase A; PYKF = pyruvate kinase F; LDH = lactate dehydrogenase; PTA = phosphotransacetylase; ACK = acetate kinase; ACDH = acetaldehyde dehydrogenase; ADHE = alcohol dehydrogenase; PDCZm = pyruvate decarboxylase; ADHIIZm = alcohol dehydrogenase;
GUS = gluconate uptake system; GLK = gluconate kinase; EDD = 6-phosphogluconate dehydratase; KGA = phosphor-2-keto-3-deoxygluconate aldolase. Metabolites: G6P = glucose-6-phosphate; F6P = fructose-6-phosphate; F1, 6DP = fructose-1, 6-diphosphate; G3P = glyceraldehyde-3-phosphate; DHAP = dihydroxyacetone phosphate; 1,3 DPG = 1,3 – diphosphoglycerate; 3PG = 3-phosphoglycerate; PEP = phosphoenolpyruvate; AC-ALD = acetaldehyde
Complex growth media, such as LB medium
containing expensive laboratory nutrients (yeast extract
and tryptone), are not feasible for the industrial
production of ethanol. The development of inexpensive
industrial media that retains high ethanol productivity and
yield is essential for economical ethanol production from
biomass feedstocks. Substantial efforts have been
expended on formulating a minimal synthetic medium for
ethanol production using E. coli KO11 as the
ethanologen[7-10], and using glucose, xylose, or pretreated biomass as the substrate[11-15]. Gluconate salts are substantially different substrates from sugars. The
minimal medium formulated using sugars as the
substrates cannot be directly applied to sugar acids. In
this study, the ethanol production from sodium and
calcium gluconate using the reported synthetic minimal
media[16,17] was investigated and compared with glucose. The subsequent optimization of the components of
minimal media was studied by using response surface
methodology (RSM). LB medium was used as a
reference for comparing fermentation performance in
terms of ethanol yield and productivity.
2 Materials and methods
2.1 Microorganism, medium, and culturing conditions
The engineered strain E. coli KO11 (ATCC29191)
was purchased from American Type Culture Collection
(ATCC, Manassas, Virginia, USA) and stored in 25%
glycerol at negative 80℃. The strain was streaked on a
fresh LB agar (Fisher, Pittsburgh, PA, USA) plate
containing 0.034 g/L amphenicol chloride (Sigma, St.
Louis, MO, USA) and incubated at 37℃ overnight. All
chemicals used in the medium were purchased from
Sigma (St. Louis, MO, USA) if they were not specified
elsewhere.
Fermentations were carried out in the 250 mL serum
bottle with a 200 mL working volume and purged with
CO2 gas to deplete the air. LB medium and two
minimal media were used during the fermentation. Corn
steep liquor (CSL) medium contained the following salts
(per liter of distilled water): 10 g of CSL (~50% solids),
1 g of KH2PO4, 0.5 g of K2HPO4, 3.1 g of (NH4)2SO4,
0.4 g of MgCl2·6H2O, and 0.020 g of FeCl3·6H2O. All
the salt solutions for the medium were prepared as
described previously[17]. M9 medium contained the following ingredients (per liter of distilled water): 6 g of
Na2HPO4, 3 g of KH2PO4, 1 g of NH4Cl, and 0.5 g of
NaCl. Three trace components were sterilized by
filtration and then added into media at the following final
concentrations: 0.002 M of MgSO4·7H2O, 0.0001 M of
CaCl2, and 0.001 g/L of thiamine-HCl. 150 mL seed
cultures were grown in a 250 mL serum bottle at 37℃ at
220 r/min in LB medium containing 20 g/L glucose. To
initiate the fermentation, 0.003 L of the liquid culture
(OD600nm =1.6) were inoculated into 0.2 L of fermentation
medium. Samples were taken at various time intervals
to monitor concentrations of ethanol, acetate, glucose,
sodium and calcium gluconate.
2.2 Analytical method
The concentrations of glucose, sodium and calcium
gluconate, ethanol, and acetate were analyzed using
high-pressure liquid chromatography (Shimadzu, Japan)
equipped with a refraction index detector and an Aminex
HPX-87H column (Bio-Rad Laboratories, Hercules, CA,
USA) at 60℃. The mobile phase was 0.005 M H2SO4
(Sigma, St. Louis, MO, USA) at the flow rate of 0.036
L/hour.
2.3 Experimental design and data analysis
A rotatable central composite design (CCD) with five
factors and five levels (-2, –1, 0, 1, 2) was used to study
response patterns, and JMP 8 software (SAS Institute Inc,
NC, USA) was used to determine the optimal
combination of variables. In this study, the CCD was a
2V 5-1
fractional factorial design with ten center points, and
ten star points which are located at a distance of α = 2
from the center. The five independent variables were concentrations of CSL (designated variable X1, expressed
in g/L), (NH4)2SO4 (X2, g/L), KH2PO4/K2HPO4 (X3, g/L),
MgSO4·6H2O (X4, g/L), and FeCl3·6H2O (X5, g/L), while
ethanol concentration (Yi, g/L) was the dependent output
variable. The concentration of the substrate (calcium
gluconate) was kept at optimal 80 g/L determined from
the preliminary experiments. The range of variables is
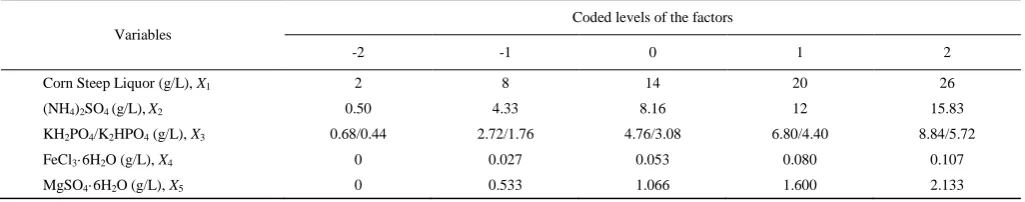
Table1 Factors and coded levels in a rotatable central composite design (CCD)
Variables
Coded levels of the factors
-2 -1 0 1 2
Corn Steep Liquor (g/L), X1 2 8 14 20 26
(NH4)2SO4 (g/L),X2 0.50 4.33 8.16 12 15.83
KH2PO4/K2HPO4 (g/L), X3 0.68/0.44 2.72/1.76 4.76/3.08 6.80/4.40 8.84/5.72
FeCl3·6H2O (g/L), X4 0 0.027 0.053 0.080 0.107
MgSO4·6H2O (g/L), X5 0 0.533 1.066 1.600 2.133
Table 2 The rotatable central composite design (CCD) matrix for five independent variables (X1~X5)
Runs X1 X2 X3 X4 X5 Experimental
ethanol/g·L-1
Predicted ethanol/g·L-1 1 1 1 1 1 -1 13.6 15.5 2 1 1 1 -1 1 11.9 14.3 3 1 1 -1 1 1 26.7 27.2 4 1 -1 1 1 1 18.3 20.2 5 1 1 -1 -1 -1 27.7 27.9 6 1 -1 1 -1 -1 9.3 10.8 7 1 -1 -1 1 -1 25.7 25.4 8 1 -1 -1 -1 1 26.8 27.0 9 -1 1 1 1 1 11.8 12.9 10 -1 -1 -1 -1 -1 24.9 23.5 11 -1 -1 1 1 -1 16.0 16.3 12 -1 1 1 -1 -1 17.0 17.8 13 -1 -1 1 -1 1 14.8 15.6 14 -1 -1 -1 1 1 25.6 24.5 15 -1 1 -1 -1 1 29.6 29.1 16 -1 1 -1 1 -1 29.5 28.5 17 2 0 0 0 0 19.3 16.1 18 0 2 0 0 0 26.9 25.2 19 0 0 2 0 0 11.9 7.4 20 0 0 0 2 0 29.6 28.8 21 0 0 0 0 2 26.0 24.3 22 -2 0 0 0 0 14.7 16.1 23 0 -2 0 0 0 22.7 22.7 24 0 0 -2 0 0 27.1 29.7 25 0 0 0 -2 0 28.8 27.7 26 0 0 0 0 -2 23.2 23.0 27 0 0 0 0 0 26.1 26.4 28 0 0 0 0 0 27.2 26.4 29 0 0 0 0 0 26.0 26.4 30 0 0 0 0 0 25.8 26.4 31 0 0 0 0 0 26.5 26.4 32 0 0 0 0 0 24.7 26.4 33 0 0 0 0 0 25.0 26.4 34 0 0 0 0 0 25.2 26.4 35 0 0 0 0 0 28.2 26.4 36 0 0 0 0 0 27.0 26.4 Optimal 0.0631 1.89 -1.56 -0.508 0.228 31.5 31.0
The relationships between the coded and the actual values were described according to Equation (1):
i i i i x x X x
(1)
where, Xi is the coded value of the independent variable i;
xiis the actual value of the independent variable i; xi is
the actual value on the center point of the independent variable i, and ∆xi is the step change value. The ranges
of coded levels in this experiment were determined
according to results of previous experiments and published data in the literatures[9,17,21,22]. Thirty-six experiments were carried out to optimize the medium
components for fuel ethanol fermentation (Table 2). The following quadratic model was developed to predict the optimal point:
2 0
i i i ij ij ii ii
Y b b X b X b X (2)
where, Yi is the predicted response; b0 is the offset term;
and bi, bii, and bij are linear effects, squared effects, and
interaction terms, respectively. The statistical
significance of the developed quadratic model was determined by an F-test; the proportion of variance obtained by the model was provided by the multiple
coefficients of determination, R2. The optimal values of the five factors were determined by response surface and predicted using the JMP 8 software, in which a sequential
forward selection procedure was applied to locate more desirable values of the response.
3 Results and discussion
3.1 Comparison of fermentation in LB, CSL, and
M9 media
In this study, sodium and calcium gluconate were applied as carbon sources in M9 and CSL media as well
as LB media for the conversion of gluconate to ethanol. The ethanol fermentation performances of gluconate salts
3.1.1 Bioconversion of sodium gluconate into ethanol
Both sodium gluconate and calcium gluconate were successfully converted to ethanol in the un-modified M9 and CSL media (Figure 2a-i). When the two minimal
media were used for both gluconate conversion, ethanol was produced at lower rates (0.097-0.140 g/(L·h) ethanol, required longer fermentation times) in minimal medium,
compared to them in the LB medium (0.26-0.27 g/(L·h), Figure 2k-l). When sodium gluconate was used as the carbon source, the highest ethanol yield achieved (76.4%
of the theoretical yield) was in LB medium, followed by CSL and M9 media, in which the ethanol yields were
75.3% and 68.3%, respectively. In aspect of ethanol productivity and sodium gluconate consumption (Figure 2k-l), the rate of ethanol production in LB medium was
0.27 g/(L·h), which was 2.0 and 2.1 times faster than that for M9 and CSL media, respectively. The sodium gluconate consumption rate consisted with the ethanol
yield and productivity. The highest up-taking rate of sodium gluconate was 1.66 g/(L·h) in LB medium, as shown in Figure 2k and Figure 2l, which was 2.2 and 3.3
times faster than that of M9 (0.65 g/(L·h)) and CSL (0.51 g/(L·h)) media, respectively. The strain produced similar yields of ethanol to sodium gluconate in LB and
CSL media (0.26 g ethanol/g sodium gluconate) while the yield was 9% lower than in the M9 medium, which was
0.24 g ethanol/g sodium gluconate. The differences in ethanol yields and production rates are likely due to LB medium, which provides the most easily accessible
nutrients and trace elements among three medium, followed by CSL and M9 medium. M9 medium contains more salts than LB and CSL media, resulting in
higher osmotic stress and ion strength that negatively affect cell growth and ethanol production during fermentation[21,22]. Additionally, the CSL and LB medium have better pH buffer capacity than that of M9 medium containing sodium gluconate, as shown in Figure 2j, which is another beneficial factor for ethanol
fermentation.
3.1.2 Bioconversion of calcium gluconate into ethanol
The ethanol yield from calcium gluconate in LB was 85% of theoretical yield, which is 10% higher than that of sodium gluconate (77%) achieved in LB medium, as
shown in Figure 2k. However, the strain only produced
slightly higher ethanol yields from calcium gluconate in CSL medium (76.5%), compared to 75.3% of theoretical ethanol yield from sodium gluconate in CSL medium.
The yield of ethanol from calcium gluconate (76.7%) achieved in M9 medium was 1.12 times higher than that for sodium gluconate (68.3%), possibly due to the
significant alleviation of osmotic pressure and ion strength resulting from a large amount of precipitation formed between calcium cation and phosphate group in
M9 medium. A small amount of precipitations, mostly CaCO3, were observed during ethanol fermentation in LB
and CSL medium using calcium gluconate as carbon source. It is probably the reason of ion strength alleviation that the strain produced higher ethanol yields
in LB and CSL medium containing calcium gluconate than sodium gluconate. The strain produced similar ethanol productivity in LB media for both sodium and
calcium gluconate, as shown in Figure 2l. However, the lower ethanol productivities were detected in both CSL and M9 medium containing calcium gluconate due to the
lower consumption rates of calcium gluconate than that of sodium gluconate in these two media. The yields of ethanol to calcium gluconate in all three media were
higher than that of sodium gluconate, which suggested the better fermentation performance of strain KO11 using
calcium gluconate than that of sodium gluconate. Moreover, the pH buffering abilities of LB and CSL medium containing sodium or calcium gluconate were
better than that of M9 medium during the fermentation process, which is beneficial for cell growth and ethanol production, shown in Figure 2j.
3.1.3 Comparison of fermentation ability of glucose with gluconate salts
The bioconversion of glucose to ethanol was
investigated in all three media as well as for the comparison of ethanol fermentation performance with sodium and calcium gluconate. The highest ethanol
yield achieved was 96.8% in the LB media, followed by CSL and M9 medium, in which the ethanol yields were
gluconate in the corresponding media, respectively, as
well as 27%, 25%, and 22% higher than that of sodium gluconate in LB, M9, and CSL media. The ethanol productivity of glucose in the LB medium was 0.48
g/(L·h) (Figure 2l), which is 66% and 82% higher than that of calcium and sodium gluconate in LB medium. However, the strain produced lower ethanol productivity
of glucose in M9 and CSL media than that of sodium gluconate in both medium, as well as that of calcium gluconate in CSL medium. The ethanol productivities
of gluconate salts in M9 and CSL media were consisted with substrate consumption rates. Both gluconate salts
were consumed faster than glucose in M9 and CSL media.
Particularly, the strain consumed the gluconate salts three
times faster than glucose in CSL medium. The higher ethanol productivities and substrate up-taking rates of gluconate salts suggested that they might be good
potentially alternative substrates for fuel ethanol production. In addition, as shown in Figure 2j, the pH values of culture media containing gluconate were
relatively constant during the fermentation while the pH values decreased in the media containing glucose as the culture continued. The high pH buffering ability of
gluconate salts in the media will render a great beneficiary in the pH value control during the ethanol
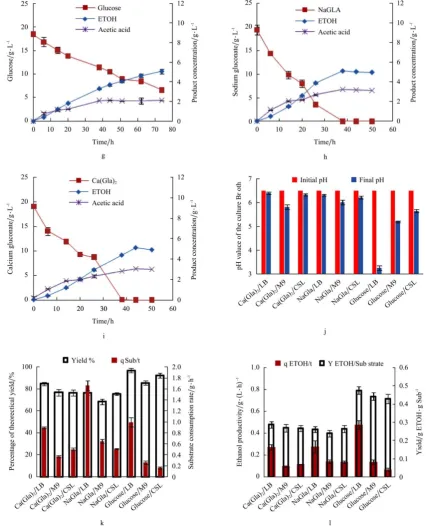
Figure 2 Comparison of glucose, sodium and calcium gluconate ethanolic fermentation in LB, CSL, and M9 medium. (a)-(c): glucose, sodium and calcium gluconate in LB medium, respectively; (d)-(f): glucose, sodium and calcium gluconate in M9 medium, respectively;
(g)-(i): glucose, sodium and calcium gluconate in CSL medium, respectively; j: the starting and final pH value of the culture broth; k: percentage of ethanol theoretical yields from different media and the substrate consumption rate (g substrate/hour); l: the ethanol productivity
and yield. (YETOH/Substrate is the yield of ethanol produced to substrate consumed (g/g): percentage of theoretical yield is the ethanol yield vs.
the theoretical yield; qETOH/t is ethanol productivity (g/(L·h)); qSub/t is substrate consumption rate (g/(L·h)); ETOH stands for ethanol; NaGla
stands for sodium gluconate; Ca(Gla)2 stands for calcium gluconate). Product concentration of Y axis label in Figure 2 stands for the
concentration of ethanol and acetic acid.
3.2 Response surface analysis of medium constituents
Considering the higher ethanol yield and productivity,
better pH buffering capacity of the substrate in the
medium and the simplicity and cheapness of medium, the calcium gluconate and CSL medium were chosen for
Experimental results were analyzed by JMP 8 software
using multiple regression analysis. The corresponding quadratic regression model was constructed as shown in Equation (3).
1 2 3 4
5 1 2 1 3 1 4
1 5 2 3 2 4 2 5
2
3 4 3 5 4 5 1
2 2 2 2
2 3 4 5
= 26.376 0.0003 0.623 5.599 0.281
0.314 0.43 0.277 0.749
0.811 0.918 0.902 1.091
0.511 0.003 0.419 2.577
0.612 1.957 0.476 0.68
y X X X X
X X X X X X X
X X X X X X X X
X X X X X X X
X X X X
(3) The actual concentrations of ethanol produced in the experiments and the predicted values based on the
quadratic regression model are presented in Table 2. Regression analysis of the data yielded a coefficient of determination (R2) of 0.937; this means that 93.7% of the variability in ethanol production could be explained by the proposed quadratic model, suggesting a satisfactory fitness of the model. The adjusted R2 value was 0.852, which also implied satisfactory fitness. The difference between the predicted and experimentally produced
ethanol concentrations verified both positive and negative dispersion of the observed values.
Table 3 ANOVA of full quadratic model
Source Degree of freedom (DF) Sum of squares (SS)
Mean square
(MS) F-value p-value Regression 20 1210.8 60.5 11.11
Error 15 81.8 5.45 <0.0001 Total error 35 1292.6
An analysis of variance (ANOVA, Table 3) for the response surface quadratic model showed that the fitted
second-order regression model is highly significant, with a Fisher’s test (F-test) value of 11.11 (P<0.0001). The student test (T-test) was used to determine the significance of the regression coefficients of the variables, in which a smaller p-value indicates a higher level of
significance. If a variable had a p-value below 0.05, the test parameter is significant at the 95% level of confidence.
As shown in Table 4, concentration of phosphate buffer (X3) had the most significant effects on ethanol
production, with p <0.0001, suggesting a strongly linear effect on the response. By contrast, the other four factors, concentrations of CSL (X1), ammonia sulfate (X2),
ferric chloride (X4), and magnesium sulfate (X5), had
negligible linear effects on the response (P>0.1). Based on regression coefficients, F-values, and p-values, the phosphate buffer (X3), the quadratic term of curvature
CSL (X1 2
), and the quadratic term of the curvature phosphate buffer (X3
2
) had the most significant effects on ethanol production. The two-factor interaction between
ammonia sulfate and magnesium sulfate (X2X4) had
medium significance on ethanol yield since its p-value (0.0812) is above 0.05 but below 0.1.
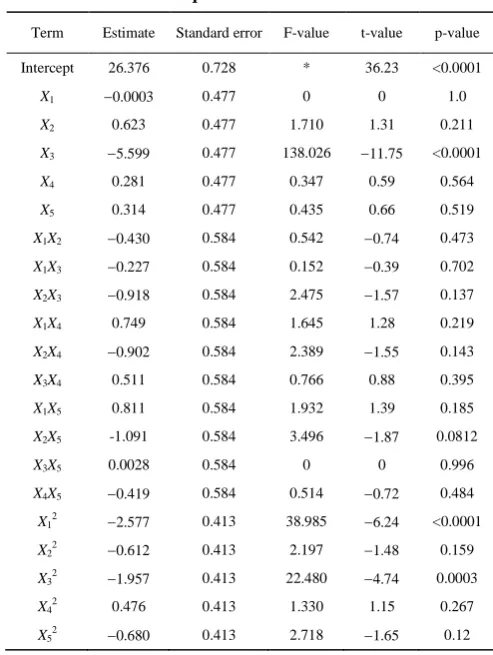
Table 4 Regression coefficients and their significance for quadratic model
Term Estimate Standard error F-value t-value p-value Intercept 26.376 0.728 * 36.23 <0.0001
X1 0.0003 0.477 0 0 1.0 X2 0.623 0.477 1.710 1.31 0.211 X3 5.599 0.477 138.026 11.75 <0.0001 X4 0.281 0.477 0.347 0.59 0.564 X5 0.314 0.477 0.435 0.66 0.519 X1X2 0.430 0.584 0.542 0.74 0.473 X1X3 0.227 0.584 0.152 0.39 0.702 X2X3 0.918 0.584 2.475 1.57 0.137 X1X4 0.749 0.584 1.645 1.28 0.219 X2X4 0.902 0.584 2.389 1.55 0.143 X3X4 0.511 0.584 0.766 0.88 0.395 X1X5 0.811 0.584 1.932 1.39 0.185 X2X5 -1.091 0.584 3.496 1.87 0.0812 X3X5 0.0028 0.584 0 0 0.996 X4X5 0.419 0.584 0.514 0.72 0.484 X12 2.577 0.413 38.985 6.24 <0.0001 X22 0.612 0.413 2.197 1.48 0.159 X32 1.957 0.413 22.480 4.74 0.0003 X42 0.476 0.413 1.330 1.15 0.267 X52 0.680 0.413 2.718 1.65 0.12
Note: R2 = 0.937, adjusted R2 = 0.852.
Since some factors, the two-factor interactions, and quadratic terms of curvature were found to be
non-significant, the full quadratic model (Equation (3)) was simplified to Equation (4), which only includes significant linear terms and high order terms.
2 2
3 2 5 1 3
= 26.376 5.599 1.091 2.577 1.957
y X X X X X
(4)
by the simplified model, suggesting a satisfactory fitness
of the model. The adjusted R2 value was 0.832, which implied satisfactory fitness as well. An analysis of variance (ANOVA, Table 5) for the response surface
simplified quadratic model showed highly significance of the simplified model as well, with a Fisher’s test (F-test) value of 35.66 (P<0.0001).
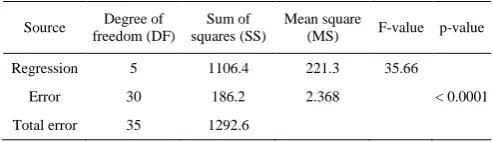
Table 5 ANOVA of the simplified quadratic model
Source Degree of freedom (DF)
Sum of squares (SS)
Mean square
(MS) F-value p-value Regression 5 1106.4 221.3 35.66
Error 30 186.2 2.368 < 0.0001 Total error 35 1292.6
Note: R2 = 0.856, adjusted R2 = 0.832.
3.3 Interactions between significant factor
(KH2PO4/K2HPO4 (g/L), x3) and other factors
Since X3 is the only significant factor, the interactions
between factor X3 and other factors were investigated in
this study. The three-dimensional response surface graphs and contour plots based on the final model are
depicted in Figure 3a-d. They were obtained by holding the other three variables at zero (coded value) while varying the two variables of interest within their
experimental range. The coded model was used to generate response surfaces and contour curves for the analysis of the variables’ effects on ethanol production. The statistically optimal values of variables were obtained when moving along the major and minor axes of
the contour. The response at the central point corresponded to the maximal degree of achievable ethanol concentration for that set of variables.
Figure 3a shows the response surface plot and the contour plot as a function of the concentrations of the
phosphate buffer and CSL and indicates the effects of their interaction on ethanol production. As shown in Figure 3a, the ethanol yield increased as the concentration of the phosphate buffer (KH2PO4/K2HPO4 (2:1))
decreased from 8.84/5.72 g/L (coded level 2) to 1.578/1.261 g/L (coded level 1.56). Ethanol yield then
reached its highest value at about 30 g/L and decreased with the reduction of the phosphate buffer in the medium. It is likely due to the higher osmotic pressure associated
with higher concentration of potassium cation, which will
inhibit cell growth at higher concentration. While the
relatively low concentration of phosphate buffer could also inhibit cell growth due to short of phosphate as a trace nutrient[23]. The concentration of CSL affected the ethanol yield in a similar way except that the optimal ethanol yield was reached when the CSL concentration was 14.4 g/L (coded level 0.063). The real mechanism of
CSL affecting ethanol production has not been elucidated well.
Effects of the concentrations of (NH4)2SO4 and
phosphate buffer on ethanol production are shown in
Figure 3b. Ethanol yields increased with increased ammonia sulfate concentration since it functioned as a
nitrogen source (Figure 3b). Meanwhile, the anion sulfate group precipitated calcium cation out from the medium, which benefited the cell growth and ethanol
production. The effect of phosphate buffer on ethanol
production varies in the same way as it did in the CSL
and phosphate buffer interaction. When the
concentration of (NH4)2SO4 reached 15.4 g/L (coded level
1.89), the highest ethanol production achieved was about
30 g/L as well. Figure 3c and Figure 3d illustrate the response surface and contour plot as a function of ferric
sulfate and magnesium sulfate concentrations. Both ferric chloride and magnesium sulfate had very similar
effects on ethanol yield. The optimal concentrations of ferric chloride and magnesium sulfate for ethanol
production were 0.0397 g/L and 1.19 g/L, respectively. As shown in Figure 3a-d, the concentration of phosphate
buffer has a significantly negative correlation with ethanol production, while ammonia sulfate has a positive
correlation with ethanol yield.
3.4 Evaluation of the optimum concentrations of
media components
According to the main observations of the interactions,
maximum ethanol production would be obtained by keeping the following medium composition, CSL:
14.38 g/L; (NH4)2SO4: 15.41 g/L; KH2PO4/K2HPO4 (2:1,
molar ratio): 1.58/1.26 g/L; FeCl3·6H2O: 0.0398 g/L; and
MgSO4·6H2O: 1.19 g/L. The predicted ethanol
concentration was experimentally verified by fermenting
Figure 3 Response surface and contour plot of ethanol production by strain KO11. (a): phosphate buffer vs. corn steep liquor (CSL) with the constant level of: (NH4)2SO4 8.16 g/L, FeCl3·6H2O 0.0267 g/L, MgSO4·6H2O 0.533 g/L; (b): phosphate buffer vs. (NH4)2SO4 with the
constant level of: CSL 14 g/L, FeCl3·6H2O 0.0267 g/L, MgSO4·6H2O 0.533 g/L; (c): phosphate buffer vs. FeCl3·6H2O with the constant
level of: CSL 14 g/L, (NH4)2SO4 8.16 g/L, MgSO4·6H2O 0.533 g/L; phosphate buffer vs. MgSO4·6H2O with the constant level of: CSL 14
g/L, (NH4)2SO4 8.16 g/L, FeCl3·6H2O 0.0267 g/L.
cultured in the rich medium LB was also set up for
comparison of ethanol yield. The engineered strain
KO11 produced 31.5 g/L of ethanol in the optimized CSL
minimal medium, which was 95.8% of the predicted
ethanol concentration. It is about 21.5% higher than that
of ethanol from KO11 cultured in LB medium (25.9 g/L)
under the same operation conditions and the concentration
of calcium gluconate (80 g/L). Moreover, the cost of
optimized synthetic medium is US $2.383 per litre, which
is $0.29 per litre less than the cost of rich medium LB, as
shown in Table 6, according to prices provided by Sigma.
The cost of optimized CSL medium reduced 12.2% than
that of LB medium.
Table 6 Cost of the media
Optimized CSL medium Component Concentration
/g·L-1
Cata. No. (Sigma)
Price /$
Size /kg
Cost /dollar·L-1
CSL 14.38 C4648 100 2.5 0.58 (NH4)2SO4 15.41 A4418 82.9 1 1.28
KH2PO4 1.58 P9791 125.5 1 0.20
K2HPO4 1.26 P9666 157.5 1 0.20
FeCl3 0.0398 157740 40.7 1 0.00
MgSO4 1.19 M7506 111 1 0.13
Total cost 2.38 Rich medium: LB
Component Concentration /g·L-1
Cata. No. (Sigma)
Price /$
Size /kg
Cost /dollar·L-1 Yeast extract 5 92114 75.4 0.5 0.75
4 Conclusions
The research showed that the strain KO11 produced lower ethanol yields and productivity in both unmodified
minimal M9 and CSL media than that of rich medium LB. A more than 10% higher ethanol yields were detected when calcium gluconate was used as a carbon source in LB
and M9 media than that of sodium gluconate in the media. The strain produced similar ethanol yield when both sodium and calcium gluconate were used as carbon source
in the un-optimized CSL medium. The higher substrate up-taking rates of the strain were detected in the M9 and CSL medium containing sodium and calcium gluconate
than that containing glucose. Additionally, the media containing sodium and calcium gluconate yielded better
pH buffering capacity than that of glucose in all three media.
Response surface methodology was used for
optimizing the CSL medium components for ethanol production by E. coli KO11 using calcium gluconate as the substrate. A maximum ethanol titer of 31.5 g/L was
achieved under the predicted optimum component levels. The concentration of ethanol was increased by 21.5% as compared to ethanol titer produced in the unformulated
CSL medium with same starting concentration of sodium gluconate under the same culture conditions. The ethanol concentration produced in the validation experiment
(31.5 g/L) was similar to the predicted ethanol concentration (30.0 g/L) by the simplified quadratic model.
Furthermore, the ethanol concentration achieved in the optimized synthetic medium is even 5.57 g/L higher than that from rich LB medium containing the same level of
calcium gluconate as the substrate.
Acknowledgements
The work was supported by California Energy
Commission grant (55779A/08-03). Special thanks to Dr. Chaowei Yu and Dr. Yi Zheng, who gave valuable suggestions and helps with experimental data analysis and
draft editing.
[References]
[1] Wyman C E. What is (and is not) vital to advancing
cellulosic ethanol. Trends in Biotechnology, 2007; 25(4): 153-157.
[2] Lynd L R, Cushman J H, Nichols R J, Wyman C E. Fuel ethanol from cellulosic biomass. Science, 1991; 251(4999): 1318-1323.
[3] Lynd L R, van Zyl W H, McBride J E, Laser M. Consolidated bioprocessing of cellulosic biomass: An update. Current Opinion in Biotechnology, 2005; 16(5): 577-583. [4] Lynd L R, Wyman C E, Gerngross T U. Biocommodity
engineering. Biotechnology Progress, 1999; 15(5): 777-793.
[5] Fan Z, Wu W, Hildebrand A, Kasuga T, Zhang R, Xiong X. A novel biochemical route for fuels and chemicals production from cellulosic biomass. PLOS One, 2012; 7(2): e31693. [6] Ohta K, Beall D S, Mejia J P, Shanmugam K T, Ingram L O.
Genetic improvement of Escherichia coli for ethanol production: chromosomal integration of Zymomonas mobilis genes encoding pyruvate decarboxylase and alcohol dehydrogenase II. Applied Environmental Microbiology, 1991; 57(4): 893-900.
[7] Underwood S A, Buszko M L, Shanmugam K T, Ingram L O. Flux through citrate synthase limits the growth of ethanologenic Escherichia coli KO11 during xylose fermentation. Applied Environmental Microbiology, 2002; 68(3): 1071-1081.
[8] Okuda N, Ninomiya K, Katakura Y, Shioya S. Strategies for reducing supplemental medium cost in bioethanol production from waste house wood hydrolysate by ethanologenic Escherichia coli: Inoculum size increase and coculture with Saccharomyces cerevisiae. Journal of Bioscience and Bioengineering, 2008; 105(2): 90-96. [9] York S W, Ingram L O. Soy-based medium for ethanol
production by Escherichia coli KO11. Journal of Industrial Microbiology, 1996; 16(6): 374-376.
[10] York S W, Ingram L O. Ethanol production by recombinant Escherichia coli KO11 using crude yeast autolysate as a nutrient supplement. Biotechnology Letters, 1996; 18(6): 683-688.
[11] de Carvalho Lima K G, Takahashi C M, Alterthum F. Ethanol production from corn cob hydrolysates by Escherichia coli KO11. Journal of Industrial Microbiology and Biotechnology, 2002; 29(3): 124-128.
[12] Kim N J, Li H, Jung K, Chang H N, Lee P C. Ethanol production from marine algal hydrolysates using Escherichia coli KO11. Bioresource Technology, 2001; 102(16): 7466-7469.
[14] Grohmann K, Cameron R G, Buslig B S. Fermentation of sugars in orange peel hydrolysates to ethanol by recombinant Escherichia coli KO11. Applied Biochemisty and Biotechnology, 1995; 51(2): 423-435.
[15] Takahashi C M, de Carvalho Lima K G, Takahashi D F, Alterthum F. Fermentation of sugar cane bagasse hemicellulosic hydrolysate and sugar mixtures to ethanol by recombinant Escherichia coli KO11. World Journal of Microbiology and Biotechnology, 2000; 16(8): 829-834. [16] Orencio-Trejo M, Flores N, Escalante A, Hernandez-Chavez
G, Bolivar F, Gosset G, et al. Metabolic regulation analysis of an ethanologenic Escherichia coli strain based on RT-PCR and enzymatic activities. Biotechnology for Biofuels, 2008; 1(1): 1-8.
[17] Martinez A, York S W, Yomano L P, Pineda V L, Davis F C, Shelton J C, et al. Biosynthetic burden and plasmid burden limit expression of chromosomally integrated heterologous genes (pdc, adhB) in Escherichia coli. Biotechnology Progress, 1999; 15(5): 891-897.
[18] Eisenberg R C, Dobrogos W J. Gluconate metabolism in Escherichia coli. Journal of Bacteriology, 1967; 93(3):
941-947.
[19] Kornberg H L, Soutar A K. Utilization of gluconate by Escherichia coli - Induction of gluconate kinase and 6-phosphogluconate dehydratase activities. Biochemical Journal, 1972; 134(2): 489-498.
[20] Bachi B, Kornberg H L. Utilization of gluconate by Escherichia coli-Role of adenosine 3'-5'-cyclic monophosphate in induction of gluconate catabolism. Biochemical Journal, 1975; 150(1): 123-128.
[21] Underwood S A, Shanmugum K T, Ingram L O. Osmoprotectants stimulate growth and ethanol production by ethanologenic Escherichia coli. Abstracts of the General Meeting of the American Society for Microbiology, 2003; 103: 0-060.
[22] Martinez A, Grabar T B, Shanmugam K T, Yomano L P, York S W, Ingram L O. Low salt medium for lactate and ethanol production by recombinant Escherichia coli B. Biotechnology Letters, 2007, 29(3): 397-404.
![Figure 1 Central anaerobic metabolic pathway of glucose and gluconate in E. coli KO11[18-20]](https://thumb-us.123doks.com/thumbv2/123dok_us/610398.2060901/2.595.94.504.106.691/figure-central-anaerobic-metabolic-pathway-glucose-gluconate-coli.webp)