Modeling the equilibrium moisture content of desorption and
adsorption of yam (
Dente
)
E. A. Amankwah
1,2, K. A. Dsizi
2, G. van Straten
1, A. J. B. van Boxtel
1* (1. Biobased Chemistry and Technology, Wageningen University Research. PO Box 17, 6700 AA, Wageningen, the Netherlands;2. Food Science and Technology and Biochemistry and Biotechnology Department, Kwame Nkrumah University of Science and Technology, Kumasi, Ghana)
Abstract: The experimental equilibrium moisture content of yam (Dioscorea rotundata; cultivar: Dente) at temperatures of 25°C and 50°C were determined at relative humidity from 0% to 95% employing the dynamic vapor sorption analyzer. Wet yam samples with about 68% initial moisture content were used, first for desorption and subsequently for sorption. Water activity decreased with increased temperature at constant equilibrium moisture content. The desorption and adsorption isotherms were fitted by the Guggenheim-Anderson-de Boer (GAB), Henderson, Halsey, Oswin, Smith, Brunauer-Emmett- Teller (BET) and Peleg models. On the basis of the fit the Peleg, GAB and Oswin models were most suitable for describing the observed data. When the focus is on drying, the GAB (3 parameters) and empirical Peleg model (4 parameters) performed best. Of these, GAB is preferable because it has fewer parameters, which, moreover, have a physical meaning.
Keywords: sorption isotherm, yam, equilibrium moisture content, GAB
Citation: Amankwah, E. A., K. A. Dsizi, G. van Straten, and A. J. B. van Boxtel. 2018. Modeling the equilibrium moisture content of desorption and adsorption of yam (Dente). Agricultural Engineering International: CIGR Journal, 20(1): 184–192.
1 Introduction
Yam is an important food crop for many people in the yam zone of West Africa. It forms about 10% of the total roots and tubers produced in the world. It has been estimated that the world yam production would increase by 27% between the years 2003-2020. In past decades, yam production in Ghana increased by 10% per year (Kenyon et al., 2006). It is second to cassava as the most important tropical root crop but is nutritionally better than cassava on account of their vitamin C (40-120 mg g-1
edible portion) and crude protein (40-140 g kg-1 dry matter) content (Opara, 2003). Yam has a moisture content of about 70% when harvested (Fioreze and Morini, 2000), making it highly perishable. Therefore it is essential to develop effective methods that prolong the shelf life of yam without compromising on its nutritional and healthy components. With this purpose in mind, it is
Received date: 2017-06-02 Accepted date: 2017-08-31 * Corresponding author: A. J. B. van Boxtel, Wageningen University and Research, P .O. Box 17,6700 AA, Wageningen, the Netherlands. Tel: +31 317 484955, Email: [email protected].
imperative to obtain more information on some properties of yam that can help to reduce post-harvest losses.
Myhara et al., 1998a, b). However, not much attention has been given to yam. A recent work on the desorption isotherms of two varieties of D. rotundata was studied by Montes et al. (2009). It was shown that, according the general accepted view, the equilibrium moisture content (EMC) increases with water activity of the air (aw) and
decreases with temperature. A similar result was found by Igathinathane et al. (2005). There is also some recent work on water yam flour, which, however, is a derived product (Owo et al., 2017). Emperical and semi-emperical equations have been proposed to fit the EMC to relative humidity (RH) of food samples. Models that have been used to describe the sorption isotherms of foods include: Guggenheim-Anderson-de Boer (GAB), Henderson, Halsey, Oswin, Smith, Brunauer-Emmett- Teller (BET), Peleg. These models do not all apply over the full moisture content range. The GAB equation has been applied successfully to various foods up to 0.9 water activity (Maroulis et al., 1988; Samaniego-Esquerra et al., 1991; Andrade et al., 2011) but is not suitable beyond 0.93 water activity (Andrade et al., 2011). That of Halsey is effective between 0.1-0.8 (Rizvi, 1995). While others have reported a decrease in EMC for increased temperature at the same water activity, Montes et al. (2009) showed no temperature effect on the desorption isotherms of yam (Dioscorea rotundata) at temperatures 45°C and 55°C. Moreover, some works were restricted to desorption or adsorption alone as reported in the work of Andrade et al. (2011), Montes et al. (2009) and Saad et al. (2014). The reported investigations also differ in the method of assessing the parameters, whereas limited attention has been given to the uncertainty in the parameters (a noteworthy exception is e.g. Quirijns (2005)). In addition, there is generally no methodological attention to the choice of the most appropriate model. The object of this research is to obtain experimental equilibrium moisture isotherms for yam at 25°C and 50°C, both for sorption and desorption, to estimate the parameters and their uncertainty range for each of the models (GAB, Henderson, Halsey, Oswin, Smith, BET and Peleg), and then to use objective criteria to select the model that best describes the experimental desorption and adsorption isotherms over the relevant range of moisture contents.
2 Materials and methods
2.1 Source and preparation of material
The yam tubers of the variety, D. rotundata and cultivar (Dente) were purchased from a commercial farmer at Ejura, in the Sekyere Odumasi district of the Ashanti region of Ghana. The yam tubers were send to Wageningen, the Netherlands for the sorption measurements. For each experiment, a tuber of the yam was washed and cut into two halves. An amount of 13.36 and 31.39 mg of fresh samples at initial moisture contents 69.87% and 65.25% w.b. for 25°C and 50°C constant temperature experiments, respectively, was scooped from the middle part of one surface of the cut yam. The sample was carefully placed in the sample pan.
2.2 Procedure and measuring equipment
The experimental technique of the dynamic method was used to determine the desorption isotherms of the fresh yam. The dynamic vapor sorption (DVS) analyzer (Surface Measurement System DVS Advantage (ET), UK) was used for the measurement. The DVS analyzer uses a microbalance to measure the weight changes of samples. Two air mass flow controllers (wet and dry) mix air in such a way that the RH of the air flow is set and controlled in the range of 95% to 0% (desorption) with an optical vapor concentration RH detector. At equilibrium between sample and air RH/100 corresponds to the water activity aw. RH and temperature in the DVS are computer
controlled and followed by a chosen procedure. The RH starts at 95% and goes down by steps of 10% to 15% and then to 0% RH. At each step the sample mass was measured every minute and equilibrium was reached when the standard deviation between three successive measurements was less than 3×10⁻⁴ g (i.e. in terms of EMC 1.5×10⁻⁵ g water g-1 dry weight). The adsorption behavior was measured by the reverse procedure by stepping up from 0% through 15% to 95% RH. This process was repeated for temperatures 25°C and 50°C.
2.3 Observed curves
The observed data were determined for D. rotundata
the sample at intervals of 1 minute. Based on the mass of the sample as function of the RH, the EMC was calculated in dry basis (kg water kg-1 dry weight). The equilibrium moisture content was then plotted against the water activity (RH/100) of the air, to obtain equilibrium moisture curves.
2.4 Models
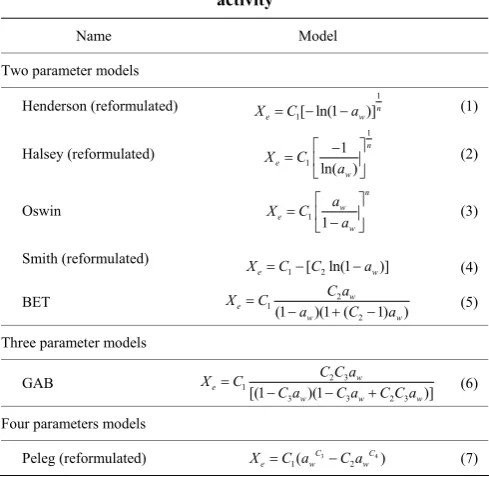
The most common equations for describing sorption isotherms of food products are the BET model, Oswin model, Smith model, Halsey model, Henderson model, GAB model, and Peleg model (Sahin and Sumnu, 2006). In order to make sure that parameters are dimensionally consistent across models, the models of Halsey, Henderson, Smith and Peleg were reformulated, such that the parameter C1 in all models has the same units as Xe,
and all other parameters are dimensionless (Table 1).
Table 1 Sorption model equations as a function of water activity
Name Model
Two parameter models
Henderson (reformulated) 1
1[ ln(1 )]n
e w
X =C − −a (1)
Halsey (reformulated) 1 1 1 ln( ) n e w X C a ⎡ − ⎤ = ⎢ ⎥ ⎣ ⎦ (2)
Oswin 1
1 n w e w a X C a ⎡ ⎤ = ⎢ ⎥ −
⎣ ⎦ (3)
Smith (reformulated)
1 [ 2ln(1 )]
e w
X =C− C −a (4)
BET 2
1
2 (1 )(1 ( 1) )
w e
w w
C a
X C
a C a
=
− + − (5)
Three parameter models
GAB 2 3
1
3 3 2 3
[(1 )(1 )]
w e
w w w
C C a
X C
C a C a C C a
=
− − + (6)
Four parameters models
Peleg (reformulated) 3 4
1( 2 )
C C
e w w
X =C a −C a (7)
Note: Xe is the equilibrium moisture content (EMC), aw is the water activity, C1,
C2, C3 and n are constants to be fitted for each equation.
The Henderson model is often used in describing food sorption isotherms. It was originally formulated as
1/
# 1
ln(1 aw) n
C
⎡− − ⎤
⎢ ⎥
⎣ ⎦ . The form in the table arises by
redefining 1 1 # 1 1 n C C ⎡ ⎤ = ⎢ ⎥
⎣ ⎦ , which has the same units as Xe,
and avoids a parameter with fractional units. The Halsey model is suitable for describing the sorption behavior of starchy foods. It expresses the condensation of
multilayers at large distance from the surface of the drying product with the assumption that energy potential of a molecule varies as the inverse of the nth power of the distance from the surface. It describes well the sorption isotherm of types I, II and III (Levine and Slade, 1991). The form in the table arises from the original form
1/ # 1 ln n e w C X a ⎡− ⎤ = ⎢ ⎥
⎣ ⎦ , by redefining
1 # 1 [ 1]n
C = C . The Oswin
equation is an empirical model that satisfies sigmoidal shaped curves (Labuza et al., 1972). The Smith model, originally formulated as Xe=C1+C#2ln(1 –aw) is an
empirical model that describes the final curved portion of water sorption isotherm of high molecular weight biopolymers. The model is based on two fractions of water that are adsorbed onto a dry surface. The first fraction represents the quantity of water in the first sorbed fraction, while the second specifies the quantity of water in the multilayer moisture fraction. In the reformulated equation in Table 1, C2 is a dimensionless parameter
defined by C#2/C1 . The model is suitable for various foods
products of water activity within the range 0.5 to 0.95 water activity (Andrade et al., 2011). The BET model is rather qualitative, and it is linear within a limited range of water activity from 0.05 to 0.45 (Andrade et al., 2011). This limits its use to a large extent since most sorption isotherm cases of foods have wider range of water activity. The first constant is the monolayer moisture content (the moisture content at which the water attached to each polar and ionic groups starts to behave as a liquid-like phase). The second constant relates to the net heat of sorption (difference between the molecules that sorb energy of the first layer and the other remaining layers). The GAB model has successfully been applied to many foods and has been recommended by the European Project COST 90 (Oliveira et al., 2006) on physical properties of foods. It has a theoretical basis since it is an improvement of the BET model by the addition of a third parameter, so that the heat of sorption parameter is split over the first layer heat of sorption constant and the multilayer heat of sorption constant (Andrade et al., 2011; Myhara et al., 1998a). Note that the BET model is a special case of the GAB model when C3=1. It has been
corn flour at 22°C (Gálvez et al., 2006), dried tomato pulp at 30°C (Goula et al., 2008) and Walnut kernels at 25°C (Toğrul and Arslan, 2007) while the opposite was reported by Montes et al. (2009) for the desorption of yam at 70°C rendering the improvement of the BET to GAB irrelevant. Peleg is a four-parameter model, originally given by 3 # 4
1 2
C C
e w w
X =C a −C a , which is a purely empirical equation without a theoretical background. Andrade et al. (2011) mentioned that generally C3<1 while C4>1, but Montes et al. (2009)
suggest the opposite which makes these parameter values inconsistent. Note that the two-parameter models deteriorate at aw=1, as limaw→1Xe = ∞. Hence, there is
an upper limit for aw beyond which these models must
lose their validity. It is expected in all models that
0
limaw→ Xe =0.
2.5 Statistical analysis of data
The nonlinear regression method in Matlab was used for the parameter estimation of the models, by minimizing the sum of squared differences between experimental and model results of desorption and adsorption. The goodness of fit was determined with three statistical tools, that is:
the standard error (SE)
2
1( )
e N i e p Residuals SE N N = = −
∑
(8)the percent average relative deviation (PRD)
1
100 | | (%) e N i e e Residuals PRD
N = EMC
⎛ ⎞
= ⎜ ⎟
⎝ ⎠
∑
(9) and the coefficient of performance (R2)2 2 1 2 1 ( ) 1 ( ) e e N i N e m i Residuals R EMC EMC = = = − −
∑
∑
(10)where, EMCm is the modeled value of equilibrium
moisture content; EMCe is the experimental equilibrium
moisture content value; Np is the number of parameters of
a particular model; Ne is the number of experimental data
points; EMCeis the arithmetic mean of the experimental
equilibrium moisture contents, and the residuals are defined by EMCe–EMCm. All data were processed and
evaluated using the Matlab software.
In general, more parameters lead to a better fit, but the
predictive power may be worse, unless the improvement is worthwhile. Akaike’s Information Criterion (AIC) is especially suitable for comparing models with a different number of parameters (Ljung, 1987). The criterion is reformulated here as:
ˆ 2 p eln( ( ))
AIC= N +N V p (11) The model with the lowest AIC is preferred. Here ˆ
( )
V p is the sum of squared errors for the estimated parameter vector ˆp i.e. V( )pˆ =
2 1( ( , )ˆ ( )) N
m e
k= MC k −MC k
∑
p . Since the number of data points is small, it is better to use the small sample corrected variant (Hu, 2007), which is:2 ( 1) 1 p p c e p N N AIC AIC N N + = +
− − (12)
2.6 Approximate confidence bound
The least squares method with the water activity aw
independent variable does not suffer from the so-called errors-in-variables problem which would occur if both the dependent and independent variable would have errors. Hence, the uncertainty of the parameter estimates can be evaluated by calculating the 2σ confidence interval based on the Jacobian matrix. The Jacobian matrix specifies the sensitivity of each point to each of the parameters. The relationships in Table 1 are linear in the parameter C1,
meaning that the 2σ bound corresponds to the 95% confidence interval, i.e. there is 5% chance that the true value is outside this range. For the other parameters, the 95% bound is only approximate. For convenience, in the tables below, the uncertainty is reported as the 1σ
coefficient of variation, i.e. as 100σρ-1, where p is the parameter estimate.
3 Results and discussion
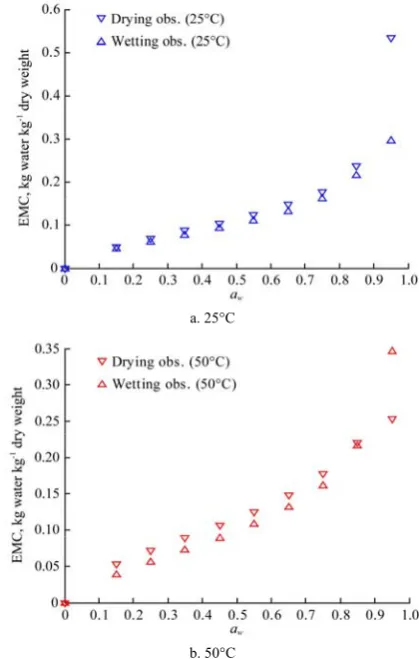
3.1 Desorption and adsorption isotherms measurements
The experimental values of water activity (aw) and its
about 0.9 aw due to high mobility of solute and dissolved
sugars at higher water activity during wetting. EMC for adsorption and desorption decreased with increased temperature between water activities of 0-0.83 (Figure 2). At higher water activity a reversal is obtained where water activity levels are lower at a constant EMC, as temperatures increase. This leads to desorption isotherms crossing at aw=0.65 and aw=0.83 for adsorption (Figure 2),
collaborating with the work of Myhara et al. (1998a), Siripatrawan and Jantawat (2006), and Montes et al. (2009). The point of crossing depends on the amount of sugar content of the food material. Myhara et al. (1998a) reported adsorption curves of two varieties of dates crossing between aw=0.4–0.5 and attributing it to high
sugar content. Tsami et al. (1990) and Myhara et al. (1998a) have reported that the higher the sugar content the lower the aw of crossing. Temperature on the other
hand did not show any significant effect on EMC at constant aw for the desorption isotherms (Myhara et al.,
1998b). This might be due to higher proportion of strongly bonded linear chain amylose molecules which are crystalline in nature. The curves show sigmoidal shape of type II and it can be observed that EMC increases with aw at constant temperature. This trend is in
line with the work of Andrade et al. (2011) and the findings of Montes et al. (2009)who had sigmoidal type II-curves. Others such as Siripatrawan and Jatawat (2006) reported similar trend. Hysteresis is observed for both temperatures where generally the EMC of desorption are higher than that of the adsorption at constant water activity.
One reason for differences in EMC between the desorption and adsorption at constant temperature and water activity is that, during desorption, solutes may supersaturate below their crystallization water activity and therefore can hold more water, especially for products with high sugar content (Aguilera and Stanley, 1999). The other common explanation is that when dried biological material is subjected to a wetting environment, the moisture first adheres to the surface of the cells, primarily in a unimolecular layer. After a high amount of molecules adhered to the surface, the diffusional forces exceed the binding forces and allow moisture to move inside the cell. When, subsequently, the vapor pressure of the environment of the cell surface is reduced again,
absorbed moisture from the cell moves out of the cells due to diffusional forces caused by concentration gradient leading to the hysteresis (Young and Nelson, 1967).
a. 25°C
b. 50°C
Figure 1 Experimental data of equilibrium moisture content (EMC) against water activity (aw) at 25°C and 50°C for water
desorption and adsorption
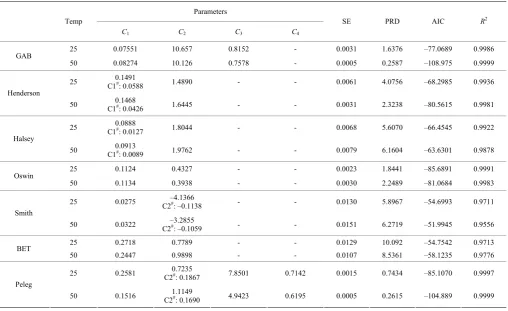
3.2 Modeling the isotherms
In fitting the models the data point at water activity 0.95 was ignored since according to the literature beyond
aw 0.9, most models are not able to explain well the
experimental data (Samaniego-Esguerra et al., 1991). One reason could be that, according to the differences between wetting and drying behavior at high water activity, it is hard to obtain a reliable measurement point since reaching the equilibrium may require a long equilibration time. Tables 2 and 3 show the outcome of the nonlinear regression analysis of desorption and adsorption isotherms respectively, of yam (Dente) for 0≤aw≤0.85 at
GAB and BET have a physiological background. This makes them stronger candidates. It turns out that the SE, PRD, AIC of GAB were equally low, and with fewer parameters than Peleg. On the other hand, with respect to the confidence interval of the parameters using the 2–σ
bound, and in particular on the first parameter, C1 which
has the same unit as that of Xe, the GAB and Oswin
recorded the least percentage coefficient of variation (1–σ, %CV) for all the phenomena at different temperatures
(Tables 4 and 5). The GAB model is subsequently considered for describing the desorption and adsorption data at temperatures 25°C and 50°C. Montes et al. (2009) mentioned that the Peleg model was best for describing the desorption isotherm of two varieties of yam (D.
rotundata), while Peleg and Oswin models were found
suitable by Saad et al. (2014). For graphical presentation, the GAB and Peleg modelled graphs are shown in Figures 2 and 3.
Figure 2 Experimental and modeled curves of equilibrium moisture content (EMC) against water activity (aw) for desorption
(drying) and adsorption (wetting) at temperatures 25°C and 50°C using the GAB model
Figure 3 Experimental and modelled curves of equilibrium moisture content (EMC) against water activity(aw) for desorption (drying) and adsorption (wetting) at temperatures 25°C and 50°C
using the Peleg model
Table 2 Results for desorption isotherms fitting for yam (Dente) for 0≤aw≤0.85)
Parameters Temp
C1 C2 C3 C4
SE PRD AIC R2
25 0.07551 10.657 0.8152 - 0.0031 1.6376 –77.0689 0.9986
GAB
50 0.08274 10.126 0.7578 - 0.0005 0.2587 –108.975 0.9999
25 C10.1491 #: 0.0588 1.4890 - - 0.0061 4.0756 –68.2985 0.9936
Henderson
50 C10.1468 #: 0.0426 1.6445 - - 0.0031 2.3238 –80.5615 0.9981
25 0.0888
C1#: 0.0127 1.8044 - - 0.0068 5.6070 –66.4545 0.9922
Halsey
50 0.0913
C1#: 0.0089 1.9762 - - 0.0079 6.1604 –63.6301 0.9878
25 0.1124 0.4327 - - 0.0023 1.8441 –85.6891 0.9991
Oswin
50 0.1134 0.3938 - - 0.0030 2.2489 –81.0684 0.9983
25 0.0275 C2–4.1366 #: –0.1138 - - 0.0130 5.8967 –54.6993 0.9711
Smith
50 0.0322 C2–3.2855 #: –0.1059 - - 0.0151 6.2719 –51.9945 0.9556
25 0.2718 0.7789 - - 0.0129 10.092 –54.7542 0.9713
BET
50 0.2447 0.9898 - - 0.0107 8.5361 –58.1235 0.9776
25 0.2581 C20.7235 #: 0.1867 7.8501 0.7142 0.0015 0.7434 –85.1070 0.9997 Peleg
Table 3 Results for adsorption isotherms fitting for yam (Dente) for 0≤aw≤0.85)
Parameters Temp
C1 C2 C3 C4
SE PRD AIC R2
25 0.0666 10.913 0.8272 0.0015 0.9347 –89.6111 0.9996
GAB
50 0.0676 7.3021 0.8272 - 0.0015 0.9214 –90.4369 0.9996
25 0.1346
C1#:0.0541 1.4545 - - 0.0055 4.5866 –69.9337 0.9936
Henderson
50 0.1306
C1#:0.0646 1.346 - - 0.0043 3.7491 –74.663 0.9963
25 C10.0795 #:0.0113 1.7711 - - 0.0055 4.9815 –70.1532 0.9938
Halsey
50 C10.0746 #:0.0133 1.6653 - - 0.007 7.0769 –65.9287 0.9903
25 0.101 0.4415 - - 0.0009 0.8544 –102.288 0.9998
Oswin
50 0.0961 0.4722 - - 0.0022 2.1256 –86.9377 0.9991
25 0.0238 C2–4.3745 #: –0.1041 - - 0.0109 5.6366 –57.7567 0.9753
Smith
50 0.0188 C2–5.6389 #: –0.1061 - - 0.0088 4.808 –61.7074 0.9845
25 0.2522 0.7286 - - 0.0117 10.472 –56.5193 0.9717
BET
50 0.2641 0.6116 - - 0.0096 9.4046 –60.0401 0.9814
25 0.2087 C20.7524 #: 0.1570 6.2198 0.66734 0.001 0.6751 –91.685 0.9998 Peleg
50 0.206 0.7947
C2#: 0.1637 6.4882 0.77746 0.0011 0.7935 –89.7608 0.9998
Table 4 The 2σbounds and 1σ coefficient of variation (CV) for desorption parameters (0≤aw≤0.85)
C1 C2 C3 C4
Temp
–2σ +2σ 1σ (%CV) –2σ +2σ 1σ (%CV) –2σ +2σ 1σ (%CV) –2σ +2σ 1σ (%CV) 25 0.0669 0.0841 5.7 5.7718 15.543 22.9 0.7761 0.8543 2.4
GAB
50 0.0809 0.0846 1.1 9.3779 10.875 3.7 0.7491 0.7663 0.6 25 0.1434 0.1548 1.9 1.3365 1.6416 5.1
Henderson
50 0.1439 0.1497 1 1.5522 1.7368 2.8
25 0.0821 0.0955 3.8 1.618 1.9909 5.2
Halsey
50 0.0834 0.0992 4.3 1.714 2.2384 6.6
25 0.1102 0.1147 1 0.4168 0.4486 1.8
Oswin
50 0.1106 0.1163 1.3 0.3734 0.4143 2.6
25 0.0111 0.0439 29.9 -7.1362 -1.1371 36.3
Smith
50 0.0131 0.0513 29.7 -0.1262 -0.0855 37.7
25 0.2221 0.3215 9.1 0.4223 1.1354 22.9 BET
50 0.2093 0.28 7.2 0.6036 1.376 19.5
25 0.1991 0.317 11.4 0.5804 0.8667 9.9 5.9596 9.7406 12 0.6525 0.776 4.3 Peleg
50 0.1449 0.1583 2.2 1.0502 1.1796 2.9 4.4409 5.4437 5.1 0.5905 0.6485 2.3
Table 5 The 2σbounds and 1σ coefficient of variation for adsorption parameters (0≤aw≤0.85)
C1 C2 C3 C4
Temp
–2σ +2σ 1σ (%CV) –2σ +2σ 1σ (%CV) –2σ +2σ 1σ (%CV) –2σ +2σ 1σ (%CV)
25 0.0625 0.0706 3 8.0991 13.727 12.9 0.8068 0.8476 1.2
GAB
50 0.0629 0.0722 3.4 5.6763 8.9279 11.1 0.8055 0.8489 1.3
25 0.1294 0.1399 1.9 1.306 1.6029 5.1
Henderson
50 0.1265 0.1346 1.6 1.2422 1.4497 3.9
25 0.074 0.085 3.4 1.6088 1.9335 4.6
Halsey
50 0.0678 0.0815 4.9 1.4762 1.8544 5.7
25 0.1001 0.1019 0.4 0.4345 0.4486 0.8
Oswin
50 0.094 0.0982 1.1 0.4549 0.4895 1.8
25 0.0099 0.0377 29.2 -7.438 -4.375 35
Smith
50 0.0077 0.03 29.6 -9.494 -1.784 34.2
25 0.2049 0.2994 9.4 0.3943 1.0628 22.9
BET
50 0.22 0.3084 8.4 0.3745 0.8487 19.4
25 0.186 0.2313 5.4 0.6764 0.8283 5 5.1718 7.2678 8.4 0.611 0.72372 4.2 Peleg
4 Conclusion
Important thermodynamic characteristics for predicting the interactions between water and food components are moisture desorption and adsorption isotherms. The moisture desorption and adsorption isotherms for yam (the Dente cultivar of D. Rotundata) have been determined at 25 oC and 50°C by the dynamic method using the DVS analyser between 0% to 0.95% water activity. The isotherms showed a sigmoidal shape. The equilibrium moisture contents were found to increase with increasing water activity at constant temperature. While at constant EMC the water activity is higher at higher temperature under adsorption, there is no significant difference in the case of desorption. Crossing of the adsorption isotherms of 25°C and 50oC, and of the adsorption and desorption isotherms at 50°C took place at higher water activity, which is most probable result of the low sugar content in yam compared to other products, as discussed before. Within the range 0≤aw≤0.85 all seven
models tested can provide a reasonable fit, although the BET and Smith models are inferior for yam. All models require two different parameter sets to describe the hysteresis between adsorption and desorption, which is a common flaw of these equations. Based on the standard error of prediction, the Peleg, Oswin and GAB models were found as most suitable to describe the experimental equilibrium moisture contents of yam (Dente) of both desorption and adsorption. The parameter uncertainty of the Oswin model is low. In general, a low parameter uncertainty means that the parameters can be estimated well from experimental data. At 50°C the absolute error is larger for the Oswin model than for Peleg and GAB. The Oswin model has the lowest AIC for sorption, which may make it the best model when it is needed to describe wetting of a product. For drying, however, the larger number of parameters in the Peleg and GAB models is justified, as shown by the lowest AIC values at desorption. Of these two, the GAB is preferred since it has a physiological basis, and fewer parameters that can be estimated quite well from experimental data.
References
Aguilera, J. M., and D. W. Stanley. 1999. Microstructural
Principles of Food Processing and Engineering. Aspen Publishers INC. Gaithersburg Maryland
Andrade, P. R. D., M. R. Lemus, and C. C. E. Pérez. 2011. Models of sorption isotherms for food: uses and limitations. Vitae, Revista of the Facultad of Química Farmacéutica, 18(3): 325–334.
Fioreze, R., and B. Morini. 2000. Yam (Dioscorea sp) drying with different cuts and temperatures: experimental and simulated results. Food Science and Technology (Ciencia e Tecnologia de Alimentos), 20(2): 262–266.
Gálvez, A. V., E. L. Aravena, and R. L. Mondaca. 2006. Isotermas de adsorción en harina de maíz (Zea mays L.). Food Science and Technology (Ciencia e Tecnologia de Alimentos), 26(4): 821–827.
Goula, A. M., T. D. Karapantsios, D. S. Achilias, and K. G. Adamopoulos. 2008. Water sorption isotherms and glass transition temperature of spray dried tomato pulp. Journal of Food Engineering, 85(1): 73–83
Hu, S. 2007. Akaike Information Criterion. Available at: http://www4.ncsu.edu/~shu3 /Presentation/ AIC.pdf. Accessed 4 June 2018.
Igathinathane, C., A. R. Womac, S. Sokhansanj, and L. O. Pordesimo. 2005. Sorption equilibrium moisture characteristics of selected corn stover components. Transaction of the ASAE, 48(4): 1449–1460.
Kenyon, L., P. Anandajayasekeram, and C. Ochieng. 2006. A synthesis/lesson-learning study of the research carried out on root and tuber crops commissioned through the DFID-RNRRS research programmes between 1995 and 2005. Available at: http://www.envirobase.info/PDF/Root_Tuber_research_synth esis_P1.pdf. Accessed 4 June 2018.
Kiranoudis, C. T., Z. B. Maroulis, E. Tsami, and D. Marinos-Kouris. 1993. Equilibrium moisture content and heat of desorption of some vegetables. Journal of Food Engineering, 20(1): 55–74.
Labuza T. P., S. Mizrahi, and M. Karel. 1972. Mathematical models for optimization of flexible film packaging of foods for storage. Transactions of the American Society of Agricultural Engineers, 15(1): 150–155.
Levine, H., and L. Slade. 1991. Water Relations in Foods. New York, United States: Plenum Press.
Ljung, L. 1987. System Identification – Theory for the User. Englewood Cliffs, New Jersey: Prentice-Hall.
Maroulis, Z. B., E. Tsamihttp://www.sciencedirect.com.ezproxy. library.wur.nl/science/article/pii/0260877488900696, D. Marinos-Kouris, and G. D. Saravacos. 1988. Application of the GAB model to the moisture sorption isotherms for dried fruits. Journal of Food Engineering, 7(1): 63–78.
(Dioscorea rotundata). Dyna, 76(157): 145–152.
Myhara, R. M., M. S. Taylor, B. A. Slominski, and I. Al-Bulush. 1998a. Moisture sorption isotherms and chemical composition of Omani dates. Journal of Food Engineering, 37(4): 471–479.
Myhara, R. M., S. S. Sablani, S. M. Al-Alawi, and M. S. Taylor. 1998b. Water sorption isotherms of dates: modeling using GAB equation and artificial neural network approaches. LWT-Food Science and Technology, 31(7-8): 699–706. Oliveira, M. M., A. R. N. Campos, J. P. Dantas, J. P. Gomes, and F.
L. H. D. Silva. 2006. Desorption isotherms of passion fruit peel (Passiflora edulis Sims): experimental determination and mathematical model evaluation. Cienc Rural, 36(5): 1624–1629.
Opara, L. U. 2003. YAMS: Post-harvest operation. Massey University, New Zealand. Available at: http://www.fao.org/3/a-ax449e.pdf. Accessed 4 June 2018.
Owo, H. O., A. A. Adebowale, O. P. Sobukola, A. O. Obadina, O. E. Kajihausa, M. O. Adegunwa, L. O. Sanni and K. Tomlins. 2017. Adsorption isotherms and thermodynamics properties of water yam flour. Quality Assurance and Safety of Crops & Foods, 9(2): 221–227.
Quirijns, E. J., A. J. Van Boxtel, W. K. van Loon, and G. van Straten. 2005. Sorption isotherms, GAB parameters and isosteric heat of sorption. Journal of the Science of the Food and Agriculture, 85(11): 1805–1814.
Rizvi, S. S. H. 1995. Thermodynamic properties of foods in
dehydration. In Engineering Properties of Foods, 2nd ed., eds. M. A. Rao and S. S. H. Rizvi, 223–309. New York: Mansall Dekker Inc.
Saad, A., B. Touati, B. Draoui, B. Tabti, A. Abdenebi and S. Benaceur. 2014. Mathematical modeling of moisture sorption isotherms and determination of isosteric heats of sorption of Ziziphus leaves. Modelling and Simulation in Engineering, 2014: article No. 16.
Sahin, S., and S. G. Sumnu. 2006. Physical Properties of Foods. New York, United States: Springer.
Samaniego-Esquerra, C. M., I. F. Boag and G. L. Robertson. 1991. Comparison of regression methods for fitting the GAB model to the moisture isotherms of some dried fruits and vegetables. Journal of Food Engineering, 13(2): 115–133.
Siripatrawan, U., and P. Jantawat. 2006 Determination of moisture sorption isotherms of jasmine rice crackers using BET and GAB models. Food Science and Technology International, 12(6): 459–465.
Toğrul, H., N. Arslan. 2007. Moisture sorption isotherms and thermodynamic properties of walnut kernels. Journal of Stored Products Research, 43: 252–264.
Tsami, E., D. Marinos-Kouris, and Z. B. Maroulis. 1990. Water sorption isotherms of raisins, currants, figs, prunes and apricots. Journal of Food Science, 55(6): 1594–1597.