Backwash process in a sand filter prototype used in irrigation
Álvaro Henrique Cândido de Souza
1*, Cássio de Castro Seron¹,
Marcelo Zolin Lorenzoni², Fábio Ponciano de Deus³, Roberto Rezende¹
(1. Post Graduate Program in Agronomy, State University of Maringá, Maringá, Paraná;2. Federal Institute Goiano, Campus Posse, Posse, Goiás;
3. Graduate Program in Water Resources in Agricultural Systems, Federal University of Lavras, Lavras, Minas Gerais)
Abstract: Backwash process of sand filters requests specific surface velocity to reach the recommended filter bed height expansion, however the expansion of the filter bed height is very influenced by their characteristics. This work had as aim to evaluate the effect of different sand particle size, static filter bed layer and expansion of the filter bed height on a prototype of sand filter during backwash process. The tests were accomplished using a sand filter prototype that had structural similarity and shape as commercial equipments (24 cm of height and 12.7 cm of diameter). The treatments consisted from combinations of five separate sand particle sizes (0.15; 0.34; 0.51; 0.72 and 0.92 mm of medium diameter), five static filter bed layer (5; 7; 9; 11 and 13 cm) and different expansion of the filter bed height, with three replications. In general, the sand filter prototype was effective in characterizing with accuracy the backwash process, being possible using to obtain superficial velocity to reach specific filter bed height expansion using different sand particle sizes and static filter bed layer.
Keywords: irrigation water treatment, superficial velocity, sand particle sizes, filter bed layer
Citation: Souza, A. H. C., C. C. Seron, M. Z. Lorenzoni, F. P. Deus, and R. Rezende. 2019. Backwash process in a sand filter
prototype used in irrigation. Agricultural Engineering International: CIGR Journal, 21(1): 109–114.
1 Introduction
The technical and economic viability of localized irrigation systems use are limited by need for an adequate water treatment. The emitters clogging in localized irrigation is the main problem in their use, because it can reduce application uniformity and consequently crop productivity (Borssoi et al., 2012).
Among the solutions proposed for irrigation water treatment, the use of pressurized sand filters has highlighted because of high efficiency in removal of organic particles and algae (Testezlaf, 2008).
The sand filter operation starts with the filtration process, where a certain volume of removed contaminants from tributary will determine increase of the pressure loss in the time (Deus et al., 2015), and probable decrease the
Received date: 2018-01-08 Accepted date: 2019-01-31 *Corresponding author: Álvaro Henrique Cândido de Souza,
State University of Maringá, Maringá, Paraná, Avenue Colombo 5790, zip code 87020900, +5544 30118940, Email: alvarohcs@ hotmail.com.
removal efficiency, needing the cleaning filter bed layer, denominated as backwash process (Ramirez et al., 2011; Deus et al., 2016).
Backwashing is accomplished by conducting of pre-filtered water through one or more filters from filter set, in the opposite direction of the filtration process (generally upward), with sufficient velocity to provide an adequate expansion level and shaking of the filter bed to clean itself (Ramirez et al., 2011). According to the same author, the superficial velocity (relationship between flow rate and the cross-section area of water flow in the filter) increases with increasing expansion level and sand particle size.
Poorly executed cleanings determine time reduction of the subsequent filtration process, and consequent removal efficiency reduction (Van Staden and Haarhoff, 2011). Additionally, properly characterizing the backwash process allows to avoid losses of the filter material.
equipment that in general do not present possibility of the process visualization. The establishment of an adjusted model can be used to guide the sand filters operation, and it would be of great contribution. In this context, the objective of the present work was to evaluate the influence of different sand particle sizes, static filter bed layers and filter bed height expansion on a prototype of sand filter during backwash process.
2 Materials and methods
The experiment was conducted at the Hydraulics Laboratory at Federal University of Lavras, Minas Gerais State in Brazil. The experimental module was composed by one sand filter prototype, one single-stage centrifugal pump of 1 hp (model BC-91), one water storage, two gate valve, pipes and fittings of 50 mm diameter (Figure 1).
Figure 1 Layout of the experimental module, with detail of sequence of equipment arrangement
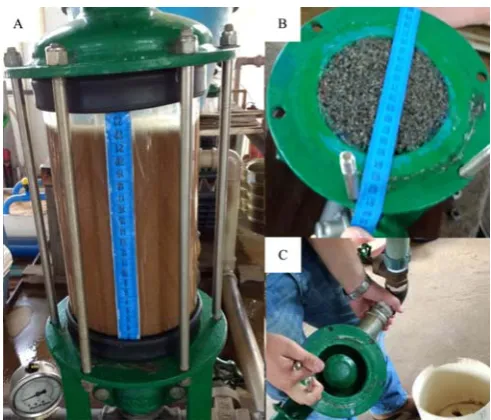
The filter body was constructed with acrylic tube on purpose to notice the filter bed height expansion during the backwash process. The support and closing parts of the inlet and outlet filter body were fabricated with welded iron plates. Rubber sealing were used for fence on upper and lower surface between acrylic tube and iron plate. Filter locking was done using threadable iron rod that intended to approach the lower surface to the top surface. The prototype drain was composed of porous surface, ensuring homogeneity during backwash process. The prototype diffuser plate was compatible with commercial sand filters (Figure 2).
The drains were elements designed to perform two functions: the first is to allow the passage of the filtered water to irrigation system, preventing the passage of sand particles from the filter bed into irrigation system; and the second, during the backwash process or filter bed cleaning, evenly distribute the reverse flow of water
throughout the bed, avoiding the occurrence of preferential pockets and dead spots where no occurs withdrawal of those retained particles in the filtration process. The diffuser plate was a structure used in the filtration process, which aims to dissipate the kinetic energy of the water at the entrance of the filter, avoiding direct collision with the filter layer (Testezlaf et al., 2014).
Figure 2 Sand filter prototype in operation, with details of the acrylic filter body (A), porous surface drainage system (B) and
diffuser plate (C)
The treatments were composed of five sand particle size (granulometry) (G1, G2, G3, G4 and G5), five static filter bed layers: (H1) 5 cm; (H2) 7 cm; (H3) 9 cm; (H4) 11 cm and (H5) 13 cm and different filter bed height expansion (EBH).
The sand used had a specific particle mass of 2.6 g cm-3 and specific soil mass of 1.3 g cm-3, and were separated by five-fraction sieves to five ranges, being: S1: 0.053-0.25 mm; S2: 0.25-0.425 mm; S3: 0.425-0.6 mm; S4: 0.6-0.85 mm; S5: 0.85-1.0 mm.
The superficial velocity (m h-1) during the backwash process was determined by ratio of the water collected volume water (m³) by the measured time (h) and filter body area (m²). In order to standardize samples, each sample lasted 5 minutes for stabilization, and three collections were performed per treatment (three replications). The backwash system was manually operated by opening and closing of gate valve.
(Siwiec, 2007):
100 o
o H H EBH
H
⎛ − ⎞
=⎜ ⎟×
⎝ ⎠ (1)
where, EBH - filter bed height expansion, %; H - expanded filter bed layer, cm; Ho – static filter bed layer, cm.
For the statistical analysis and modeling, the medium diameter (G) was considered as representative value between the sieves, being G1: 0.1515 mm; G2: 0.3375 mm; G3: 0.5125 mm; G4: 0.725 mm; and G5: 0.925 mm medium diameter.
Using the statistical program SISVAR (Ferreira, 2008), analysis of variance was evaluated to obtained differences among treatments. A representative model of the relationship between backwash superficial velocity and the filter bed characteristics (static filter bed layer, medium diameter, filter bed height expansion) was selected.
For the selection of the model, the Backward Euler method and the Student´s t-test were used to analyze the significance of the regression coefficients (p<0.01) that allowed added and discarded variables of model until reaching the best model. Complete model designed was showed in Equation (2):
SV=B0+B1*(G)+B2*(G2)+B3*(H0)+B4*(H02)+B5*(EBH)+
B6*(EBH2)+B7*(G)*(H0)+B8*(G)*(EBH)+B9*(H0)*
(EBH)+B10*(G)*(H0)*(EBH) (2)
where, SV - estimated superficial velocity, m h-1; Bi -
estimated regression coefficients; G - medium diameter, mm; H0 - static filter bed layer, cm; EBH - filter bed
height expansion, %.
Models were fitted for minimum superficial velocity (25% EBH), according to Brouckart (2004), allowing a comparison of numerical values between treatments and with other authors that recommend the same expansion level, such as Ramirez (2010).
3 Results and discussion
Based on the analysis of variance, there was significant differences (P<0.01) for superficial velocity under different granulometry, static filter bed layers and filter beds height expansion (Table 1).
Using the Backward Euler method was possible to adjust a multivariate model that correlates SV with medium diameter of the sand particle size (G), H0 and
EBH with every coefficients significant at 1% and with high coefficient of adjusted determination (R2 = 0.96; CV = 13.4%), being described as:
SV=–23.61+80.79*(G)+0.68*(EBH)+29.08*(G2)+0.11*
(H02)-0.003*(EBH2)–5.12*(G)*(H0)+0.82*(G)*(EBH)–
0.05*(H0)*(EBH)+0.10*(G)*(H0)*(EBH) (3)
Table 1 Summary of the analysis of variance for superficial velocity (SV) under different medium diameter (G), static filter
bed layer (Ho) and filter bed height expansion (EBH)
SV DF MS Fc
G 4 91085.21 446.29**
H0 4 2972.50 14.56**
EBH 24 3204.72 15.70**
Erro 256 204.09
Total 288
G H0
G1a (10.58 m h-1) H1b (53.56 m h-1)
G2b (30.87 m h-1) H2bc (57.36 m h-1)
G3c (66.96 m h-1) H3c (63.19 m h-1)
G4d (87.75 m h-1) H4ab (49.88 m h-1)
G5e (104.13 m h-1) H5a (45.56 m h-1)
CV (%) 26.31
Média Geral (m h-1) 54.29
Note: ** significant at 0.01 probability level; Means within column followed by the same letters are not significantly difference at 1% level; SV – source of variation (treatments); DF – degress freedom; MS – mean square; G – granulometry; CV – coefficient of variation.
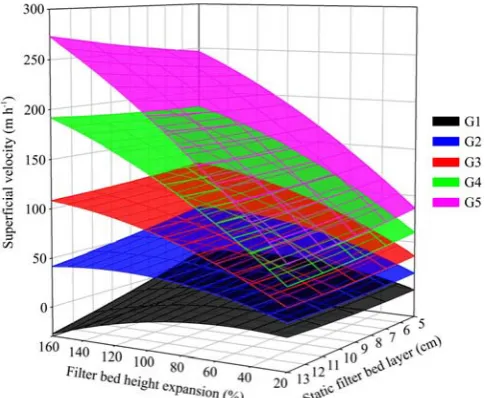
Graphical representation of adjusted model (Figure 3) allowed to notice increasing of superficial velocity was associated with increasing of EBH and G. In general, response of granulometry was regular for all the applied treatments, allowing a fit of a complete model for all the tested granulometry.
Space limitations for expansion inside the filter had limited some points, thus, the considered maximum value of EBH was 160%.
In order to evaluate the increase of EBH at 160%, it was verified that the increase in H0 determined an
increase in SV with thick granulometry (G4 and G5), and caused reduction of the superficial velocity for the fine sand (G1 and G2).
However, G3 granulometry was not affected by H0
and can be verified by the homogeneity of “b1” equation coefficient (Table 2). This behavior was also observed by Ramirez (2010) with similar granulometry (effective diameter of 0.5 mm), and in his test with different static filter bed layer in a commercial sand filter, no difference was obtained of superficial velocity with increasing of H0
for 25% EBH. On the other hand, there were differences in the use of other granulometry (effective diameter 0.85 and 1.15 mm).
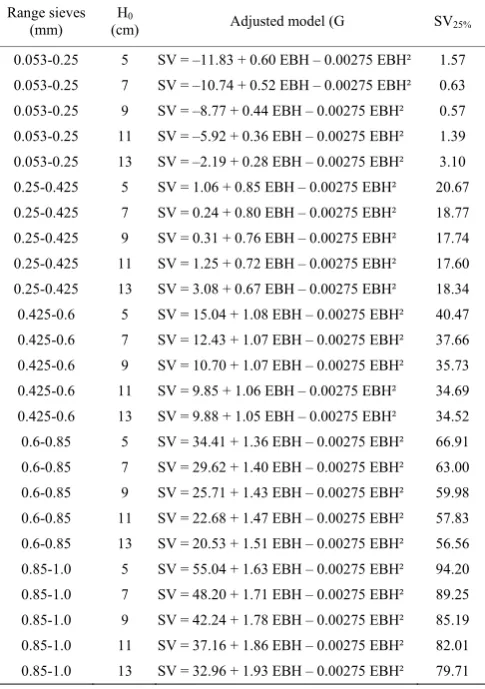
Table 2 Adjusted models according to G and H0 (cm) and
estimated minimum superficial velocity (SV25%) (m h-1)
Range sieves (mm)
H0
(cm) Adjusted model (G SV25%
0.053-0.25 5 SV = –11.83 + 0.60 EBH – 0.00275 EBH² 1.57 0.053-0.25 7 SV = –10.74 + 0.52 EBH – 0.00275 EBH² 0.63 0.053-0.25 9 SV = –8.77 + 0.44 EBH – 0.00275 EBH² 0.57 0.053-0.25 11 SV = –5.92 + 0.36 EBH – 0.00275 EBH² 1.39 0.053-0.25 13 SV = –2.19 + 0.28 EBH – 0.00275 EBH² 3.10 0.25-0.425 5 SV = 1.06 + 0.85 EBH – 0.00275 EBH² 20.67 0.25-0.425 7 SV = 0.24 + 0.80 EBH – 0.00275 EBH² 18.77 0.25-0.425 9 SV = 0.31 + 0.76 EBH – 0.00275 EBH² 17.74 0.25-0.425 11 SV = 1.25 + 0.72 EBH – 0.00275 EBH² 17.60 0.25-0.425 13 SV = 3.08 + 0.67 EBH – 0.00275 EBH² 18.34 0.425-0.6 5 SV = 15.04 + 1.08 EBH – 0.00275 EBH² 40.47 0.425-0.6 7 SV = 12.43 + 1.07 EBH – 0.00275 EBH² 37.66 0.425-0.6 9 SV = 10.70 + 1.07 EBH – 0.00275 EBH² 35.73 0.425-0.6 11 SV = 9.85 + 1.06 EBH – 0.00275 EBH² 34.69 0.425-0.6 13 SV = 9.88 + 1.05 EBH – 0.00275 EBH² 34.52 0.6-0.85 5 SV = 34.41 + 1.36 EBH – 0.00275 EBH² 66.91 0.6-0.85 7 SV = 29.62 + 1.40 EBH – 0.00275 EBH² 63.00 0.6-0.85 9 SV = 25.71 + 1.43 EBH – 0.00275 EBH² 59.98 0.6-0.85 11 SV = 22.68 + 1.47 EBH – 0.00275 EBH² 57.83 0.6-0.85 13 SV = 20.53 + 1.51 EBH – 0.00275 EBH² 56.56 0.85-1.0 5 SV = 55.04 + 1.63 EBH – 0.00275 EBH² 94.20 0.85-1.0 7 SV = 48.20 + 1.71 EBH – 0.00275 EBH² 89.25 0.85-1.0 9 SV = 42.24 + 1.78 EBH – 0.00275 EBH² 85.19 0.85-1.0 11 SV = 37.16 + 1.86 EBH – 0.00275 EBH² 82.01 0.85-1.0 13 SV = 32.96 + 1.93 EBH – 0.00275 EBH² 79.71 Note: Equations derived from the complete model (Equation 3) considering G and H0 for summarizing: SV = –23.61 + 80.79 * (G) + 0.68 * (EBH) + 29.08 *
(G²) + 0.11 * (Ho2) – 0.003 * (EBH2) – 5.12 * (G) * (Ho) + 0.82 * (G) * (EBH) –
0.05 * (Ho) * (EBH) + 0.10 * (G) * (Ho) * (EBH), R2 = 0.96, every coefficients at 1% significance
Table 2 are presented the adjusted models for Figure 3. For comparison purposes, recommended superficial velocity at 25% EBH was estimated and showed (Brouckart, 2004). It was verified that all models adjusted in function of granulometry and static filter bed layer were better adjusted by quadratic model.
Superficial velocity at 25% EBH was more detailed at Figure 4, in that increasing of static filter bed layer decreased SV at 25%.
Figure 4 Superficial velocity at 25% EBH as function of different static filter bed layer and sand granulometry
Ramirez (2010) in his experimental of commercial sand filters required 64.1 m h-1 for 25% of expansion, using granulometry between 0.5 and 1.0 mm and 11 cm of static filter bed layer. For static filter bed layer of 22.5 cm, it was obtained 69.1 m h-1. These values are close to found ones in this work from proposed general model (Equation (3)), it would be 57.26 and 62.16 m h-1 respectively. Using thick granulometry (0.8-1.2 mm), Ramirez (2010) obtained for same conditions 77.4 and 90.4 m h-1 (11 and 22.5 cm of static filter bed layer, respectively), values closing to obtained in this test, (91.68 and 88.25 m h- 1 respectively).
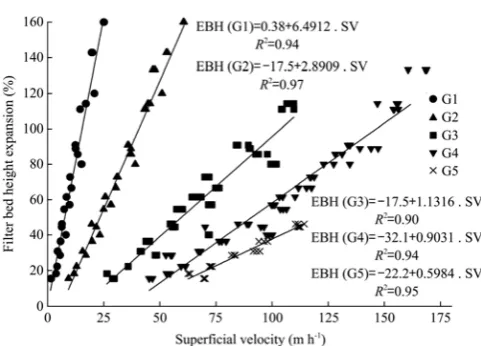
In order to simplify the model, the filter bed height expansion data were adjusted as a function of superficial velocity for different granulometry, thus neglecting the low effect of H0. The data were better fitted to the
increasing linear models (R2 ≥0.90) (Figure 5).
Figure 5 Superficial velocity response to filter bed height expansion for different sand particle sizes
In Figure 5 it is possible to observe the sand particle size influence (G) on SV. It can be observed that the increase in sand particle size and in filter bed height expansion require higher superficial velocity, as pointed out by Ramirez (2010). The sand granulometry interferes considerably on slope function of superficial velocity and filter bed height expansion. It can be observed that the curve slope is inversely proportional to the sand granulometry (Ramirez, 2010; Siwiec, 2007). Siwiec (2007) attributed the effect of different sand particle size to the Archimedes number change, which is used to calculate the theoretical superficial velocity and which depends mainly on sand diameter.
So far, there is no Brazilian standard or legislation that regulates the physical parameters required for sand selection for irrigation sand filters (Mesquita, 2014), but it is known that the filter bed characteristics (sand granulometry, static filter bed layer, filter bed height expansion) require different velocity during backwash process, and backwash velocity interferes in cleaning efficiency and consequently in filtration efficiency (Deus et al., 2016).
This work modeled the influence of the filter bed characteristics under superficial velocity. However, it is important to note that this behavior was obtained for specific conditions of this work, because the values obtained depend on the constructive characteristic of the internal constituents (diffuser plate and drain) of evaluated sand filter. According to Mesquita et al. (2012), the type of drain determines different distribution homogeneity of the flow lines and consequently different
pressure loss values. It can result in different superficial velocity for a certain layer expansion level, and modify the removal and detachment efficiency of inorganic and organic particles from the layer.
4 Conclusions
In this work, for the conditions studied, methodologies and equipment used, and according to analyzes and discussions presented the following conclusions:
The sand filter prototype was effective in characterizing with accuracy the backwash process, being possible using to obtain superficial velocity to reach specific filter bed height expansion using different sand particle sizes and static filter bed layer.
Filter bed height expansion as a function of superficial velocity were better fitted to linear models for different granulometry neglecting the effect of Ho.
References
Borssoi, A. L., M. Vilas Boas, M. Reisdorfer, R. H. Hernández, F. A. C. Follador. 2012. Water application uniformity and fertigation in a dripping irrigation set. Engenharia Agrícola,
32(4): 718–726.
Brouckart, M. B. 2004. Hydrodynamic detachment of deposited particles in fluidized bed filter backwashing. M.S. thesis, Georgia: Georgia Institute of Technology.
Deus, F. P., R. Testezlaf, and M. Mesquita. 2015. Eficiência de filtros de areia pressurizados na remoção de diferentes tamanhos de partículas da água de irrigação. Pesquisa Agropecuária Brasileira, 10(50): 939–948.
Deus, F. P., R. Testezlaf, and M. Mesquita. 2016. Assessment methodology of backwash in pressurized sand filters. Revista Brasileira de Engenharia Agrícola e Ambiental, 7(20):
600–605.
Ferreira, D. F. 2008. Sisvar: um programa para análises e ensino de estatística. Revista Científica Symposium, 6(2): 36–41.
Mesquita, M. 2014. Desenvolvimento tecnológico de um filtro de areia para irrigação localizada. M.S. thesis, Campinas: FEAGRI.
Mesquita, M., R. Testezlaf, and J. C. S. Ramirez. 2012. The effect of media bed characteristics and internal auxiliary elements on sand. Agricultural Water Management, 115: 178–185.
Ramirez, J. C., R. Testezlaf, and M. Mesquita. 2011. Processo da retrolavagem em filtros de areia usados na irrigação localizada.
Engenharia Agrícola, 31(6): 1226–1237.
filtros de areia. M.S. thesis, Campinas: FEAGRI.
Siwiec, T. 2007. The experimental verification of Richardson-Zaki law on example of selected beds used in water treatment.
Electronic Journal of Polish agricultural Universities, 10(2):
1–5.
Testezlaf, R., F. P. Deus, and M. Mesquita. 2014. Filtros de areia
na irrigação localizada. Campinas, Brazil: UNICAMP.
Testezlaf, R. 2008. Filtros de areia aplicados à irrigação localizada: teoria e prática. Engenharia Agrícola, 28(3): 604–613. Van Staden, S. J. , and J. Haarhoff. 2011. The use of filter media to