Mathematical models of geometric sizes of coffee beans as
dependent random variables
Roman Kuzminskyj
∗, Roman Sheremeta
(Faculty of Mechanical and Energy Engineering, Lviv National Agrarian University, Volodymyr the Great st., 1, Dubliany, Zhovkva district, Lviv region, 80381, Ukraine)
Abstract: Dimensions of 100 randomly selected coffee beans of the Arabica and Robusta variety were determined by measuring their length (l), width (b) and thickness (h). The results of the measurements were processed by the methods of mathematical statistics. Parameters of distributions of separate sizes as random variables were determined. By the value of the coefficient of variation, the density function of normal distribution (Gaussian distribution) was taken as a model of separate sizes of beans. Models of two-dimensional distributions of beans sizes as independent random variables were presented. The coefficients of correlation between the geometric sizes of beans are calculated. The obtained values of the correlation coefficients indicated that the geometric sizes of beans should be considered as dependent random variables. The mathematical models of geometric sizes of beans as dependent random variables as density functions of their normal distribution were proposed. By values of the sums of squared deviations as a fitting criterion it has been established that the mathematical models of geometric sizes of beans as dependent random variables in the form of density functions of their normal distribution provide better data approximation than the mathematical models of geometric sizes of beans as independent random variables.
Keywords: coffee beans, geometric parameters, mathematical models, distribution function
Citation:Kuzminskyj, R., and R. Sheremeta. 2018. Mathematical models of geometric sizes of coffee beans as dependent random variables. Agricultural Engineering International: CIGR Journal, 20(4): 178–183.
1 Introduction
Beans and seeds as a biological material are very variable. Geometric sizes of beans, berries and seeds of different crops need to be known in order to provide an efficient separation process, as well as for the design of machinery and equipment for transportation, storage and further processing. Sometimes, only two geometric sizes of beans, berries and seeds, such as length and width are distinguished (since the thickness and width of beans, berries and seeds are considered to be the same) (Karimi et al., 2011; Zewdu and Solomon, 2007). Beyond that, only data on the limits of the variation of individual geometric sizes of some beans, berries and seeds are mainly given in the literature (Müller et al., 2015; Zewdu
Received date: 2018-02-15 Accepted date: 2018-04-16
∗Corresponding author: Roman Kuzminskyj, Dr. sc., Volodymyr the Great st., 1, Dubliany, Zhovkva district, Lviv region, 80381, Ukraine, +380968600796, Email: [email protected].
and Solomon, 2007). For all intents and purposes, it is important to specify the probability distribution laws of all three principal dimensions of beans, berries and seeds as random variables, the relationships between individual sizes taking into account additionally.
Researchers from many countries studied the geometric sizes of seeds of different crops (Karaj and
Muёller, 2010; Müller et al., 2015; Niveditha et al., 2013).
frequency for length was 10 mm, for width - 7 mm and for thickness - 7 mm. Severa et al. (2012) analyzed twenty different coffee types originating from 13 different countries and confirmed a dominant importance and the relevance of length-to-width ratio.
In many scientific papers, the effect of relative humidity on the dimensions of seeds of different crops was investigated (Karimi et al., 2009; Milani et al., 2007; Sanchez-Mendoza et al., 2008; Sokolovskyj et al., 2012;
Zewdu and Solomon, 2007). In particular many
researches examined the geometric sizes of beans, berries
and seeds as random variables (Gursoy and Guzel,2010;
Karimi et al., 2011; Mansouri et al., 2015; Mirzabe et al., 2013). For example, as a result of the statistical processing of measurements of geometric sizes of winter wheat seeds, the laws of distribution of length, width and thickness of seeds of separate varieties were established (Sokolovskyj et al., 2012). The two-dimensional Weibull distribution was used to describe the geometric sizes of raisin berries, assuming that individual geometric sizes were independent random variables (Karimi et al., 2011). Obtaining two-dimensional distributions of geometric sizes of seeds is important for ensuring the proper quality of separation processes (Kuzminskyj et al., 2014).
The aim of the study is to establish the relationship between separate geometric sizes of coffee beans and to obtain mathematical models of their distribution based on the results of experimental studies. Such a mathematical model will allow you to accurately thaw the size of coffee beans to model transport processes during storage, processing (separation, grinding) and packaging.
2 Material and methods
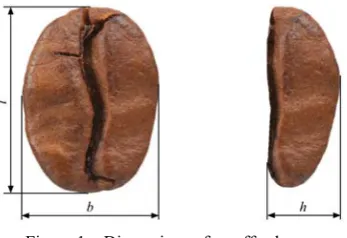
The geometric dimensions of coffee beans (see Figure
1) were determined by measuring length (l), width (b) and
thickness (h).
Figure 1 Dimensions of a coffee bean
Dimensions of 100 randomly selected coffee beans of the Arabica and Robusta variety were measured using an microscope Sigeta Forward (see Figure 2) with an increase from 10 to 500 times.
Figure 2 Microscope Sigeta Forward
Density functions of the normal distribution of separate dimensions as random variables are as follows:
2 2
( [ ])
2 [ ]
1 ( )
[ ] 2
x M x
σx
f x e
σ x π
⎡ − ⎤ −⎢ ⎥
⎢ ⎥
⎣ ⎦
= (1)
and the integral function of their distribution:
2 2
( [ ])
2 [ ]
1 ( )
[ ] 2
x M x x
σ x
F x e dx
σ x π
⎡ − ⎤ −⎢ ⎥
⎢ ⎥
⎣ ⎦
−∞
=
∫
(2)where, M[x] – mathematical expectation, mm; σ[x] –
mean square deviation, mm; x – random variable (length,
width or thickness of the beans), mm.
For example, considering the length and width of the coffee beans as independent normally distributed random variables, taking into account the type of differential function (1), the model of their two-dimensional distribution is obtained:
( , ) ( ) ( )
f l b = f l f b (3)
2 2 2 2 ( [ ]) ( [ ]) 0,5 [ ] [ ] 1 ( , )
2 [ ] [ ]
l M l b M b
σl σb
f l b e
πσl σ b
⎡ − − ⎤
− ⎢ + ⎥
⎢ ⎥
⎣ ⎦
= (4)
Given the correlation coefficient rlb between the
length l and width b of the bean, the two-dimensional
normal distribution model will have the form:
( )
2 2
2 2
2
1 ( [ ]) ( [ ]) [ ] [ ]
2 [ ] [ ] [ ] [ ] 2 1 2 ( , ) 1 2 [ ] [ ] 1
lb lb
l M l b M b l M l b M b
r
σl σb
σl σb r
lb
f l b
e
πσl σb r
⎡ ⎤ − − + − − − ⋅ − ⎢ ⎥ ⎢ ⎥ − ⎣ ⎦ = − (5)
where, M[l], M[b] – mathematical expectation of the
mean square deviation of the length and width of beans
respectively, mm; rlb – the value of the correlation
coefficient between l and b.
The correlation coefficient is calculated by the formula:
(
)(
)
(
)
2(
)
2[ ] [ ]
[ ] [ ]
xy
x M x y M y r
x M x y M y
− −
=
− −
∑
∑
∑
(6)where, x, y – geometric dimensions (length, width or
height), mm; M[x], M[y] – mathematical expectations of
the sizes x and y respectively, mm.
The criterion of the sum of squared deviations (SSD)
is used in order to compare the results of the approximation of experimental data on the measurement of bean grain sizes by two-dimensional distributions of their geometric sizes, both independent and dependent random variables. The criterion of fitting is calculated by the formula:
2
, T ,
1 1
( )
j
i k
k
i j i j
i j
SSD m m
= =
⎛ ⎞
= ⎜⎜ − ⎟⎟
⎝ ⎠
∑ ∑
(7)where, i, j – sequence count of intervals of geometric
sizes of beans, as random variables; ki, kj – number of
intervals of separate geometric sizes of beans; mi,j, mT i,j –
the number of data in separate intervals of geometric sizes of beans, obtained respectively as the results of measurements and according to the calculation results using the theoretical models in the form of two-dimensional distributions of random variables.
3 Results and discussion
By the values of coefficient of variation of separate geometric sizes of coffee beans, a hypothesis about their normal distribution (Gaussian distribution) was proposed.
The differential functions of the normal distribution
of l, b and h for the coffee beans of the Arabica variety
were as follows:
2 2
( 9.25) 2 0.458
1 ( )
0.458 2
l
f l e
π
⎡ − ⎤ −⎢ ⎥
⋅
⎢ ⎥
⎣ ⎦
= (8)
2 2
( 7)
2 0.135
1 ( )
0.135 2
b
f b e
π
⎡ − ⎤ −⎢ ⎥
⋅ ⎢ ⎥ ⎣ ⎦
= (9)
2 2
( 3.6)
2 0.108
1 ( )
0.108 2
h
f h e
π
⎡ − ⎤ −⎢ ⎥
⋅
⎢ ⎥
⎣ ⎦
= (10)
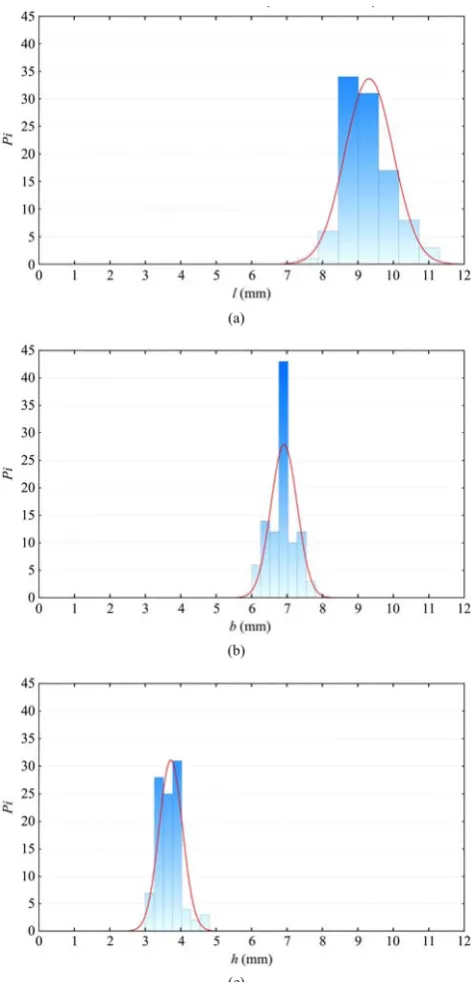
Figure 3 showed histograms and density functions for
the l, b and h of coffee beans.
(a)
(b)
(c)
Figure 3 Histograms and density functions of probability distribution of geometric sizes of coffee beans of the Arabica
variety
Parameters of the normal distribution of the geometrical sizes (length, width and thickness) of coffee beans of the Arabica and Robusta variety were given in Table 1.
The values of the correlation coefficients between the separate dimensions of beans of the studied varieties of coffee were given in Table 2.
Since the values of the correlation coefficient between
that indicates a steady correlation between these sizes according to Cheddok scale. Consequently, such correlation must be taken into account in the model of a two-dimensional normal distribution of beans sizes.
Table 1 Parameters of normal distribution of geometric sizes of coffee beans
Parameters Culture, variety Dimensions of seed
M[x] (mm) σ[x] (mm) Length l (mm) 9.25 0.6767 Width b (mm) 7.0 0.3671 Coffee beans
Arabica variety
Thickness h (mm) 3.6 0.3289 Length l (mm) 10.55 1.0438 Width b (mm) 8.0 0.6304 Coffee beans
Robusta variety
Thickness h (mm) 4.6 0.542
Table 2 The values of the coefficients of correlation between
the separate dimensions of the studied varieties of coffee beans
Correlation coefficients Culture, variety
Between length and width
Between width and thickness
Between length and thickness Coffee beans Arabica variety 0.379 0.147 0.262 Coffee beans Robusta variety 0.124 0.052 0.168
Thus, the two-dimensional normal distribution models of geometric dimensions of coffee beans of the Arabica variety were as follows:
( , )
f l b =
2 2
2 2 2
1 ( 9.25) ( 7) 9.25 7
2 0.379 0.458 0.135
2(1 0.379 ) 0.458 0.135
2
1
2 0.458 0.135 1 0.379
l b l b
e
π
⎡ ⎤
− − + − − ⋅ − ⋅ −
⎢ ⎥
− ⎢⎣ ⎥⎦
⋅ −
(11) ( , )
f l h =
2 2
2 2 2
1 ( 9.25) ( 3.6) 2 0.262 9.25 3.6
0.458 0.108
2(1 0.262 ) 0.458 0.108
2
1
2 0.458 0.108 1 0.262
l h l h
e
π
⎡ ⎤
− ⎢ − + − − ⋅ − ⋅ − ⎥
− ⎢⎣ ⎥⎦
⋅ −
(12) ( , )
f b h =
2 2
2 2 2
1 ( 7) 3.6 2 0.147 7 3.6
0.135 0.108
2(1 0.147 ) 0.135 0.108
2
1
2 0.135 0.108 1 0.147
b b h
e
π
⎡ ⎤
− − + − ⋅ − ⋅ −
⎢ ⎥
− ⎢⎣ ⎥⎦
⋅ −
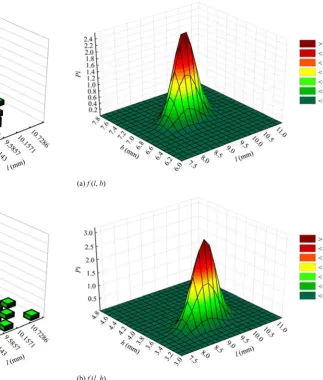
(13) The models of two-dimensional normal distribution of the geometric sizes of coffee beans of the Arabica variety as dependent random variables was presented on Figure 4.
(a) f (l, b)
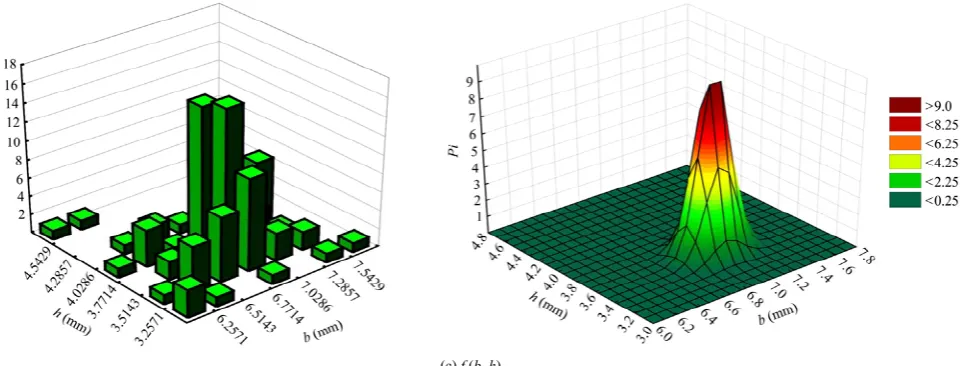
(c) f (b, h)
Figure 4 Histograms and density functions of probability distribution of geometric sizes of coffee beans of the Arabica variety as dependent random variables
The lines of levels of two-dimensional distribution of
l and b of coffee beans of the Arabica variety as
dependent random variables is shown on Figure 5. It can be seen that largest density of two-dimensional distribution
to be in evidence for b≈ 7.0 mm and l≈ 9.2 mm.
Figure 5 The lines of levels of density functions of two-dimensional probability distribution of l and b of coffee beans
of the Arabica variety as dependent random variables
The values of sums of squared deviations between experimental and theoretical frequency of occurrences, which has been calculated according to two-dimensional distributions of geometric sizes of the studied varieties of coffee beans, respectively, both independent and dependent random variables were given in Table 3.
The obtained SSD values indicated that mathematical models of geometric sizes of beans as density functions of the normal distribution of two-dimensional normal distribution of the geometric sizes of studied cereal crops
beans as dependent random variables provide a higher accuracy of approaching empirical data.
Table 3 The values of sums of squared deviations between experimental and theoretical frequency of occurrences in
approximation of geometric sizes distributions
SSD of approximation of geometric sizes distributions
Length and width Width and thickness
Length and thickness Culture,
variety
1 2 1 2 1 2
Coffee beans of the
Arabica variety 762.66 1391.96 2373.06 3857.85 2032.04 2652.32 Coffee beans of the
Robusta variety 206.21 766.4 867.87 1795.94 496.99 802.73 Note: 1 – as independent random variables; 2 – as dependent random variables.
4 Conclusion
References
El-Gendy, H. A., A. I. Elrayes, and S. F. Abdel-Hammed. 2011. Engineering properties of some Arabian coffee varieties.
Egyptian Journal of Agricultural Research, 89(2): 615–625. Gürsoy, S., and E. Güzel. 2010. Determination of physical
properties of some agricultural grains. Research Journal of Applied Sciences, Engineering Technology, 2(5): 492–498. Karaj, S., and J. Müller. 2010. Determination of physical,
mechanical and chemical properties of seeds and kernels of
Jatropha curcas L. Industrial Crops and Products, 32(2):
129–138.
Karimi, M., K. Kheiralipour, A. Tabatabaeefar, G. M., Khoubakht, M. Naderi, and K. Heidarbeigi. 2009. The effect of moisture content on physical properties of wheat. Pakistan Journal of Nutrition, 8(1): 90–95.
Karimi, N., A. Arabhosseini, M. H. Kianmehr, and J. Khazaei. 2011. Modelling of raisin berries by some physical and statistical characteristics. International Agrophysics, 25: 141–147.
Kuzminskyj, R., O. Sokolovskyj, and R. Sheremeta. 2014. Modeling geometrical parameters of seed crops using multidimensional distributions. In The role of science in improving the technological level and efficiency of the agro industrial complex of Ukraine: Theses International Science-Practice Conference, 91–94. Ternopil, 15-16 May. Mansouri, A., A. H. Mirzabe, and A. Ráufi. 2015. Physical
properties and mathematical modeling of melon (Cucumis Melo L.) seeds and kernels. Journal of the Saudi Society of Agricultural Sciences, 16(3): 218–226.
Milani, E., M. Seyed, A. Razavi, A. Koocheki, V. Nikzadeh, N. Vahedi, M. Moein Fard, and A. Gholamhossein Pour. 2007. Moisture dependent physical properties of cucurbit seeds.
International Agrophysics, 21(2): 157–168.
Mirzabe, A. H., J. Khazaei, G. R. Chegini, and O. Gholami. 2013. Some physical properties of almond nut and kernel and modeling dimensional properties. Agricultural Engineering International: CIGR Journal, 15(2): 256–265.
Müller, M., Š. Horníčková, P. Hrabě, and J. Mařík. 2015. Analysis of physical, mechanical and chemical properties of seeds and kernels of Jatropha curcas. Research in Agricultural Engineering, 61(3): 99–105.
Niveditha, V. R., K. R. Sridhar, and D. Balasubramanian. 2013. Physical and mechanical properties of seeds and kernels of
Canavalia of coastal sand dunes. International Food Research Journal, 20(4): 1547–1554.
Olukunle, O. J., and B. O. Akinnuli. 2012. Investigating some engineering properties of coffee seeds and beans. Journal of Emerging Trends in Engineering and Applied Sciences
(JETEAS), 3(5): 743–747.
Sánchez-Mendoza, J., A. Dominguez-Lopez, S. Navarro-Galindo, and J. A. Lopez-Sandoval. 2008. Some physical properties of roselle (Hibiscus sabdariffa L.) seeds as a function of moisture content. Journal of Food Engineering, 87(3): 391–397.
Severa, L., J. Buchar, and Š. Nedomová. 2012. Shape and size variability of roasted Arabica coffee beans. International Journal of Food Properties, 15(2): 426–437.
Sokolovskyj, O., R. Kuzminskyj, and R. Sheremeta. 2012. Effect of relative humidity on the geometrical parameters of the seeds of wheat and rye. Motrol - Commission of Motorization and Energetics in Agriculture, 14(4): 64–70.