PRIMARY RESEARCH
Identification and validation of m
6
A RNA
methylation regulators with clinical prognostic
value in Papillary thyroid cancer
Xinyi Wang
1†, Xiaorui Fu
1†, Junjia Zhang
2, Chengfeng Xiong
3, Shuyong Zhang
3and Yunxia Lv
3*Abstract
Background: Papillary thyroid cancer (PTC) is a type of malignant tumor with excellent prognosis, accounting for more than 80% of thyroid cancer. Recently, numerous studies illustrated the importance of N6-methyladenosine (m6A)
RNA modification to tumorigenesis, but it has never been reported in PTC.
Methods: We downloaded data from The Cancer Genome Atlas (TCGA) and analyzed RNA expression, single nucleo-tide polymorphisms (SNPs) and copy number variations (CNVs) of 19 m6A RNA methylation regulators in PTC. Then
we used nonnegative matrix factorization (NMF) to cluster patients into two m6A subtypes and compared them in
overall survival (OS) and disease-free survival (DFS). The Weighted correlation network analysis (WGCNA) and univari-ate Cox proportional hazard model (CoxPH) were used to select genes for the construction of a m6A-related signature.
The accuracy and prognostic value of this signature were validated by using receiver operating characteristic (ROC) curves, K-M (Kaplan–Meier) survival analysis, univariant and multivariant analyses.
Results: CNVs and differential expression of m6A regulators were observed in PTC patients. Especially IGF2BP2
(Insulin-like growth factor 2 mRNA binding protein 2), which was most significantly overexpressed in tumor tissue. We chose 4 genes in the m6A-related module from WGCNA: IGF2BP2, STT3A, MTHFD1 and GSTM4, and used them to
construct a m6A-related signature. The prognostic value of this signature was validated, and risk scores provided by
the signature was the independent prognostic factor for PTC. A nomogram was also provided for clinical usage.
Conclusions: We performed a comprehensive evaluation of the m6A RNA modification landscape of PTC and
explored its underlying mechanisms. Our m6A-related signature was of great significance in predicting the DFS of
patients with PTC. And IGF2BP2 was a gene worthy for further analysis as its strong correlation with DFS and clinical phenotypes of PTC.
Keywords: Papillary thyroid cancer, m6A, RNA methylation, TCGA , IGF2BP2
© The Author(s) 2020. This article is licensed under a Creative Commons Attribution 4.0 International License, which permits use, sharing, adaptation, distribution and reproduction in any medium or format, as long as you give appropriate credit to the original author(s) and the source, provide a link to the Creative Commons licence, and indicate if changes were made. The images or other third party material in this article are included in the article’s Creative Commons licence, unless indicated otherwise in a credit line to the material. If material is not included in the article’s Creative Commons licence and your intended use is not permitted by statutory regulation or exceeds the permitted use, you will need to obtain permission directly from the copyright holder. To view a copy of this licence, visit http://creat iveco mmons .org/licen ses/by/4.0/. The Creative Commons Public Domain Dedication waiver (http://creat iveco mmons .org/publi cdoma in/ zero/1.0/) applies to the data made available in this article, unless otherwise stated in a credit line to the data.
Background
Thyroid cancer is one of malignant tumors whose inci-dence are rapidly increasing in the world for both men and women. It can be classified into several subtypes:
PTC, follicular thyroid cancer (FTC) and medullary
thy-roid cancer (MTC) [1]. PTC is the most common type of
thyroid cancer, accounting for more than 80% of all cases. Generally, prognosis of patients with PTC is excellent,
with 5-year-survival rate over 97% [2]. The 10-year and
15-year survival rates of papillary microcarcinoma, PTC which is smaller than 1 cm, are even over 99% [3]. In pre-vious studies, lymph node metastasis has been proved to increase the risk of local recurrence without influencing
survival in PTC [4]. Wada et al. indicated that patients
Open Access
*Correspondence: [email protected]
†Xinyi Wang and Xiaorui Fu contributed equally to this work 3 Department of Thyroid Surgery, The Second Affiliated Hospital
Page 2 of 13 Wang et al. Cancer Cell Int (2020) 20:203
without lymph node metastasis has nearly no chance of recurrence, while the recurrence rate of patients with lymph node metastasis is over 16% [5]. As a result, it is of greater significance to explore prognostic factors for DFS than OS.
Generally, DNA and histone protein are considered to be essential participants of reversible epigenetic modi-fication which can regulate gene expression in mammal
cells [6]. In recent years, reversible RNA modification,
especially methylation, has been demonstrated to be another important component of gene expression
regula-tion. The m6A RNA methylation, which was discovered
in the 1970s, was the first example of reversible RNA methylation and wildly distributed in long non-coding
RNAs and polyadenylated mRNAs [7, 8]. m6A has been
observed within introns, internal exons, 3ʹ untranslated
regions (3ʹUTRs) and stop codons, suggesting its
addi-tion can be earlier or simultaneous with RNA splicing [9,
10]. There are 3 types of m6A RNA methylation
regula-tors: methyltransferases (writers), RNA binding pro-teins (readers), and demethylases (erasers). Writers are composed of METTL3, METTL14, METTL16, RBM15, RBM15B, WTAP and KIAA1429. Readers are comprised of YTHDC1/2, YTHDF1/2/3, IGF2BP1/2/3, HNRN-PA2B1 and HNRNPC. FTO and ALKBH5 serve as
eras-ers which perform demethylation activity [11].
Numerous studies showed that m6A RNA
methyla-tion played a role in the occurrence and progression of multiple malignant tumors, including hepatocellular carcinoma, colorectal carcinoma, breast cancer,
glio-blastoma and clear cell renal cell carcinoma [12–15].
Yongsheng li et al. have concluded the characteristics
of m6A RNA methylation across 33 types of cancer and
predicted that the mechanism of m6A RNA
modifica-tion might be related with the activamodifica-tion or depression of some oncogenic pathways such as PI3K-AKT-mTOR signaling, G2M checkpoint, KRAS and P53 pathways
[16]. METTL3 and IGF2BP2 have been proved to be
over-expressed in colorectal carcinoma and promote
the progression of cancer [17]. The RNA transcripts of
SOX2 were methylated by METTL3 and bonded with IGF2BP2, resulting in regulation of SOX2 degradation. Yunhao Chen et al. demonstrated that WTAP can lead to post-transcriptional suppression of its downstream effec-tor, ETS proto-oncogene1 (ETS1), and further contrib-ute to the proliferation of hepatocellular carcinoma [18]. However, there has been no research which specifically
explored the landscape of m6A RNA methylation and its
relationship with DFS in PTC. In addition to expression
levels of m6A RNA methylation regulators, SNPs and
CNVs may also have prognostic value for PTC.
In this study, we performed a comprehensive
evalua-tion of the landscape of m6A RNA methylation in PTC
and explored its underlying mechanisms. The expres-sion level, CNVs, SNPs and correlated clinical
pheno-types of m6A RNA methylation regulators were analyzed
to confirm the significance of m6A modification in PTC.
By applying NMF, we divided patients from the TCGA cohort into two clusters (cluster1 and cluster 2)
accord-ing to the expression of 19 m6A RNA methylation
regu-lators and validated their differences in OS and DFS. In order to screen out essential genes for constructing a
m6A-related signature, we performed WGCNA,
univari-ant and multivariunivari-ant analyses. Finally, we validated the accuracy and explored the underlying mechanism of the m6A-related signature by a series of analyses to illustrate
its prognostic value.
Methods
Data download
The transcriptome data, somatic mutation data and clini-cal information of PTC patients were obtained from the
TCGA database via the GDC data portal (https ://porta
l.gdc.cance r.gov/repos itory ). We downloaded RNA-seq (level 3, HTSeq-FPKM data) of 493 PTC patients (493 primary tumor tissue and 58 solid normal tissue) with complete clinical information from the TCGA data-base. For SNP, we downloaded “Masked Somatic Muta-tion” subtype of somatic mutation data and used the VarScan software to process it. We used a R package
called “maftools” [19] to analyze and visualize the
Muta-tion AnnotaMuta-tion Format (MAF) of somatic variants. For CNV, the loss and gain of copy-number have been iden-tified using segmentation analysis and GISTIC2.0 algo-rithm. The microarray data of papillary thyroid cancer
patients was downloaded from GSE58545 (normal = 18,
PTC = 27) datasets in the Gene Expression Omnibus
(GEO) database. Oncomine database (http://www.oncom
ine.org) was used to validated mRNA levels of m6A
regu-lators in PTC. Human Protein Atlas (http://www.prote
inatl as.org) was used to validate expression levels of m6A
RNA methylation regulators by immunohistochemistry
[20]. A list of antibodies which were used in IHC
sam-ples were provided in Additional file 1: Table S1. We used Genotype-tissue expression (GTEx) dataset to compare
expression levels of m6A regulators among different
tis-sues and genders.
Non‑negative matrix factorization consensus clustering
To investigate the relationship between the expression of
m6A regulators and clinical phenotypes in PTC, we
clus-tered PTC samples from TCGA into 2 different clusters (cluster 1 and cluster 2) using NMF. The purpose of NMF was to identify potential characteristics in gene expres-sion profiles by resolving the original matrix into two
performed, and its result was aggregated to acquire con-sensus clustering of PTC samples. The most suitable number of subtypes was decided according to cophe-netic, dispersion and silhouette coefficients. NMF was
performed by a R package called “NMF” [22]. The
num-ber of clusters k was chosen as 2, and the number of runs was set at 200. We also used a R package called “survival” to compare the OS and DFS between cluster 1 and clus-ter 2.
Construction of co‑expression module networks
The WGCNA was performed to establish the gene co-expression network to find trait-related modules by the R
package “WGCNA” [23]. All genes and samples were
fil-tered by good genes or good samples test. Filfil-tered genes were used to construct a scale-free network by
calculat-ing the connection strength between genes. Scale-free R2
ranging from 0 to 1 was used to determine a scale-free topology model. To minimize effects of noise and spuri-ous associations, the adjacency matrix was transformed into Topological Overlap Matrix (TOM). And TOM-based dissimilarity was used to form modules by dynamic tree cut. Here, we set minimal module size as 50 and cut height as 0.25. We used the KOBAS database to exert Kyoto Encyclopedia of Genes (KEGG) pathway
enrich-ment and gene ontology (GO) analysis of the m6A-related
module in WGCNA. When the P value was less than 0.05, the enriched pathway was considered to be statisti-cally significant.
Construction of the m6A‑related risk signature
The patients with PTC from TCGA were randomly
divided into a training set (N = 241) and a testing set
(N = 240) using a R package called “caret”. For the train-ing set, the univariate CoxPH was used to identify genes whose expression levels were statistically correlated
with DFS, among all genes in the m6A-related module
(P < 0.05). The m6A-related risk signature gave patients
in training and testing sets risk scores based on genes weighted value which was calculated by a linear combi-nation of Cox coefficient and gene expression:
And patients were classified into low-risk and high-risk group according to the median of risk scores.
Validation of the m6A‑related signature for colon cancer
The Chi square test was performed to confirm that there was no selection bias in classification of training and testing set. The univariate and multivariate
analy-ses were conducted for both the m6A-related signature
Risk score= N
i=0
(Expi * Coei).
and clinical factors. The Kaplan–Meier (K–M) survival curves and log-rank test were generated to evaluate the
difference in DFS between high‐risk group and low‐risk
group in total TCGA PTC cohort, training set and test-ing set. We performed ROC curves to measure the prog-nostic capacity of our signature using a R package called “survivalROC”. A nomogram was used to predict cancer prognosis. In the TCGA datasets, all genes in the sig-nature were included to generate the nomogram which can investigate the chancer of 1-, 3- and 5-year DFS of patients with PTC.
Statistical analysis
We exerted Mann–Whitney U tests to compare the expression levels of m6A RNA methylation regulators in different subgroups (normal tissues/primary tumor tis-sue, cluster1/cluster2). Chi square test was performed to confirm the difference in CNVs between normal and tumor tissues. Chi square test was also used to analyze the difference in clinical phenotypes between cluster 1 and cluster 2, as well as high-risk group and low-risk
group. The relationships between m6A regulators and
other genes in the m6A-related module were analyzed by
calculating the Spearman correlation coefficients.
Results
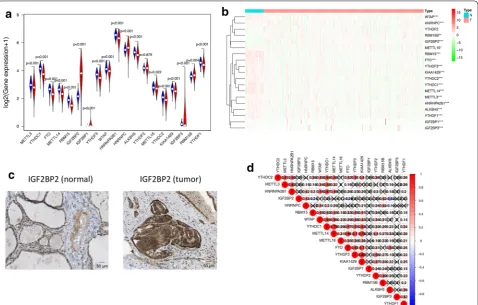
m6A RNA methylation regulators had different expression level in PTC and normal tissues
Using transcriptome data from TCGA database, we
ana-lyzed the mRNA levels of 19 m6A regulators in PTC and
para-tumor normal tissues (Fig. 1a, b, Additional file 2:
Table S2). Except YTHDF2, 18 of 19 m6A regulators were
differentially expressed in PTC and normal thyroid tis-sues. METTL3, YTHDC1, FTO, METTL14, RBM15, YTHDF3, WTAP, HNRNPA2B1, ALKBH5, METTL16, YTHDC2, KIAA1429, IGF2BP3, RBM15B and YTHDF1 had lower expression levels in tumor tissues, while IGF2BP2, IGF2BP1 and HNRNPC had higher expres-sion level in tumor tissues. Among all of these genes, only IGF2BP2 had significantly higher expression pattern and distinguishable protein expression in tumor tissue com-pared to normal tissue (Fig. 1c). We also validated these results in the GEO database (Additional file 3: Table S3)
and found 14 differentially expressed m6A RNA
meth-ylation regulators with 10 of them was the same as the analysis of TCGA. The expression of these genes was also further validated in the Oncomine database
(Addi-tional file 4: Figure S1) and Human Protein Atlas
data-base (Fig. 1c and Additional file 5: Figure S2). Then we
explored the relationships between 19 m6A RNA
meth-ylation regulators by Spearman correlation analysis
(Fig. 1d). The relationships between each two of them
Page 4 of 13 Wang et al. Cancer Cell Int (2020) 20:203
KIAA1429 were most relevant (Cor = 0.82). However,
there were also some genes which were negatively
corre-lated, such as IGF2BP2 and ALKBH5 (Cor = − 0.43).
CNVs and SNPs of m6A RNA methylation regulators can serve as prognostic factors for PTC
Among the 505 cases, CNVs of the 13 m6A RNA
meth-ylation regulators were frequently observed (Fig. 2a).
In detail, two m6A “reader” genes HNRNPA2B1 and IGF2BP3 had the highest frequency of CNV events (2.04%, 2.04%) followed by YTHDC2 (1.63%) and METTl16 (1.22%). We performed Chi square test to ana-lyze the difference in CNVs between normal tissues and
PTC tissues, and found HNRNPA2B1 (P = 0.004235),
IGF2BP3 (P = 0.004235) and METTL16 (P = 0.0040631)
were of statistical significance (Additional file 6:
Table S4). The chromosome position of HNRNPA2B1,
IGF2BP3 and METTL16 were shown in Fig. 2b.
Fur-thermore, we evaluated the correlation between the
copy number and mRNA level of 19 m6A regulators, and
found higher copy number of 4 genes were corresponded
with higher expression level: ALKBH5 (P = 0.001),
METTL16 (P = 2.287e−04), WTAP (P = 0.003) and
YTHDF1 (P = 0.009) (Fig. 2d–g). SNPs of YTHDC1,
RBM15, METTL14, HNRNPC, HNRNPA2B1 and FTO
were found merely in 7 independent samples (Fig. 2c).
CNVs and SNPs may influence the expression level and biological function of m6A RNA methylation regulators, and further effected the activities of RNA modification.
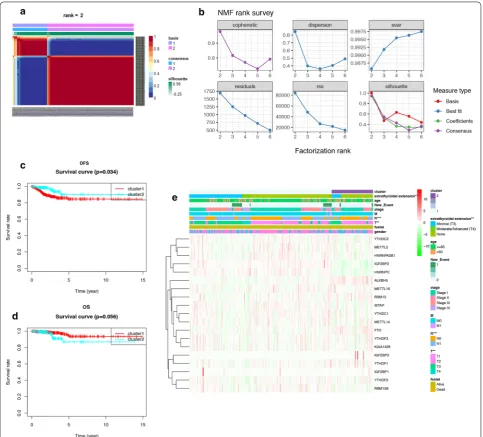
Two m6A subgroups were different in clinical phenotypes and DFS
The total TCGA cohort were clustered into 2 subgroups
(cluster 1: n = 352 and cluster 2: n = 141) by applying
NMF (Fig. 3a, b), according to expression levels of 19
m6A regulators in PTC samples. To better understand
the clustering result and its relationships with survival outcomes and clinical phenotypes, we compared the OS and DFS between cluster 1 and cluster 2 and found clus-ter 2 had betclus-ter DFS than clusclus-ter 1 (P = 0.034, Fig. 3c).
Fig. 1 The overview of m6A RNA methylation regulators in PTC. a A Vioplot which visualized the differentially expressed m6A regulators in
PTC (blue represents normal tissues and red represents tumor tissues). b The mRNA levels of 19 m6A regulators in PTC. Red means this gene is
up-regulated while green means this gene is down-regulated (*P < 0.05, **P < 0.01, ***P < 0.001). c The validation of IGF2BP2 expression level by immunohistochemical staining. The result showed that the expression level of IGF2BP2 was higher in PTC tissue than normal thyroid tissue. d
Spearman correlation analysis of the 19 m6A regulators in PTC. The “X” represents that the correlation between this pair of genes does not have
But there was no statistical difference between the OS of cluster 1 and cluster 2 (P = 0.056, Fig. 3d). These results
demonstrated that m6A RNA methylation may have
strong correlation with DFS of PTC patients. As shown in the heatmap, IGF2BP1, WTAP, FTO, IGF2BP3 and ALKBH5 had higher expression level in cluster 2, while IGF2BP2, RBM15B, HNRNPC were significantly down-regulated in cluster 2 (Fig. 3e, Additional file 7: Table S5). We also found these 2 clusters were different in extrathy-roidal extension (P < 0.01), T (P < 0.01) and N (P < 0.001)
classifications, suggesting m6A RNA methylation may
also related to clinical phenotypes and progression of PTC.
Detection of DFS‑related m6A regulator and its correlated module by WGANA
The univariant CoxPH was performed to identify m6A
RNA methylation regulators which were prognostic
factors for OS and DFS of patients with PTC (Table 1).
We found that FTO (HR = 1.57, P = 0.044), RBM15
(HR = 3.84, P = 0.012), YTHDF3 (HR = 1.29, P = 0.009)
and KIAA1429 (HR = 1.76, P = 0.042) were related with
the overall survival rate, while only IGF2BP2 (P = 0.0006) was related with the DFS of PTC patients. As we men-tioned before, the prognosis of PTC patient is excellent,
and the recurrence of tumor is one of the biggest chal-lenges at present. As a result, it is of greater value for us to study the mechanism of genes related to DFS of PTC patient. By WGCNA, we identified 22 co-expression modules and analyzed their association with 12 clini-cal phenotypes, including futime, fustat, TNM clas-sification, stage, age, gender, new-event, new-event time, extrathyroidal extension and IGF2BP2 expression
(High-expression and Low-expression) (Fig. 4a–c,
Addi-tional file 8: Figure S3). Except the grey module which
contained non-clustering genes, the brown module was the most correlated module of IGF2BP2 expression (r = − 0.61, P = 7e−52). The brown module was also cor-related with futime (r = − 0.15, P = 0.001), T (r = − 0.19, P = 3e−05), N (r = − 0.35, P = 1e−15), stage (r = − 0.14, P = 0.002), new-event (r = − 0.11, P = 0.01), new-event time (r = − 0.11, P = 0.02), age (r = 0.11, P = 0.02) and
extrathyroidal extension (r = − 0.25, P = 3e−08). The
result of KEGG and GO analyses showed that the brown module was related to membrane-bounded organelle, multiple metabolic process, thyroid hormone synthesis
and HIF-1signaling pathway (Fig. 4d, e), especially
meta-bolic pathways in the central carbon metabolism, such as pyruvate metabolism, citrate cycle, propanoate metabo-lism and glycolysis/gluconeogenesis.
Fig. 2 CNVs and SNPs analysis of m6A regulators. a The percentage of patients with CNVs in 13 m6A regulators. b The chromosome location of
Page 6 of 13 Wang et al. Cancer Cell Int (2020) 20:203
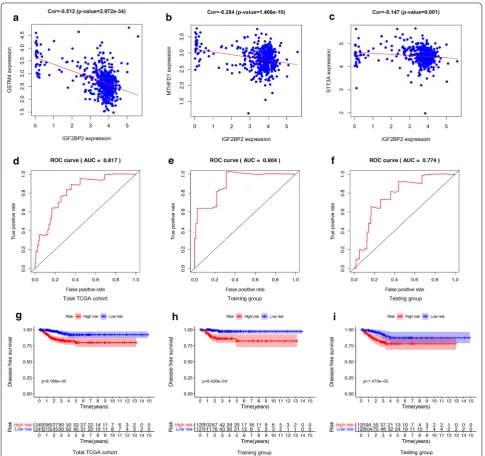
Construction and verification of the m6A‑related risk signature
We randomly divided patients in the total TCGA cohort into training set and testing set. Then another univariant CoxPH was performed in the training set to filter genes which were related to DFS of PTC, among 796 genes in
the brown module (Additional file 9: Table S6). We
iden-tified 4 genes: IGF2BP2 (HR = 1.19, P = 0.0002), STT3A
(HR = 0.89, P = 0.033), MTHFD1 (HR = 1.32, P = 0.044)
and GSTM4 (HR = 1.12, P = 0.049). The expression
lev-els of STT3A, MTHFD1 and GSTM4 were strongly
cor-related with IGF2BP2 (Fig. 5a–c). These 4 genes were
used to construct the m6A-related risk signature via
mul-tivariate CoxPH regression model (Additional file 10:
Table S7). Risk scores of patients were calculated as follows:
Patients were divided into high-risk and low-risk groups with the median risk score used as the cut-off value. The ROC curve analysis in total TCGA PTC cohort (AUC = 0.817, Fig. 5d), training set (AUC = 0.904, Fig. 5e) and testing set (AUC = 0.774, Fig. 5f), reveal-ing promisreveal-ing prognosis value of the signature for PTC disease-free survival. The K–M survival curves were per-formed to illustrate the difference between the high-risk and low-risk groups in DFS: total TCGA PTC cohort (P = 8.166e−05, Fig. 5g), training set (P = 8.426e−04, Fig. 5h) and testing set (P = 1.473e−02, Fig. 5i). All of these analyses showed that patients in low-risk group had better prognosis than high-risk group and this
m6A-related signature was of strong accuracy in
predict-ing the DFS of patients with PTC. Univariant and
multi-variant CoxPH showed that T classification (HR = 1.691,
P = 0.003), stage (HR = 1.49, P = 0.003) and risk score (HR = 1.001, P = 0.047) were prognostic factors for PTC
(Fig. 6a), and only risk score was the independent
prog-nostic factor (HR = 1.001, P = 0.04, Fig. 6b). Furthermore, a prognostic nomogram was constructed to predict DFS
Risk score =(0.390×MTHFD1)+(0.167×IGF2BP2)
+(0.152×GSTM4)+(−0.133×STT3A)
of individual patients with PTC (Fig. 6c). In Fig. 6d, we assessed whether there was statistical difference in clini-cal phenotypes between high-risk and low-risk groups
by Chi square test. The heatmap indicated that high‐risk
group was corresponded to advanced stage, higher level of T and N classifications, new tumor event and extrathy-roidal extension in total TCGA PTC cohort. Finally, to better understand the expression of IGF2BP2 in human tissues, we used GTEx dataset to explore the landscape of IGF2BP2 in different genders and organs. The expres-sion patterns of IGF2BP2 were similar in most organs of female and male, but were significantly different in blood vessel, brain, breast, skeletal muscle, skin and stomach (Fig. 7a–c). The tissue-specificity of IGF2BP2 is of great value to explore as it can provide clues for therapy and diagnosis. IGF2BP2 had high expression level in bone marrow and low expression level in brain, liver and skel-etal muscle. These organs and malignant tumor origi-nated from them can become potential objects of study (Fig. 7d).
Discussion
Over past decades, the occurrence of PTC has been proved to be correlated with external radiation expo-sure, dietary iodine content and resultant disturbance Table 1 Univariant CoxPH analysis of OS and DFS
Italic values are statistically significant uniCox analysis
Gene Survival analysis Disease free analysis
HR HR.95L HR.95H P‑value HR HR.95L HR.95H P‑value
METTL3 0.973958 0.742174 1.278129 0.849081 0.981439 0.836601 1.151353 0.818114
YTHDC1 1.036531 0.852548 1.26022 0.718934 0.977604 0.873975 1.093522 0.691972
FTO 1.573325 1.012161 2.44561 0.044044 0.78099 0.577311 1.056529 0.108867
METTL14 1.25211 0.688421 2.277356 0.461329 0.977691 0.685448 1.394532 0.900902
RBM15 3.843867 1.338806 11.03619 0.012343 0.858734 0.388698 1.897167 0.70649
IGF2BP2 0.919768 0.8431 1.003408 0.059652 1.097637 1.040737 1.157648 0.000603
IGF2BP1 4.527263 0.510412 40.156 0.175085 0.183686 0.000123 274.5852 0.649576
YTHDF3 1.290726 1.065857 1.563037 0.008975 0.999697 0.891851 1.120584 0.995846
WTAP 0.994085 0.811996 1.217007 0.954173 0.916739 0.821487 1.023036 0.120403
HNRNPA2B1 0.991969 0.959783 1.025234 0.631828 0.983031 0.963915 1.002526 0.0876
HNRNPC 0.975073 0.928021 1.024511 0.317143 1.020512 0.987934 1.054164 0.219977
ALKBH5 1.04919 0.991575 1.110154 0.095643 0.957849 0.913425 1.004433 0.075499
YTHDF2 1.088042 0.895735 1.321636 0.395142 0.939033 0.833287 1.058199 0.302091
METTL16 1.021759 0.712861 1.464507 0.906707 1.001206 0.802832 1.248598 0.991461
YTHDC2 1.812616 0.943702 3.481584 0.074104 1.020589 0.686415 1.517452 0.919788
KIAA1429 1.756042 1.020936 3.020446 0.041867 1.065358 0.779387 1.456256 0.691363
IGF2BP3 1.097294 0.926038 1.30022 0.283528 0.155158 0.002606 9.23819 0.371512
RBM15B 1.024573 0.807027 1.300762 0.841987 1.077647 0.933178 1.244482 0.30856
Page 8 of 13 Wang et al. Cancer Cell Int (2020) 20:203
of thyroid stimulating hormone (TSH) level [24].
Nowadays, increasing investigations begin to focus on acquired genetic changes that can distinguish PTC from para-tumor normal tissue, which has greatly expanded our knowledge of the molecular pathogenesis of PTC. Several biomarkers have been used in clinic, such as RET/PTC rearrangement, PAX8-PPARγ
rearrange-ment, BRAF and RAS mutations [25–27]. As a
prom-ising field of cancer biology, m6A RNA modification
has been verified to participant in developing several types of malignant tumor. However, there has been no
research which explore the role and mechanism of m6A
RNA modification in the progression of PTC. Here,
we discovered some m6A RNA methylation regulators
whose expression level, CNVs and SNPs were strongly correlated with PTC, including IGF2BP2, HNRNPA2B1 and IGF2BP3. They are all “readers” which can selec-tively bind to and change the secondary structures of
m6A-containing RNAs. This process results in
regu-lated degradation of targeted RNAs and can be revers-ibly tuned via m6A methylation and demethylation [28].
Readers may also affect RNA splicing, storage,
traffick-ing and translation [29]. Overexpression of IGF2BP2
has been indicated to be related to poor survival of
Fig. 4 Detection and validation of m6A-related module by WGCNA. a Heatmap of the correlation between gene modules and the clinical
patients with colorectal cancer, acute myelocytic leu-kemia and metaplastic breast cancer [30, 31]. Recently, K.Wang et al. demonstrated that the progression of thyroid carcinoma can be promoted by METTL3 and IGF2BP2 through m6A methylation on TCF1 mRNA and activation of Wnt signaling pathway in thyroid
can-cer [32]. The relationship between IGF2BP2 and PI3K/
Akt signaling pathway has been discussed, suggesting up-regulated IGF2BP2 in pancreatic cancer plays a role
in cell proliferation [33]. In addition, SNPs of IGF2BP2
and IGF2BP3 has been proved to promote the lymph node metastasis of esophagogastric junction
adenocar-cinoma [34]. In our GO and KEGG analysis, we noticed
that IGF2BP2-related module was correlated with cen-tral carbon metabolism, thyroid hormone synthesis and HIF-1signaling pathway, which provided some
poten-tial regulatory metabolism of m6A RNA modification.
In addition to thyroid gland, IGF2BP2 also showed high expression level in lung, small intestine and bone mar-row, but the expression of IGF2BP2 did not have great
Fig. 5 Construction and validation of m6A-related signature. a–c The Pearson correlation coefficients between IGF2BP2 and each gene in the
Page 10 of 13 Wang et al. Cancer Cell Int (2020) 20:203
difference between male and female. The next step is to analyze the expression pattern of IGF2BP2 in other organs and explore the potential relationship between IGF2BP2 and regulatory singling pathways, such as HIF-1 signaling pathway.
Furthermore, we explored and validated the
prognos-tic value of m6A RNA methylation regulators in PTC.
Although FTO, RBM15, YTHDF3, and KIAA1429 were correlated with OS of PTC, we chose IGF2BP2 for deeper analysis as it is the only gene which was correlated with DFS of PTC. We used WGCNA, univariant and mul-tivariant CoxPH to select candidate genes (IGF2BP2, STT3A, MTHFD1 and GSTM4) for construction of a
m6A-related signature. With the exception of IGF2BP2,
other three genes were down-regulated in PTC, and their roles in tumorigenesis have been reported in previ-ous researches. It is well-known that STT3A acts as an enzyme which catalyzes PD-L1 glycosylation and main-tain PD-L1 stability, resulting in killing T cells [35]. As a result, low expression level of STT3A can support the
immune activity in thyroid cancer tissue, which increases inflammatory mediators, cytokines, chemokines, reactive oxygen species in the tumor immune microenvironment and promotes tumor progression. MTHFD1 and GSTM4 are enzymes of folate metabolism and glutathione metab-olism, and both of them have been reported to be related
to immunodeficiency and tumor [36, 37]. After K-M
plot, ROC curve, univariant and multivariant analyses, this signature showed its great value in predicting DFS of patients with PTC. The result was validated in dif-ferent cohort (total TCGA cohort, training set and test-ing set) to ensure the accuracy. We can also notice that risk scores were correlated with T and N classifications, new tumor event and extrathyroidal extension of PTC. These clinical phenotypes were considered to indicators of recurrence and lymph node metastasis, both of which were regarded as determinants of DFS and particularly contribute to the exacerbation of PTC. We also provided
a nomogram that reduce the m6A-related signature into
a single numerical estimate of the probability of an event,
such as death, 1-, 3-, 5-year DFS and recurrence, predict-ing the prognosis of every individual patient. For further study, we prepare to evaluate the clinical prognostic value of this signature by applying to patients who are not lim-ited to internet databases. To deeply explore the
mecha-nism of m6A modification, cell and animal experiments
are urgently needed to search for downstream target of
m6A RNA methylation regulators.
Conclusions
In this study, we performed a comprehensive
evalua-tion of the landscape of m6A RNA methylation in PTC
by analyzing the RNA expression level, CNVs, SNPs and
correlated clinical phenotypes of 19 m6A RNA
meth-ylation regulators. In NMF clustering analysis, we found that cluster1 and cluster 2 were significantly different in DFS, stage and age, suggesting the important role of
m6A modification in PTC. After WGCNA, univariant
and multivariant CoxPH, IGF2BP2, STT3A, MTHFD1
and GSTM4 were used as candidates for construction of
a m6A-related signature. This signature was capable to
predict the DFS of Patients in different cohort and served as an independent prognostic factor for PTC. It was also correlated with T and N classifications, new tumor event and extrathyroidal extension of PTC. To sum up, IGF2BP2 is a possible biomarker for diagnosis and
prog-nosis of PTC and our m6A-related signature is of great
significance in predicting DFS of PTC patients.
Supplementary information
Supplementary information accompanies this paper at https ://doi. org/10.1186/s1293 5-020-01283 -y.
Additional file 1: Table S1. The list of antibodies in the Human Protein
Atlas.
Additional file 2: Table S2. The Mann–Whitney test of differential
expressed m6A RNA methylation regulators in PTC.
Page 12 of 13 Wang et al. Cancer Cell Int (2020) 20:203
Additional file 3: Table S3. Validation of differential expressed m6A RNA
methylation regulators by GEO database.
Additional file 4: Figure S1. Validation of differential expressed m6A RNA
methylation regulators by Oncomine database.
Additional file 5: Figure S2. Validation of differential expressed m6A RNA
methylation regulators by IHC samples obtained from the Human protein atlas.
Additional file 6: Table S4. Using the Chi square test to compare CNVs of
m6A RNA methylation regulators in normal and tumor tissues.
Additional file 7: Table S5. The Mann–Whitney test of differential
expressed m6A RNA methylation regulators cluster 1 and cluster 2.
Additional file 8: Figure S3. The establishment of a gene co-expression
network. (A-B) Soft-thresholding power analysis was used to obtain the scale-free fit index of network topology. (C) The cluster was based on the transcriptome data from TCGA. The color intensity represents the clinical phenotypes (fustat, futime, TNM classification, stage, age, gender, new-event, new-event time and extrathyroidal extension and IGF2BP2).
Additional file 9: Table S6. Univariant CoxPH analysis of genes in the
m6A-related module from WGCNA.
Additional file 10: Table S7. The multivariate Cox coefficients of MTHFD1,
IGF2BP2, STT3A and GSTM4.
Abbreviations
PTC: Papillary thyroid cancer; m6A: N6-methyladenosine; SNP: Single
nucleo-tide polymorphism; CNV: Copy number variation; OS: Overall survival; DFS: Disease-free survival; WGCNA: Weighted correlation network analysis; CoxPH: Cox proportional hazard model; FTC: Follicular thyroid cancer; MTC: Medullary thyroid cancer; 3ʹUTRs: 3ʹ Untranslated regions; TSH: Thyroid stimulating hor-mone; TCGA : The Cancer Genome Atlas; GEO: Gene expression omnibus; MAF: Mutation annotation format; KEGG: Kyoto Encyclopedia of Genes and Gene Ontology; GO: Gene ontology; K-M: Kaplan–Meier; ROC: Receiver operating characteristic; IGF2BP2: Insulin-like growth factor 2 mRNA binding protein 2.
Acknowledgements Not applicable.
Authors’ contributions
YXL, XYW and XRF designed the study. XYW and JJZ collected the mRNA transcriptome data and clinical information from TCGA, GEO and GTEx. XRF and XYW performed analyses on TCGA data. YXL and CFX performed statisti-cal analyses. SYZ wrote the manuscript. YXL, XYW, XRF, JJZ, CFX and SYZ reviewed and revised the manuscript. All authors read and approved the final manuscript.
Funding
The work was supported by The National Natural Science Foundation of China (nos. 81660294, 81560397 and 81660403).
Availability of data and materials
Additional data not presented in the manuscript can be obtained by contact-ing the authors.
Ethics approval and consent to participant Not applicable.
Consent for publication Not applicable.
Competing interests
The authors declare that there are no conflicts of interest.
Author details
1 Queen Mary College, Medical Department, Nanchang University, Nanchang,
Jiangxi, People’s Republic of China. 2 Department of Breast and Endocrine
Surgical Oncology, Graduate School of Medicine, Tohoku University, Sendai, Miyagi 980-8574, Japan. 3 Department of Thyroid Surgery, The Second
Affiliated Hospital of Nanchang University, Nanchang, Jiangxi, People’s Repub-lic of China.
Received: 27 March 2020 Accepted: 22 May 2020
References
1. Cabanillas ME, McFadden DG, Durante C. Thyroid cancer. Lancet. 2016;388(10061):2783–95.
2. Kitahara CM, Schneider AB, Brenner AV. Thyroid cancer schottenfeld and fraumeni cancer epidemiology and prevention, vol. 1. Oxford: Oxford University Press; 2017. p. 278–94.
3. Schneider DF, Chen H. New developments in the diagnosis and treat-ment of thyroid cancer. CA Cancer J Clin. 2013;63(6):373–94. 4. Elisei R. Thyroid carcinoma. encyclopedia of endocrine diseases. New
York: Elsevier; 2018. p. 573–85.
5. Wada N, Sugino K, Mimura T, Nagahama M, Kitagawa W, Shibuya H, et al. Pediatric differentiated thyroid carcinoma in stage I: risk factor analysis for disease free survival. BMC Cancer. 2009;9(1):306.
6. Cedar H, Bergman Y. Linking DNA methylation and histone modification: patterns and paradigms. Nat Rev Genet. 2009;10(5):295–304.
7. Fu Y, Dominissini D, Rechavi G, He C. Gene expression regulation mediated through reversible m6A RNA methylation. Nat Rev Genet. 2014;15(5):293–306.
8. Bi Z, Liu Y, Zhao Y, Yao Y, Wu R, Liu Q, et al. A dynamic reversible RNA N 6-methyladenosine modification: current status and perspectives. J Cell Physiol. 2019;234(6):7948–56.
9. Meyer KD, Saletore Y, Zumbo P, Elemento O, Mason CE, Jaffrey SR. Com-prehensive analysis of mRNA methylation reveals enrichment in 3′ UTRs and near stop codons. Cell. 2012;149(7):1635–46.
10. Meyer KD, Patil DP, Zhou J, Zinoviev A, Skabkin MA, Elemento O, et al. 5′ UTR m6A promotes cap-independent translation. Cell. 2015;163(4):999–1010.
11. Meyer KD, Jaffrey SR. Rethinking m 6 a readers, writers, and erasers. Annu Rev Cell Dev Biol. 2017;33(1):319–42.
12. Niu Y, Lin Z, Wan A, Chen H, Liang H, Sun L, et al. RNA N6-methyladen-osine demethylase FTO promotes breast tumor progression through inhibiting BNIP3. Mol Cancer. 2019;18(1):46.
13. Cui Q, Shi H, Ye P, Li L, Qu Q, Sun G, et al. m 6 A RNA methylation regulates the self-renewal and tumorigenesis of glioblastoma stem cells. Cell Rep. 2017;18(11):2622–34.
14. Zhou J, Wang J, Hong B, Ma K, Xie H, Li L, et al. Gene signatures and prognostic values of m6A regulators in clear cell renal cell carcinoma— a retrospective study using TCGA database. Aging (Albany NY). 2019;11(6):1633–47.
15. Li Z, Li F, Peng Y, Fang J, Zhou J. Identification of three m6A-related mRNAs signature and risk score for the prognostication of hepatocellular carcinoma. Cancer Med. 2020;9(5):1877–89.
16. Li Y, Xiao J, Bai J, Tian Y, Qu Y, Chen X, et al. Molecular characterization and clinical relevance of m6A regulators across 33 cancer types. Mol Cancer. 2019;18(1):137.
17. Li T, Hu P-S, Zuo Z, Lin J-F, Li X, Wu Q-N, et al. METTL3 facilitates tumor progression via an m6A-IGF2BP2-dependent mechanism in colorectal carcinoma. Mol Cancer. 2019;18(1):112.
18. Chen Y, Peng C, Chen J, Chen D, Yang B, He B, et al. WTAP facilitates progression of hepatocellular carcinoma via m6A-HuR-dependent epige-netic silencing of ETS1. Mol Cancer. 2019;18(1):127.
19. Mayakonda A, Lin D-C, Assenov Y, Plass C, Koeffler HP. Maftools: efficient and comprehensive analysis of somatic variants in cancer. Genome Res. 2018;28(11):1747–56.
20. Asplund A, Edqvist PHD, Schwenk JM, Pontén F. Antibodies for profiling the human proteome-the human protein atlas as a resource for cancer research. Proteomics. 2012;12(13):2067–77.
21. Brunet J-P, Tamayo P, Golub TR, Mesirov JP. Metagenes and molecu-lar pattern discovery using matrix factorization. Proc Natl Acad Sci. 2004;101(12):4164–9.
•fast, convenient online submission
•
thorough peer review by experienced researchers in your field
• rapid publication on acceptance
• support for research data, including large and complex data types
•
gold Open Access which fosters wider collaboration and increased citations maximum visibility for your research: over 100M website views per year
•
At BMC, research is always in progress.
Learn more biomedcentral.com/submissions
Ready to submit your research? Choose BMC and benefit from:
23. Langfelder P, Horvath S. WGCNA: an R package for weighted correla-tion network analysis. BMC Bioinformatics. 2008;9(1):559. https ://doi.
org/10.1186/1471-2105-9-559.
24. Fiore E, Vitti P. Serum TSH and risk of papillary thyroid cancer in nodular thyroid disease. J Clin Endocrinol Metab. 2012;97(4):1134–45.
25. Zou M, Baitei EY, Alzahrani AS, BinHumaid FS, Alkhafaji D, Al-Rijjal RA, et al. Concomitant RAS, RET/PTC, or BRAF mutations in advanced stage of papillary thyroid carcinoma. Thyroid. 2014;24(8):1256–66.
26. Xing M. BRAF mutation in thyroid cancer. Endocr Relat Cancer. 2005;12(2):245–62.
27. Barbie DA, Tamayo P, Boehm JS, Kim SY, Moody SE, Dunn IF, et al. System-atic RNA interference reveals that oncogenic KRAS-driven cancers require TBK1. Nature. 2009;462(7269):108–12.
28. Zhao X, Cui L. Development and validation of a m6A RNA methylation regulators-based signature for predicting the prognosis of head and neck squamous cell carcinoma. Am J Cancer Res. 2019;9(10):2156–69. 29. Hong K. Emerging function of N6-methyladenosine in cancer (Review).
Oncol Lett. 2018;16(5):5519–24.
30. Liu G, Zhu T, Cui Y, Liu J, Liu J, Zhao Q, et al. Correlation between IGF2BP2 gene polymorphism and the risk of breast cancer in Chinese Han women. Biomed Pharmacother. 2015;69:297–300.
31. He X, Li W, Liang X, Zhu X, Zhang L, Huang Y, et al. IGF2BP2 overexpres-sion indicates poor survival in patients with acute myelocytic leukemia. Cell Physiol Biochem. 2018;51(4):1945–56.
32. Wang K, Jiang L, Zhang Y, Chen C. Progression of thyroid carcinoma is promoted by the m6A methyltransferase METTL3 through regulating m6A methylation on TCF1. Onco Targets Ther. 2020;13:1605–12.
33. Xu X, Yu Y, Zong K, Lv P, Gu Y. Up-regulation of IGF2BP2 by multiple mech-anisms in pancreatic cancer promotes cancer proliferation by activating the PI3K/Akt signaling pathway. J Exp Clin Cancer Res. 2019;38(1):497. 34. Chen S, Qiu H, Liu C, Wang Y, Tang W, Kang M. Relationship between
IGF2BP2 and IGFBP3 polymorphisms and susceptibility to non-small-cell lung cancer: a case–control study in Eastern Chinese Han population. Cancer Manag Res. 2018;10:2965–75.
35. Chan L-C, Li C-W, Xia W, Hsu J-M, Lee H-H, Cha J-H, et al. IL-6/JAK1 pathway drives PD-L1 Y112 phosphorylation to promote cancer immune evasion. J Clin Invest. 2019;129(8):3324–38.
36. Sdelci S, Rendeiro AF, Rathert P, You W, Lin JMG, Ringler A, et al. MTHFD1 interaction with BRD4 links folate metabolism to transcriptional regula-tion. Nat Genet. 2019;51(6):990–8.
37. Moyer AM, Sun Z, Batzler AJ, Li L, Schaid DJ, Yang P, et al. Glutathione pathway genetic polymorphisms and lung cancer survival after platinum-based chemotherapy. Cancer Epidemiol Biomarkers Prev. 2010;19(3):811–21.
Publisher’s Note