November 2012
PhD in Information and Communication Technologies – Telecommunication Area
Department of Information Engineering and Computer Science
University of Trento
PhD in Signal Processing and Telecommunication
Under the seal of the European University of Brittany
Department Image and Information Processing
Télécom Bretagne
Authorization in conjunction with the University of Rennes 1
Ecole Doctorale – MATISSE
I
NNOVATIVEM
ETHODS FOR THER
ECONSTRUCTION OFN
EWG
ENERATIONS
ATELLITER
EMOTES
ENSINGI
MAGESLuca Lorenzi
Examination Committee:
Prof. Farid Melgani, University of Trento (advisor)
Prof. Grégoire Mercier, Telecom Bretagne (advisor)
Prof. Jocelyn Chanussot, Grenoble Institute of Technology
"Queste erano le cose da fare, senza tralasciare quelle"
"These were the things to do, without neglecting those"
Mt 23
Abstract
Remote sensing satellites have demonstrated to be a helpful instrument. Indeed, satellite images have been successfully exploited to deal with several applications including environmental monitoring and prevention of natural disasters. In the last years, the increasing of the availability of very high spatial resolution (VHR) remote sensing images resulted in new potentially relevant applications related to land cover control and environmental management. In particular, optical sensors may suffer from the presence of clouds and/or of shadows. This involves the problem of missing data, which may result in an important problem especially in the case of VHR images.
In this thesis, new methodologies of detection and reconstruction of missing data region in VHR images are proposed and applied on areas contaminated by the presence of clouds and/or shadows. In particular, the proposed methodological contributions include: i) a multiresolution inpainting strategy to reconstruct cloud-contaminated images; ii) a new combination of radiometric information and spatial position information in two specific kernels to perform a better reconstruction of cloud-contaminated regions by adopting a support vector regression (SVR) method; iii) the exploitation of compressive sensing theory adopting three different strategies (orthogonal matching pursuit, basis pursuit and a genetic algorithm solution) for the reconstruction of cloud-contaminated images; iv) a complete processing chain which exploits a support vector machine (SVM) classification and morphological filters for the detection and a linear regression for the reconstruction of specific shadow areas; and v) several evaluation criteria capable to assess the reconstructability of shadow areas. All of them are specifically developed to work with VHR images.
Experimental results conducted on real data are reported in order to show and confirm the validity of all the proposed methods. They all suggest that, despite the complexity of the problems, it is possible to recover in a good way missing areas obscured by clouds or shadows.
Keywords
Résumé
Les satellites de télédétection sont devenus incontournables pour la société civile. En effet, les images satellites ont été exploitées avec succès pour traiter plusieurs applications, notamment la surveillance de l'environnement et de la prévention des catastrophes naturelles. Dans les dernières années, l'augmentation de la disponibilité de très haute résolution spatiale (THR) d’images de télédétection abouti à de nouvelles applications potentiellement pertinentes liées au suivi d’utilisation des sols et à la gestion environnementale. Cependant, les capteurs optiques, en raison du fait qu'ils acquièrent directement la lumière réfléchie par le soleil, ils peuvent souffrir de la présence de nuages dans le ciel et / ou d'ombres sur la terre. Il s'agit du problème des données manquantes, qui induit un problème important et crucial, en particulier dans le cas des images THR, où l’augmentation des détails géométriques induit une grande perte d'informations.
Dans cette thèse, de nouvelles méthodologies de détection et de reconstruction de la région contenant des données manquantes dans les images THR sont proposées et appliquées sur les zones contaminées par la présence de nuages et / ou d'ombres. En particulier, les contributions méthodologiques proposées comprennent: i) une stratégie multirésolution d’inpainting visant à reconstruire les images contaminées par des nuages ; ii) une nouvelle combinaison d'information radiométrique et des informations de position spatiale dans deux noyaux spécifiques pour effectuer une meilleure reconstitution des régions contaminés par les nuages en adoptant une régression par méthode a vecteurs supports (RMVS) ; iii) l'exploitation de la théorie de l’échantillonnage compressé avec trois stratégies différentes (orthogonal matching pursuit, basis pursuit et une solution d’échantillonnage compressé, basé sur un algorithme génétique) pour la reconstruction d’images contaminés par des nuages; iv) une chaîne de traitement complète qui utilise une méthode à vecteurs de supports (SVM) pour la classification et la détection des zones d’ombre, puis une régression linéaire pour la reconstruction de ces zones, et enfin v) plusieurs critères d'évaluation promptes à évaluer la performance de reconstruction des zones d'ombre.
Toutes ces méthodes ont été spécialement développées pour fonctionner avec des images très haute résolution. Les résultats expérimentaux menés sur des données réelles sont présentés afin de montrer et de confirmer la validité de toutes les méthodes proposées. Ils suggèrent que, malgré la complexité des problèmes, il est possible de récupérer de façon acceptable les zones manquantes masquées par les nuages ou rendues erronées les ombres.
Mots-clés
Astratto
I satelliti per il telerilevamento stanno dimostrando sempre più di essere uno strumento molto utile, infatti, le immagini satellitari sono di grande beneficio per diverse applicazioni, tra cui il monitoraggio ambientale e la prevenzione di disastri naturali. Negli ultimi anni, l'aumento della disponibilità di immagini telerilevate ad altissima risoluzione spaziale ha comportato nuove applicazioni potenzialmente rilevanti per il controllo della copertura terrestre, dell’uso del suolo terrestre e per la gestione ambientale. In particolare, i sensori ottici hanno fornito un contributo straordinario per questi scopi. Tuttavia, a causa del fatto che essi acquisiscono direttamente la luce riflessa del sole, possono soffrire della presenza di nuvole nel cielo e / o di ombre sulla terra. Questo fatto potrebbe portare ad avere dei dati mancanti, il quale causerebbe un problema significativo specialmente nel caso di immagini ad altissima risoluzione spaziale, dove la quantità di informazioneè particolarmente importante.
In questa tesi, nuove metodologie di rilevazione e di ricostruzione di regioni mancanti in immagini ottiche ad altissima risoluzione spaziale sono proposte e applicate per risolvere il problema di aree contaminate dalla presenza di nuvole e / o di ombre in tali immagini. In particolare, i contributi metodologici proposti sono: i) una strategia di inpainting multirisoluzione per ricostruire immagini contaminate dalla presenza di nuvole; ii) una nuova combinazione di informazioni radiometriche e di posizionamento spaziale suddivisa in due specifici kernel per effettuare una migliore ricostruzione di regioni contaminate dalla presenza di nuvole attraverso l'adozione di una regressione che sfrutta macchine a vettori di supporto (Support vector regression, SVR), iii) lo sfruttamento della teoria denominata compressive sensing, adottando tre diverse strategie (orthogonal matching pursuit, basis pursuit ed una soluzione basata su di un algoritmo genetico) per la ricostruzione di immagini contaminate dalla presenza di nuvole; iv) una catena completa di elaborazione che sfrutta una macchina a vettori di supporto (support vector machine, SVM) e filtri morfologici, con l’obiettivo di rilevare e ricostruire (mediante una regressione di tipo lineare) specifiche zone d'ombra, v) la valutazione di diversi criteri in grado di determinare la ricostruibilità delle zone d'ombra.
I risultati sperimentali condotti su dati reali sono riportati al fine di dimostrare e di confermare la validità di tutti i metodi qui proposti. Questi suggeriscono che, nonostante la complessità dei problemi, è possibile recuperare con buona accuratezza le zone mancanti oscurate dalla presenza di nuvole e / o di ombre.
Parole chiave
Thanks to - Ringraziamenti
Ringrazio
- il Buon Dio che mi ha permesso di arrivare fin qui;
- la mia Grande Famiglia […] che mi ha sempre sostenuto;
- Il mio Amore Virginia, da 10 anni al mio fianco;
- Assieme alla sua piccola famiglia (Carolina, Roberto e Stefano);
- دوأ نأ رك ش أ ل يزج رك ش لا ،يذات س أ دي س لا د ير ف ج همعد ل ي ل و مدق تأ ه ل ص لاخ ب رعاش م رخف لا زازت علااو
- Je remercie mon directeur de thèse Greg pour ses grand et riches conseils ;
- I miei compagni d’avventura, Edo (+ Chiara) e Thomas, di continuo disponibili;
Contents
1. Introduction and Thesis Overview ... 1
1.1. Context ... 2
1.2. Problems ... 4
1.3. Thesis Objective, Solutions and Organization ... 6
1.4. References ... 8
2. Résumé Long en Français ... 11
2.1. Contexte ... 11
2.2. Problèmes ... 13
2.3. Objectif thèse, Solutions et Organisation ... 16
2.4. Références ... 17
3. Inpainting Strategies for Reconstruction of Missing Data in VHR Images ... 21
3.1. Introduction ... 22
3.2. Problem Formulation ... 22
3.2.1. Region-based inpainting (RBI) ... 23
3.3. Proposed Inpainting Strategies ... 25
3.3.1. Feature extraction-based inpainting (FEBI) ... 25
3.3.2. Inpainting with isometric transformation (IsoI) ... 25
3.3.3. Multiresolution inpainting (MRI) ... 26
3.4. Experimental Results ... 27
3.4.1. Dataset description and setups ... 27
3.4.2. Experimental results ... 28
3.5. Conclusion ... 30
3.6. Acknowledgment ... 32
3.7. References ... 32
4. Support Vector Regression with Kernel Combination for Missing Data Reconstruction ... 35
4.1. Introduction ... 36
4.2. Problem Formulation ... 37
4.3. Proposed Solution ... 38
4.3.2. Common kernel functions ... 38
4.3.3. Kernel function ... 39
4.3.4. Feature Vector ... 39
4.4. Experimental Results ... 40
4.4.1. Dataset description... 40
4.4.2. Experiments ... 41
4.4.3. Comparative analysis ... 43
4.5. Conclusion ... 44
4.6. Acknowledgment ... 45
4.7. References ... 45
5. Missing Area Reconstruction in Multispectral Images Under a Compressive Sensing Perspective ... 47
5.1. Introduction ... 48
5.2. Problem Formulation ... 49
5.3. Reconstruction via Compressive Sensing ... 50
5.3.1. Generalities on Compressive Sensing ... 50
5.4. Genetic Algorithm ... 52
5.4.1. General Concepts on GA ... 52
5.4.2. GA setup ... 53
5.5. Experimental Results ... 54
5.5.1. Dataset description and setup... 54
5.5.2. Results ... 56
5.5.3. Reconstruction impact on image classification ... 62
5.6. Conclusion ... 63
5.7. Acknowledgement ... 64
5.8. References ... 64
6. A Complete Processing Chain for Shadow Detection and Reconstruction in VHR Images ... 67
6.1. Introduction ... 68
6.2. Problem Formulation ... 69
6.3. Proposed Method ... 70
6.3.1. Mask construction ... 71
6.3.2. Border creation ... 72
6.3.3. Classification maps ... 73
6.3.5. Border reconstruction ... 75
6.4. Experimental Results ... 76
6.4.1. Border reconstruction ... 76
6.4.2. Experimental setup and results ... 76
6.4.3. Reconstruction impact on classification accuracy ... 83
6.4.4. Comparative analysis ... 84
6.5. Conclusion ... 85
6.6. Acknowledgment ... 88
6.7. References ... 88
7. Assessing the Reconstructability of Shadow Areas in VHR Images ... 91
7.1. Introduction ... 92
7.2. Shadow Reconstruction Methods ... 93
7.2.1. Linear transformation (LT) ... 93
7.2.2. Histogram matching (HM) ... 93
7.2.3. Gamma correction (GC) ... 95
7.3. Reconstructability Problem Formulation ... 96
7.4. Proposed Criteria ... 96
7.4.1. Histogram quantization error (HQE) ... 97
7.4.2. Gray level ratio (GLR) ... 97
7.4.3. Two sample Kolmogorov-Smirnov test (2KS) ... 97
7.4.4. Variance Ratio (VR) ... 98
7.4.5. Negentropy difference (ND) ... 98
7.4.6. Kullback-Leibler Divergence (DKL) ... 98
7.4.7. Angular Second-Moment Difference (ASMD) ... 99
7.4.8. Homogeneity Difference (HD) ... 99
7.5. Criterion Selection and Decision Making ... 99
7.5.1. Criterion selection ... 99
7.5.2. Reconstruction evaluation ... 100
7.6. Experimental Results ... 101
7.6.1. Dataset description... 101
7.6.2. Experimental setup ... 101
7.6.3. Results ... 103
7.6.4. Validation of the Results ... 107
7.8. Acknowledgment ... 109
7.9. References ... 110
8. Conclusion ... 113
9. List of Related Publications... 117
9.1. Published Journal Papers ... 117
9.2. Journal Papers in Revision ... 117
List of Tables
Table 3.I. Results in PSNR obtained by the different inpainting strategies for different land covers. (a) Riyadh image and (b) Boumerdes image.
Table 3.II. Results in PSNR obtained by the different inpainting strategies by varying the missing area size in homogeneous land covers. (a) Riyadh image and (b) Boumerdes image.
Table 3.III. Results in PSNR obtained by the different inpainting strategies by varying the missing area size in heterogeneous land covers. (a) Riyadh image and (b) Boumerdes image.
Table 3.IV. Global comparison between proposed strategies and RBI.
Table 4.I. Quantitative results obtained by the GKCR in the two ROI, increasing the value of and adopting #TR/#TS=1/5 ratio.
Table 4.II. Comparison between the 5 investigated reconstruction techniques for ROI A.
Table 5.I. Quantitative results obtained in the first simulation experiments for dataset 1.
Table 5.II. Quantitative results obtained in the first simulation experiments for dataset 2.
Table 5.III. Quantitative results obtained in the second simulation experiments for dataset 1.
Table 5.IV. Quantitative results obtained in the second simulation experiments for dataset 2.
Table 6.I. Number of training (TR) and test (TS) pixels used to classify each class of the three considered images.
Table 6.II. Legend of colors used to generate the classification map for the three considered images.
Table 6.III. Class accuracies achieved on the test samples for each class of the three considered images.
Table 6.IV. User’s and producer’s accuracies achieved for the (a) Boumerdès, (b) Atlanta, and (c) Jeddah images.
Table 6.V. Percentage of shadow pixels correctly classified after shadow reconstruction.
Table 6.VI. Classification user accuracies (in percent) before and after shadow reconstruction. They are computed by merging non-shadow and shadow areas into the same thematic class. This last is correctly recognized if all the pixels are classified as non-shadow.
Table 7.I. Reconstruction results for the different classes.
Table 7.II. Numerical results obtained from the investigated normalized evaluation criteria.
Table 7.III. Best threshold value obtained for each criterion and corresponding ACC value.
Table 7.IV. Results of the criterion selection procedure based on iterative elimination.
Table 7.V. Numerical SARI results obtained on the test images and their reconstructability judgment. Note that
List of Figures
Figure 1.1. Example of an IKONOS-2 VHR image and related spectral bands (blue, green, red and near infrared).
Figure 1.2. Example of a pattern recognition processing.
Figure 1.3. General block diagram of an image reconstruction process.
Figure 1.4. Example of (a) completely obscuration by a cloud and (b) a partially obscuration by a shadow.
Figure 2.1. Exemple d'une image IKONOS-2 et liées bandes spectrales (bleu, vert, rouge et proche infrarouge).
Figure 2.2. Exemple d'un traitement de reconnaissance de formes.
Figure 2.3. Schéma bloc général d'un processus de reconstruction de l'image.
Figure 2.4. Exemple d’images (a) complètement bouchée par un nuage et (b) un affectée partiellement par une ombre.
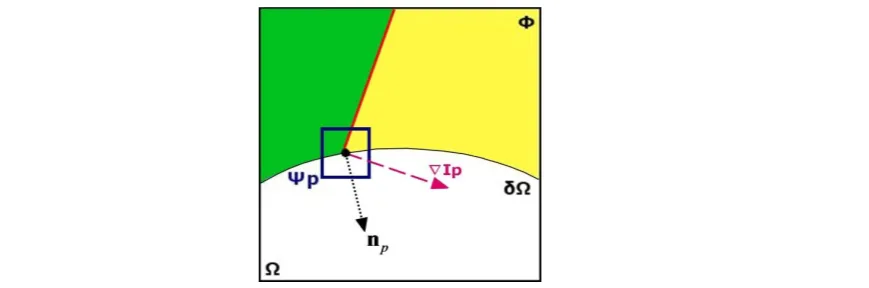
Figure 3.1. Illustration of the fill-in propagation by region-based synthesis. (a) The original image is divided in source region (composed of green and yellow areas) and target region (white area). (b) A patch
centered in on the fill front . (c) The most similar patch . (d) Inpainting result for .
Figure 3.2. Inpainting geometry. Patch centered in on the fill front . : unit vector orthogonal to the border in the pixel . : vector orthogonal to the isophote at point .
Figure 3.3. Illustration of the 7 isometric transformations: +90°, +180°, +270°, horizontal flip, vertical flip, horizontal flip +90° and horizontal flip +270°.
Figure 3.4. In MRI, the window dimension of the patches and decreases with iterations.
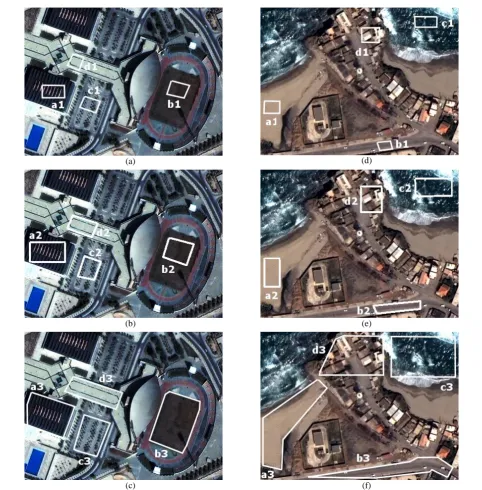
Figure 3.5. Riyadh (left) and Boumerdes (right) images with masks of increasing dimension (from top to bottom). Note that Riyadh image has a spatial resolution of 4 meters and the one of Boumerdes is 2.4 meters.
Figure 3.6.Reconstruction results obtained by the MRI method for the masks illustrated in Figure 3.5. Riyadh image (a)-(c) and Boumerdes image (d)-(e).
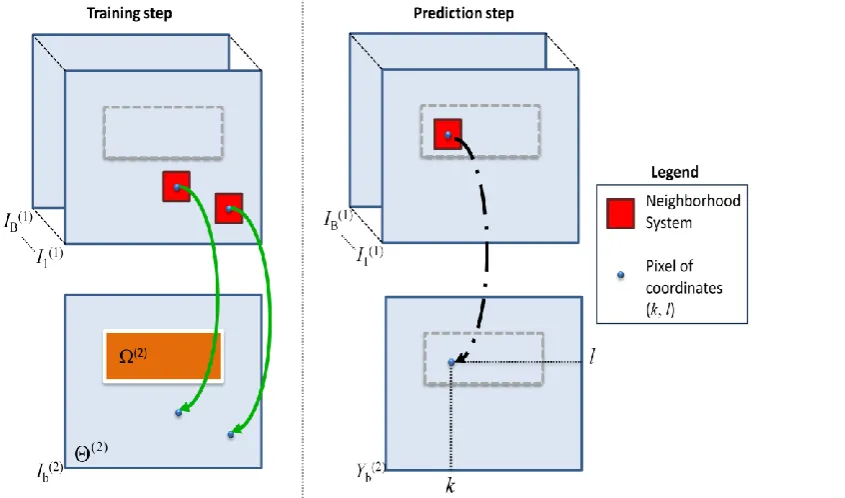
Figure 4.1. Example of the reconstruction process: training and prediction steps.
Figure 4.2. Structure of the proposed feature vector: the first 2 elements correspond to the coordinates of the pixel, the next B refer to the corresponding pixel in all the spectral bands of and the last four to the
neighborhood of the pixel of interest in where represents the spectral band that is targeted.
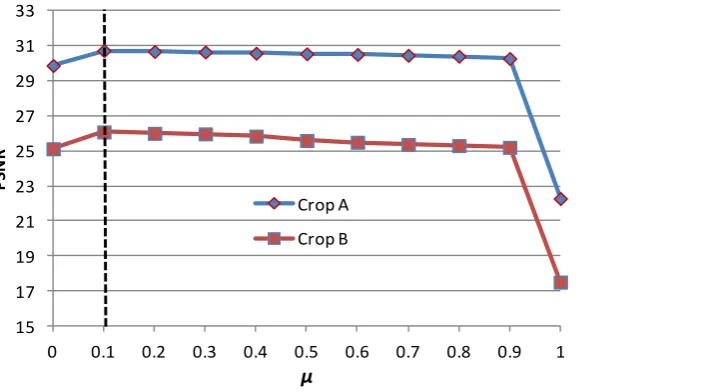
Figure 4.3. Evolution of training and test PSNR values varying parameter, for the two crop regions, adopting #TR/#TS=1/5 ratio.
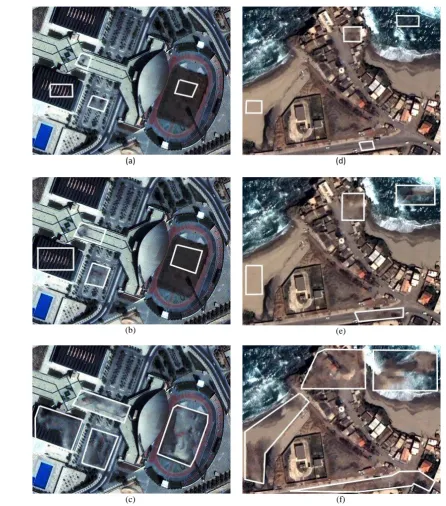
Figure 4.4. ROI A: (a) image with highlighted TR samples samples), (b) image with the addition of the mask, and (c) reconstructed image with highlighted SVs.
Figure 4.5. Zoom of area of interest in Figure 4.4: (a) image, (b) original image, and (c) reconstructed image.
Figure 4.6. ROI B: (a) image with highlighted TR samples samples), (b) image with the addition of the mask, and (c) reconstructed image with highlighted SVs.
Figure 4.7. Zoom of area of interest in Figure 4.6: (a) image, (b) original image, and (c) reconstructed image.
Figure 5.1. Illustration of the reconstruction principle under a CS perspective.
Figure 5.2. Illustration of multiobjective genetic procedure.
Figure 5.3. Adopted chromosome structure.
Figure 5.5. Dataset 2: SPOT-5 images acquired in the Reunion island on (a) the 2 of May and (b) the 18 of June, 2008.
Figure 5.6. Masks adopted to simulate the contamination of different ground covers.
Figure 5.7. Pareto fronts obtained at convergence for (a) dataset 1, and (b) dataset 2. Note that is represented in percentage.
Figure 5.8. Masks adopted to simulate the different sizes of contamination.
Figure 5.9. Dataset 1. Color composite images (bands 1, 2, and 3) (a) of the original image, and the same image reconstructed after the contamination with the largest simulated mask 3 by (b) MRI, (c) CMLP, (d) OMP, (e) BP, and (f) GA methods.
Figure 5.10. Dataset 2. Color composite images (bands 1, 2, and 3) (a) of the original image, and the same image reconstructed after the contamination with the largest simulated mask 3 by (b) MRI, (c) CMLP, (d) OMP, (e) BP, and (f) GA methods.
Figure 5.11. Unsupervised classification maps obtained by the k-means algorithm (k=5) (a) for the original FORMOSAT-2 image; and the same image reconstructed after contamination with mask A by (b) MRI, (c) CMLP, (d) OMP, (e) BP, and (f) GA methods.
Figure 5.12. Zooming of Figure 5.11 on mask A area: (a) original classification and classification after reconstruction with (b) MRI, (c) CMLP, (d) OMP, (e) BP, and (f) GA methods.
Figure 6.1. Illustration of cast and self shadows
Figure 6.2. Flow chart of the proposed method.
Figure 6.3. Example of (a) initial mask image , (b) mask post-processed by opening and closing , (c) final mask with borders .
Figure 6.4. Examples of structuring elements used for (a) the standard morphological operator and (b) the morphological operator adapted to the shadow geometry related to the image in Figure 6.3.
Figure 6.5 Illustration of the reconstruction of a border pixel with a 7×7 size window.
Figure 6.6. Example of (a) initial mask image , and post-processed mask by opening and closing obtained with different SE sizes: (b) 3×3, (c) 5×5, and (d) 7×7.
Figure 6.7. Reconstruction results for Boumerdès image. (a) Original image. (b) Binary mask. (c) Post-processed mask. (d) Mask with borders. (e) Multiclass classification. (f) Shadow reconstruction. (g) Border interpolation. (h) Final output image.
Figure 6.8. Reconstruction results for Atlanta image. (a) Original image. (b) Binary mask. (c) Post-processed mask. (d) Mask with borders. (e) Multiclass classification. (f) Shadow reconstruction. (g) Border interpolation. (h) Final output image.
Figure 6.9. Reconstruction results for Jeddah image. (a) Original image. (b) Binary mask. (c) Post-processed mask. (d) Mask with borders. (e) Multiclass classification. (f) Shadow reconstruction. (g) Border interpolation. (h) Final output image.
Figure 6.10. Classification results before and after shadow reconstruction: (a) and (b) Boumerdes image, (c) and (d) Atlanta image, and (e) and (f) Jeddah image. All shadow classes are grouped in a unique class (in black).
Figure 6.11. Comparison with methods [12] and [20] for Atlanta image. (a), (c) and (e) binary masks and (b), (d) and (f) reconstructed images associated with our method, [12] and [20], respectively.
Figure 6.12. Comparison with methods [12] and [20] enhanced with the morphological approach for Atlanta image. (a), (c) and (e) binary masks and (b), (d) and (f) reconstructed images associated with our method, [12] and [20], respectively.
Figure 7.1. Illustration of the histogram matching method. corresponds to the max value in image I.
Figure 7.2. transformation example: for one bin of the shadow distribution, there exist two corresponding bins in the non-shadow distribution.
Figure 7.3. Roulette wheel for the two distributions in Figure 7.2.
Figure 7.5. Illustration of the estimation of the best threshold value according to the ZFAR principle.
Figure 7.6. Images of (a) Boumerdes, (b) Riyadh, and (c) Atlanta datasets.
Figure 7.7. (a) Original Boumerdes image with shadow areas highlighted. Shadow areas reconstructed with: (b) LT, (c) , (d) , (e) and (f) GC.
Figure 7.8. Behavior of the false alarm rate (FAR) and the accuracy (ACC) values for the eight explored evaluation criteria (normalized between 0 and 1). (a) CHQE, (b) CGLR, (c) C2KS, (d) CVR, (e) CND, (f) CDKL, (g)
CASMD, (h) CHD.
Figure 7.9. Test images of (a) Boumerdes 2, (b) Riyadh 2, and (c) Atlanta 2 datasets.
Glossary
ALS: airborne laser scanner
AVIRIS: airborne visible infrared imaging spectrometer
BRDF: bidirectional reflectance distribution function
BP: basis pursuit
CCA: canonical correlation analysis
CNES: Centre National d'Études Spatiales
CV: cross-validation
CV: coefficient of variation
CS: compressive sensing
GA: genetic algorithm
HCV: hue, chroma, and value
HIS: hue, intensity and saturation
HSV: hue, saturation, and value
IR: infrared
LIDAR: light detection and ranging
KDE: kernel density estimation
MAD: multivariate alteration detection
MODIS: moderate resolution imaging spectrometer
MSER: maximally stable extremal regions
NDVI: normalized difference vegetation index
NSVDI: normalized saturation-value difference index
OMP: orthogonal matching pursuit
PAN: panchromatic
PCA: principal component analysis
PSNR: peak signal-to-noise ratio
RADAR: radio detection and ranging
RBF: radial basis function
ROI: region of interest
RS: remote sensing
TR: training
TS: test
SAR: synthetic aperture radar
SE: structuring element
SSE: sum square error
SV: support vector
SVM: support vector machine
SVR: support vector regression
VHR: very high resolution
YIQ: luma, inphase, and quadrature
1
1.
Introduction and Thesis Overview
2 1.1.Context
Remote sensing (RS) is the acquisition of information (spectral, spatial, and temporal) of an object, by the use of recording sensing devices without coming into contact with the object. One of the most common recording sensing device is the artificial satellite, which can be equipped with 1) a passive or 2) an active sensor [1]. Passive sensors detect the radiation that is emitted or reflected by a region or a target of interest. The most common source of radiation is the sunlight, which is reflected by the objects and afterward measured by passive sensors such as infrared sensors and radiometers. The main advantages of passive sensors are a highest spatial resolution and the possibility to obtain unique fingerprints (also known as spectral signature) of the scanned material (exploiting the multispectral or hyperspectral bands). Active sensors emit a specific signal in order to obtain a backscattered energy from the observed target. The discrimination between objects and/or areas depends on the backscattered radiation. Examples of active sensors are the SAR and the LIDAR. This last measures the time delay between the emission and the return of the signal, measuring several properties like the location, the elevation, the speed and the direction of the target. The major advantages of active sensors, include the capability to obtain measurements anytime, regardless of the time of day or season and robust to the atmospheric conditions [2]-[3]. In this dissertation, we consider remote sensing systems for Earth observation, coming from satellites which mount passive sensors capable to acquire multispectral and very high spatial resolution (VHR) images.
Before the advent of VHR optical satellites, it was only possible to acquire images with spatial resolution of the order of several meters (e.g., Landsat 7 with a resolution of 15 meters). The new generation of very high resolution optical satellites, like QuickBird, IKONOS-2, Pléiades, WorldView-1 and -2, and GeoEye-1 and -2, opens novel prospective thanks to the increased amount of spatial information they convey [4]-[5]. These new multispectral sensors are capable to register very important information for many potential applications related to environmental monitoring and land control and management (see an example of VHR image and its spectral signature in Figure 1.1).
3
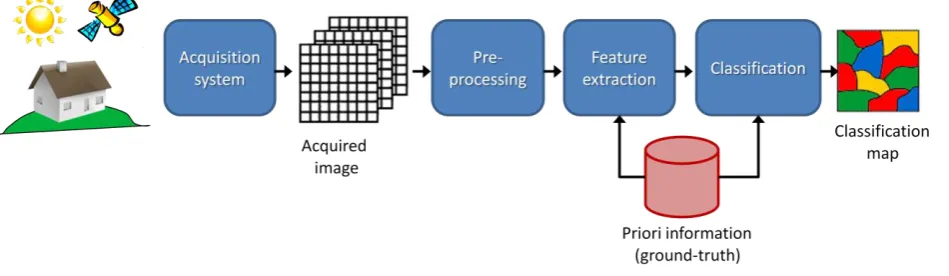
New methodologies are however needed to analyze in an efficient way this new generation of data (e.g., classification, segmentation, edge detection, tree species identification, etc… [6]). A typical pattern recognition scheme is illustrated in Figure 1.2, where we want 1) to acquire the image with a proper sensor; 2) to pre-process the image in order to correct the problems which can occur during the acquisition system; 3) to extract some features, and at the same time select the best ones, in order to improve the work of the following step; 4) to classify in different thematic classes the acquired image.
Potentially, with the advent of VHR images it is possible to obtain richer classification maps, containing very detailed classes. Unfortunately, passive sensors in general and VHR in particular suffer from the problem of atmospheric conditions, in particular from the presence of clouds and/or shadow covers [7]. As a consequence, exploitability of these images is affected by completely or partially missing data.
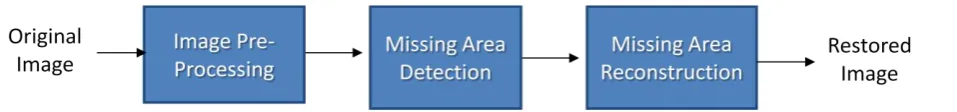
Despite the obscurations due to the presence of clouds and shadows have different origins, they can be considered as similar problems, but they require different implementations of the above described three principal steps. Nevertheless, for both cases, to reconstruct missing areas the main steps are (see Figure 1.3):
1. Image pre-processing: the first step is particularly important for it includes operations such as co-registration and calibration of the image.
2. Missing area detection: the scope of this second task is to identify the location of the missing areas. To obtain a precise, automatic and unsupervised identification of these regions, detection could exploit the statistical distributions, the correlations and the geometries of these areas. Besides the spatial and spectral information, also the temporal could be evaluated if available. Indeed considering different acquisitions on the same area Figure 1.3. General block diagram of an image reconstruction process.
4
but at different times will hopefully help the detection thanks to the non-stationary nature of the cloud and shadow contributions. Since clouds and shadows refer to different contamination operations, for each of them, appropriate detection solutions must be considered.
3. Missing area reconstruction: after detecting the position of the missing areas, the goal of this last step is to restore them. Similarly to the previous step, reconstructing clouds or shadows must be handled differently. Cloud reconstruction appears a priori more complex than reconstructing shaded area, because shadows only partially affect the obscured information.
In the next paragraph we will describe in more detail the problems that each of these steps potentially convey.
1.2.Problems
Passive sensors are limited mainly by their sensitivity on the atmospheric condition during the acquisition of the image. The acquired images are frequently subject to the presence of clouds and/or of shadows. The former are affected by a complete missing data and may cover also big regions, depending on the season or on the geographical position of the acquisition (see Figure 1.4(a)). In the latter case, we have only a partial missing of data, and shadows are present in almost all the images, particularly in urban areas where there are larger changes in surface elevation (due to the presence of buildings, bridges, towers, etc) and consequently longer shadows (see Figure 1.4(b)). Depending on the application clouds and shadows can be viewed: 1) as a source of information for the evaluation of important parameters (e.g., in the case of clouds, the cloud liquid water in meteorological forecast and hydrological studies [8]-[9], whereas for the case of shadows, the building position and their height [10]) or 2) as a source of contamination which strongly affects the quality of the image and returns partially useless information. This last case is the subject on which we will focus our attention.
(a) (b)
5
In both cases, clouds or shadows, the detection and the process to mask the undesired areas of missing data represents one of the first step to cope with. Clouds detection is in general based on the fact that clouds have a lower temperature and thus their spectral signature is lower in the infrared (IR) frequency. Moreover they are brighter, indeed they reflect almost all the sun illumination. In the literature, different strategies were proposed. Their general idea is to reduce the task to a binary classification problem, discerning between clouds and free-cloud regions [11]-[13]. For the detection of shadows the literature reports mainly two approaches: model-based and shadow properties-based approaches. The former needs a priori information about the scenario and the sensor. However, usually such knowledge is not available. Therefore most of the shadow detection algorithms are based on their properties, principally based on the fact that shaded areas present lower brightness, higher saturation and greater hue values (see Phong model [14]). In early works, shadow properties-based approaches attempt to detect shadows using a space color transformation and an automatic threshold estimator [15]. In a comparative work [16], several invariant color spaces comprising HIS, HSV, HCV, YIQ and YCbCr, were analyzed to detect shadows. Based on the results obtained in this study, a better shadow-detection approach was developed, using a novel successive thresholding scheme [17]. In addition there exist other algorithms which just integrate to the processing an extra feature image, to help to better discriminate shaded areas (e.g.: NDVI normalized difference vegetation index [18], NSVDI normalized saturation-value difference index [19], MSER maximally stable extremal regions [20]). Another technique applies the principal component analysis (PCA) transformation to isolate the luminance component, exploiting the image multidimensionality [21].
The restoration of digital images has been deeply studied in several applications mainly because of its theoretical and practical importance in different fields, such as radioastronomy, biomedical engineering, and machine vision [22]. Coming now to the RS field, also here a certain attention has been paid for the reconstruction of digital images and in different problems, like acquisition blur and geometric distortions [23], phase distortions [24], resampling problems [25], or problems related to applications like buried object detection [26]. But for the cases of clouds and shadows restoration relatively few works were presented in the literature, especially for the case of VHR images.
6
case of the wavelet transform) and the multiscale geometrical grouping. Its promising experimental results encourage the idea of exploiting inpainting techniques to reconstruct missing data in remote sensing imagery [30]. All these previous techniques present several drawbacks, for example, the sensor, the ground cover and the cloud typology dependence, the need of a very high temporal resolution and the higher methodological complexity.
Coming now to the shadow reconstruction, there exist essentially three different approaches: gamma correction, histogram matching and linear correlation [31]. In [32],the authors consider that the surface texture does not radically change when it is shaded. To remove shadows, the authors use a contextual texture analysis between a segment of shadow and its neighbors. Knowing the kind of surface under the shadow a local gamma transformation is used to restore the shaded area. On the contrary, in [33], after the detection of the shadows, the authors propose to adjust the hue, intensity and saturation values (HIS) in shadowed regions respectively according to the analogous values in the local surroundings around each shaded region, adopting the histogram matching method. In [34], the authors recover spectral information in shadow areas in an Ikonos image having the height data from the airborne laser scanner (ALS). Having evaluated a simulation of the possible shadow areas exploiting ALS data, the authors make use of this information to overlay and eliminate the real shadow, comparing the results obtained with two methods: gamma correction and linear correlation. In [35], the authors consider the fact that the restoration of shadows almost depend on the spectral signature of the spectral bands. So first the bands are thresholded in an independent way determining the optimal threshold values by visual inspection. Then a linear regression in each spectral band is carried out to correct the shadow effects. All these previous techniques adopt one of the most common solutions as a singular measurement. They can fail to restore obscured area if not adopted in a proper way; for example, if they obtain only one shadow restoration for the several thematic classes presented in the image.
Almost all of these reconstruction techniques may not work properly if used on images with a very high spatial resolution. The increment of the spatial resolution may be translated in a corresponding increase in the heterogeneity of the surfaces, in other words, in much more details. Accordingly, specific techniques should be developed in order to fully exploit all the potential conveyed by VHR optical images.
1.3.Thesis Objective, Solutions and Organization
As introduced in the previous subsection, missing data problem due to the presence of clouds and/or shadows represents a research field of great interest mainly because of its important implications. In this thesis work, we will focus on the reconstruction of image data, totally obscured by the presence of clouds or only partially obscured by the presence of shadows, by proposing new and innovative methodological solutions.
7
In Chapter 3, the problem of missing area reconstruction due to the presence of clouds is faced. In particular, we focus on the reconstruction exploiting the inpainting methodology on a single date image. After a brief introduction of the region-based inpainting (RBI) algorithm developed by Criminisi et al [36], three different new strategies are described: 1) Feature extraction-based inpainting (FEBI), where additional textural features extracted from the original image are exploited; 2) inpainting with isometric transformation (IsoI), where we aim at increasing the amount of patch candidates and thus populating further the search space; and 3) multiresolution inpainting (MRI), where we progressively inject multiresolution information in order to obtain a better reconstruction.
In Chapter 4, a new strategy for support vector regression (SVR) in the context of multitemporal multispectral remote sensing images is proposed. In particular, we intend to improve the reconstruction process by integrating both radiometric and spatial position information. For each kind of information adopted in the regression, a specific kernel is selected and adapted; in more detail, we evaluate the performances of the combinations of three different typologies of kernels (e.g., linear-linear, linear-polynomial, etc.). Subsequently, their fusion is performed by a linear combination of the two resulting kernels. Support vector regression is applied to derive the prediction function.
In Chapter 5, three novel methods to solve the problem of the reconstruction of missing data due to the presence of clouds are proposed. Given a multitemporal dataset, missing measurements are recovered applying the compressive sensing (CS) theory in which cloud-free pixels are exploited. In more detail, we first adopt two of the most common CS methods which approximate the CS solution, namely the basis pursuit (BP) and the orthogonal matching pursuit (OMP). Furthermore, we propose an alternative CS solution, which exploits the search capabilities of genetic algorithms (GAs).
Coming now to the second part of the thesis, in Chapter 6, a new solution for the problem of the presence of shadows in very high resolution (VHR) is introduced. We propose a complete processing chain, which relies on various advanced image processing and pattern recognition tools. In more details, the detection of the shadow regions is made by a classification task, implemented by a support vector machine (SVM) approach, whereas the reconstruction is based on a linear regression method, capable to adjust the intensities of the shaded pixels accordingly to the corresponding non-shadow regions.
In Chapter 7, different criteria useful to help in understanding a priori if it is possible or not to reconstruct a specific shadow area are proposed. In particular, we assume that an ideal reconstructability criterion should not tolerate that an unreconstructable shadow area is assigned as reconstructable and, at the same time, should maximize the probability of detection of reconstructable areas. Several evaluation criteria working at the pixel and textural levels are presented, reported and discussed, in order to lead to the definition of a final global index based on the fusion of two single criteria which are the Kullback-Leibler divergence and the angular second-moment difference.
8
This manuscript supposes that the reader has basic knowledge in the field of remote sensing, pattern recognition and image processing. On the contrary, we suggest her/him to consult the references available at the end of this Chapter, in order to obtain a better introduction on the basic concepts which will be adopted in the following chapters. Note that every chapter in this manuscript has been written so that they are as much self-contained as possible.
1.4.References
[1] Jian Guo Liu, and Philippa J. Mason, Essential Image Processing for GIS and Remote Sensing, Chichester: Wiley-Blackwell, 2009.
[2] Robert A. Schowengerdt, Remote sensing: Models and methods for image processing, 3rd ed., Tucson: Academic Press, 2007.
[3] John Robert Schott, Remote sensing: The image chain approach, 2nd ed., New York: Oxford University Press, 2007.
[4] R. Hellermann, “Growing demand for VHR satellite imagery for civilian use,” in Proc. International Commercial Remote Sensing Symposium, Washington, USA, Mar. 2010.
[5] K. Jacobsen, “Very high resolution satellite images – competition to aerial images,” in Proc. Geospatial World Forum, Hyderabad, India, Jan. 2011.
[6] A. P. Carleer, O. Debeir, and E. Wolff, “Assessment of very high spatial resolution satellite image segmentations,” J. of the American Society for Photogrammetry and Remote Sensing, vol. 71, pp. 1285–1294, Nov. 2005.
[7] M. Neubert and G. Meinel, “Atmospheric and terrain correction of IKONOS imagery using ATCOR3,” in Proc. ISPRS, Hannover, Germany, May 2005.
[8] J. R. Wang, P. Racette, M. E. Triesky, E. V. Browell, S. Ismail, and L. A. Chang, “Profiling of atmospheric water vapor with MIR and LASE,” IEEE Trans. Geosci. Remote Sens., vol. 40, no. 6, pp. 1211–1219, Jun. 2002.
[9] B. G. Vasudevan, B. S. Gohil, and V. K. Agarwal, “Backpropagation neural-network-based retrieval of atmospheric water vapor and cloud liquid water from IRS-P4 MSMR,” IEEE Trans. Geosci. Remote Sens., vol. 42, no. 5, pp. 985–990, May 2004.
[10] T. Kim, T. Javzandulam and T-Y. Lee, “Semiautomatic reconstruction of building height and footprints from single satellite images,” in Proc. IGARSS, Barcelona, Spain, Jul. 2007, pp. 4737–4741. [11] L. L. Stowe, P. A. Davis, and E. P. McClain, “Scientific basis and initial evaluation of the CLAVR-1 global clear/cloud classification algorithm for the advanced very high resolution radiometer,” J. Atmospheric and Oceanic Technology, vol. 16, pp. 656–681, Jun. 1999.
[12] A. V. Di Vittorio, and W. J. Emery, “An automated, dynamic threshold cloud-masking algorithm for daytime AVHRR images over land,” IEEE Trans. Geosci. Remote Sens., vol. 40, no. 8, pp. 1682– 1694, Aug. 2002.
[13] F. Murtagh, D. Barreto, and J. Marcello, “Decision boundaries using Bayes factors: The case of cloud masks,” IEEE Trans. Geosci. Remote Sens., vol. 41, no. 12, pp. 2952–2958, Dec. 2003.
[14] J. Liu, J. Yang, and T. Fang, “Color property analysis of remote sensing imagery,” Act Photonica Sinica, vol. 38, no. 2, pp. 441–446, Feb. 2009.
9 [16] V. Tsai, “A comparative study on shadow compensation of color aerial images in invariant color
models,” IEEE Trans. Geosci. Remote Sens., vol. 44, no.6, pp. 1661–1671, Jun. 2006.
[17] K. L. Chung, Y. R. Lin, and Y. H. Huang, “Efficient shadow detection of color aerial images based on successive thresholding scheme,” IEEE Trans. Geosci. Remote Sens., vol. 47, no. 2, pp. 671–682, Feb. 2009.
[18] D. Cai M. Li, Z. Bao, Z. Chen, W. Wei, and H. Zhang, “Study on shadow detection method on high resolution remote sensing image based on HIS space transformation and NDVI index,” in Proc. International Conference on Geoinformatics, Beijing, China, Jun. 2010, pp.1–4.
[19] H. Ma, Q. Qin, and X. Shen, “Shadow segmentation and compensation in high resolution satellite images,” in Proc. IGARSS, Boston, MA, USA, Jul. 2008, vol. 2, pp. 1036–1039.
[20] H.Y. Yu, J.G. Sun, L.N. Liu, Y.H. Wang, and Y.D. Wang, “MSER based shadow detection in high resolution remote sensing image,” in Proc. ICMLC, Qingdao, China, Jul. 2010, pp. 780–783.
[21] S. Wang, and Y. Wang, “Shadow detection and compensation in high resolution satellite images based on retinex,” in Proc. ICIG, Xi'an, China, Sep. 2009, pp. 209–212.
[22] M. R. Banham and A. K. Katsaggelos, “Digital image restoration,” IEEE Signals Process. Mag., vol. 14, no. 2, pp. 24–41, Mar. 1997.
[23] S. E. Reichenbach, D. E. Koehler, and D. W. Strelow, “Restoration and reconstruction of AVHRR images,” IEEE Trans. Geosci. Remote Sens., vol. 33, no. 4, pp. 997–1007, Jul. 1995.
[24] V. P. Bakalov and M. Y. Yerokhin, “Removal of uncontrollable phase distortions in synthetic aperture radar signals,” IEEE Trans. Geosci. Remote Sens., vol. 38, no. 3, pp. 1298–1302, May 2000.
[25] S. E. Reichenbach and J. Li, “Restoration and reconstruction from overlapping images for multi-image fusion,” IEEE Trans. Geosci. Remote Sens., vol. 39, no. 4, pp. 769–780, Apr. 2001.
[26] Z. Wu and C. Liu, “An image reconstruction method using GPR data,” IEEE Trans. Geosci. Remote Sens., vol. 37, no. 1, pp. 327–334, Jan. 1999.
[27] S. C. Liew, M. Li, and L. K. Kwoh, “Automated production of cloud-free and cloud-shadow image mosaics from cloudy satellite imagery,” in Proc. ISPRS, Istanbul, Turkey, Jul. 2004, pp. 523–530. [28] F. Melgani, “Contextual reconstruction of cloud-contaminated multitemporal multispectral images,”
IEEE Trans. Geosci. Remote Sens., vol. 44, no. 2, pp. 442–455, Feb. 2006.
[29] B.-C. Gao, P. Yang, W. Han, R.-R. Li, and W. J. Wiscombe, “An algorithm using visible and 1.38-μm channels to retrieve cirrus cloud reflectances from aircraft and satellite data,” IEEE Trans. Geosci. Remote Sens., vol. 40, no. 8, pp. 1659–1668, Nov. 2002.
[30] A. Maalouf, P. Carré, B. Augereau and C. F. Maloigne, “A bandelet-based inpainting technique for clouds removal from remotely sensed images,” IEEE Trans. Geosci. Remote Sens., vol. 47, no. 7, pp. 2363–2371, Jul. 2009.
[31] P. Sarabandi, F. Yamazaki, M. Matsuoka, and A. Kiremidjian, “Shadow detection and radiometric restoration in satellite high resolution images,” in Proc. IGARSS, Anchorage, AK, USA, Sep. 2004, vol. 6, pp. 3744–3747.
[32] A. Massalabi, H. Dong-Chen, G.B. Benie and E. Beaudry, “Detecting information under and from shadow in panchromatic IKONOS images of the city of Sherbrooke,” in Proc. IGARSS, Anchorage, AK, USA, Sep. 2004, vol. 3, pp. 2000–2004.
[33] J. Su, X. Lin, and D. Liu, “An automatic shadow detection and compensation method for remote sensed color images,” in Proc. ICSP, Beijing, China, Nov. 2006, vol. 2.
[34] T. Nakajima, G. Tao, and Y. Yasuoka, “Simulated recovery of information in shadow areas on IKONOS image by combining ALS data,” in Proc. ACRS, Kathmandu, Nepal, 2002.
10 [36] A. Crimisi, P. Perez and K. Toyama, “Region filling and object removal by exemplar-based image
11
2.
Résumé Long en Français
2.1. Contexte
La télédétection est l'acquisition d'informations (spectrale, spatiale et temporelle) d'un objet, par l'utilisation d'appareils d'enregistrement de détection à distance, sans entrer en contact avec l'objet. Un des dispositifs d'enregistrement de la détection les plus fréquents provient de satellite artificiel, qui peut être équipé de 1) un capteur passif ou 2) un actif [1]. Les capteurs passifs peuvent détecter le rayonnement qui est émis ou réfléchi par une région ou une cible d'intérêt. La source la plus commune de rayonnement est la lumière du soleil, qui est réfléchie par les objets et ensuite mesurée par des capteurs passifs tels que des capteurs infrarouges et des radiomètres. Les principaux avantages de ces capteurs passifs sont une haute résolution spatiale et la possibilité d'obtenir des empreintes digitales uniques (également connu sous le nom signature spectrale) de la matière scannée (en exploitant les caractéristiques multispectrales ou hyperspectrales). Les capteurs actifs émettent un signal spécifique afin d'obtenir une énergie rétrodiffusée par la cible observée. La discrimination entre les objets et / ou de zones dépend du rayonnement rétrodiffusé. Les exemples de capteurs actifs sont les SAR et le LIDAR. Cette dernière mesure du délai entre l'émission et le retour du signal, la mesure de plusieurs propriétés telles que l'emplacement, l'altitude, la vitesse et la direction de la cible. Les principaux avantages de capteurs actifs sont notamment la capacité d'obtenir des mesures à tout moment, quel que soit le moment de la journée ou de la saison et d’être robuste aux conditions atmosphériques [2]-[3]. Dans cette dissertation, nous considérons des systèmes de télédétection pour l'observation de la Terre, venant de satellites passifs capables d'acquérir des images multispectrales à très haute résolution spatiale.
12
De nouvelles méthodes sont toutefois nécessaires pour analyser d'une manière efficace cette nouvelle génération de données (par exemple, la classification, segmentation, détection de contours, arbre d’identification des espèces, etc. [6]). Un système de reconnaissance typique est illustré à la figure 2.2, où nous voulons 1) pour acquérir l'image, un capteur approprié, 2) pré-traiter de l'image afin de corriger les problèmes qui peuvent survenir lors de l’acquisition; 3) extraire certaines caractéristiques, et en même temps, sélectionner les meilleurs d'entre elles, afin d’alléger les travaux de l'étape suivante; 4) classer dans différentes classes thématiques de l'image ainsi acquise.
Potentiellement, avec l'avènement des images a très haute résolution, il est possible d'obtenir des cartes de classification les plus riches, contenant des classes très détaillées. Malheureusement, les capteurs passifs en général et en particulier a très haute résolution souffrent des perturbations induitent pas les conditions atmosphériques, en particulier par la présence de nuages et / ou de la couverture nuageuse [7]. En conséquence, l'exploitabilité de ces images est affectée par tout ou partie des données manquantes.
Figure 2.2. Exemple d'un traitement de reconnaissance de formes.
13
Bien que les obstructions dues à la présence de nuages et les ombres aient des origines différentes, elles peuvent être considérées comme des problèmes similaires, mais elles nécessitent différentes implémentations des trois principales étapes décrites ci-dessus. Cependant, dans les deux cas, reconstituer les parties manquantes représente la principale étape (voir Figure 2.3):
1. pré-traitement de l'image: la première étape est particulièrement importante car elle comprend des opérations telles que la co-registration et l'étalonnage de l'image.
2. détection de la zone manquant: la portée de cette seconde tâche consiste à identifier l'emplacement des zones manquantes. Pour obtenir une identification précise, automatique et sans surveillance de ces régions, la détection pourrait exploiter les distributions statistiques, les corrélations et les géométries de ces régions. Outre l'information spatiale et spectrale, l'information temporelle pourrait aussi être évaluée si elle est disponible. Puisque les nuages et les ombres correspondent à des opérations de contaminations différentes, pour chacun d'eux, des solutions de détection appropriés doivent être pris en considération.
3. reconstruction de la zone manque: après la détection de la position des zones manquantes, le but de cette dernière étape consiste à les restaurer. Comme pour l'étape précédente, la reconstruction des nuages ou des ombres doit être traitée de façon spécifique. La reconstruction des zones cachées par les nuages semble plus complexe que la reconstruction des zones obscurcies ou cachées par les ombres a priori, car les ombres n’affectent que partiellement les informations initiales.
Dans le paragraphe suivant, nous allons décrire plus en détail les problèmes que chacune de ces étapes potentiellement véhiculent.
2.2. Problèmes
Les détecteurs passifs sont limités principalement par leur sensibilité aux conditions atmosphériques lors de l'acquisition de l'image. Les images acquises sont souvent affectées par la présence de nuages et / ou d'ombres. Les premières sont caractérisées par un manque de données complètes et peuvent également couvrir de grandes régions, en fonction de la saison ou de la position géographique de l'acquisition (voir la figure 2.4 (a)). Dans second cas, nous n'avons qu'un manque partiel des données et des ombres présentes dans presque toutes les images, en particulier dans les zones urbaines où il ya des grands changements d'élévation de surface (en raison de la présence de bâtiments, de ponts, tours, etc.) et par conséquent, des ombres plus longues (voir la figure 2.4 (b)). Selon les applications, les nuages et les ombres peuvent être considérées: 1) en tant que source d'informations pour l'évaluation des paramètres caractéristiques (par exemple, dans le
14
cas des nuages, l'eau liquide en nuage prévisions météorologiques et hydrologiques études [8]-[9], alors que pour le cas des ombres, la position et leur hauteur des bâtiments [10]) ou 2) comme source de contamination qui affectent fortement la qualité de l'image et envoie les informations partiellement inutiles. Ce dernier cas est le sujet sur lequel nous allons concentrer notre attention.
Dans les deux cas, les nuages ou les ombres, la détection et le processus de masquer les zones non souhaitées de données manquantes représentent une première étape considérée dans le traitement. La détection de nuages est en général basée sur le fait que les nuages ont une température plus basse et donc leur signature spectrale est plus faible dans l’infrarouge (IR). En outre, ils sont plus brillants, en effet, ils reflètent la quasi-totalité de l'éclairement. Dans la littérature, différentes stratégies ont été proposées. Leur idée générale est de réduire la tâche à un problème de classification binaire, discerner entre les nuages et les régions libre [11]-[13]. Pour la détection des ombres, la littérature rapporte principalement deux approches: approches à base de modèles et approches basées sur les propriétés des ombres. La première a besoin d'une information a priori sur la scène et le capteur. Cependant, le plus souvent de telles connaissances ne sont pas disponibles. C'est pourquoi la plupart des algorithmes de détection des ombres sont basés sur leurs propriétés intrinsèques, principalement basées sur le fait que les zones ombragées présentent une luminosité plus faible, de même pour la saturation et la teinte (voir modèle de Phong [14]). Dans les premières études, ont été proposées des approches basées sur les propriétés des ombres en utilisant une transformation de l'espace couleur et l’estimation automatique d’un seuil [15]. Dans une étude comparative [16], plusieurs espaces de couleur invariants comprenant HIS, HSV, le HCV, YIQ et YCbCr, ont été analysés pour détecter les ombres. Sur la base des résultats obtenus dans cette étude, une nouvelle approche a été proposée, en utilisant un système de seuillages successifs [17]. En outre, il existe d'autres algorithmes qui utilisent une image supplémentaire, pour aider à mieux distinguer les zones d'ombre (par exemple: l'indice végétation par différence normalisée NDVI [18], l’indice normalisé différence de saturation de valeur NSVDI [19], maximum stable régions extrêmes MSER [20]). Une autre technique utilise l'analyse en composantes principales (ACP) afin d'isoler la composante de luminance, en exploitant le caractère multidimensionnel de l'image [21].
(a) (b)
15
La restauration des images numériques a été profondément étudiée dans plusieurs applications principalement en raison de son importance théorique et pratique dans différents domaines, tels que la radioastronomie, le génie biomédical, et la vision artificielle [22]. Venons-en maintenant au champ de la télédétection, là aussi une certaine attention a été accordée à la reconstruction des images numériques et des problèmes différents, comme le flou d'acquisition et de distorsions géométriques [23], la phase distorsions [24], les problèmes de ré-échantillonnage [25], ou problèmes liés à des applications telle la détection d'objets enfouis [26]. Mais pour le cas des nuages et des travaux de restauration des ombres, relativement peu d’études ont été présentées dans la littérature, encore moins dans le cas des images a très haute résolution.
Pour mettre l'accent sur le problème des nuages, dans ces dernières années, différents travaux ont été présentés et sont principalement destinés à la basse ou moyenne résolution spatiale des images. Ils sont fondés sur l'hypothèse que la signature temporelle d'un pixel donné est contaminée par des effets résiduels causés par une détection imparfaite ou par le bruit spatialement autocorrélées en raison de l'atténuation atmosphérique. Ils font usage de principes tels que le principe de substitution des données [27], ou des stratégies de prédiction temporelle [28]. Une autre approche vise à supprimer un type particulier de nuages, les nuages cirrus, acquis auprès du spectromètre MODIS ou AVIRIS [29]. Les auteurs ont constaté que les mesures acquises à la bande de 1,38 um sont essentiellement dues à la réflectance bidirectionnelle de cirrus atténuée par l'absorption de la vapeur d'eau au-dessus de ce cirrus. Ils utilisent ce fait pour corriger et éliminer ces effets d'atténuation. Plus récemment, d'autres techniques peuvent recourir à stratégies de reconstruction telles les techniques d’in-painting, qui visent à combler les trous dans les images numériques en propageant les structures environnantes. Un exemple est la méthode retouches qui permet d'enlever les nuages à l'aide de la transformée de bandelettes (un cas particulier de la transformée en ondelettes) et le regroupement multi-échelle géométrique. Ses résultats expérimentaux prometteurs ont encouragés l'idée d'exploiter les techniques de retouches pour reconstruire les données manquantes en télédétection [30]. Toutes ces techniques présentent plusieurs contraintes liées notamment aux capteurs, à la couverture du sol et à la dépendance typologie des nuages, à la nécessité d'une très haute résolution temporelle et une plus grande complexité méthodologique.
16
en comparant les résultats obtenus avec deux méthodes: la correction gamma et la régression linéaire. Dans [35], les auteurs considèrent que la restauration des ombres dépendra de la signature spectrale des bandes spectrales. Les bandes sont d’abord seuillées de manière indépendante et la détermination des valeurs des seuils optimaux est effectuée par inspection visuelle. Puis une régression linéaire dans chaque bande spectrale est effectuée pour corriger les effets d'ombre. Toutes les techniques de l’état de l’art adoptent l'une de ces solutions, qui sont les plus courantes, comme une mesure singulière.
La quasi-totalité de ces techniques de reconstruction peuvent ne pas fonctionner correctement sur des images avec une très haute résolution spatiale. L'augmentation de la résolution spatiale s’accompagne d’une augmentation correspondante de l'hétérogénéité des surfaces, en d'autres termes, beaucoup plus de détails. Par conséquent, des techniques spécifiques doivent être développées afin d'exploiter pleinement tout le potentiel véhiculé par les images optiques à très haute résolution.
2.3. Objectif thèse, Solutions et Organisation
Comme présenté dans le paragraphe précédent, le problème de l’estimation des données manquantes en raison de la présence de nuages et / ou des ombres représente un domaine de recherche d'un grand intérêt. Dans ce travail de thèse, nous allons nous concentrer sur la reconstruction de données d'image, totalement obscurcies par la présence de nuages ou seulement partiellement masquées par la présence d'ombres, en proposant des solutions méthodologiques nouvelles et innovantes.
Après cette section introductive, la thèse est organisée en six chapitres. Une première partie, contenant trois sections, est consacré au problème de la contamination de l’image par les nuages, puis une deuxième partie, contenant deux sections, traite du problème de la contamination par les ombres.
Dans le chapitre 3, le problème de la reconstruction de zone masquée par la présence de nuages est abordé. En particulier, nous nous concentrons sur la reconstruction basée sur les techniques d’in-painting sur une image d’une seule date. Après une brève introduction de l’algorithme développé par Criminisi et al [36] sur l’inpainting basée région (RBI), trois nouvelles stratégies sont proposées : 1) in-painting sur la base de l’extraction de caractéristiques (FEBI), où des caractéristiques de texture sont exploités; 2) in-painting avec transformation isométrique (ISOI), où nous cherchons à accroître le nombre de candidats de potentiel, et 3) inpainting multirésolution (MRI), où nous avons progressivement injecté les informations multirésolution afin d'obtenir une meilleure reconstruction.
linéaire-17
polynomiale, etc.) Par la suite, leur fusion est réalisée par une combinaison linéaire des deux noyaux résultants. La régression par vecteurs supports est alors appliquée pour calculer le fonction de prédiction.
Dans le chapitre 5, trois nouvelles méthodes de reconstruction des données manquantes dues à la présence de nuages sont proposées. Étant donné un ensemble de données multidates, les mesures manquantes sont estimées par application d’un échantillonnage compressé (Compressive Sensing, CS) dans lequel les pixels sans nuages sont exploités. De façon plus détaillée, nous avons d'abord utilisé deux des méthodes le plus courantes de la littérature, à savoir Basis Pursuit (BP) et Orthogonal Matching Pursuit (OMP). Ensuite, nous proposons une solution alternative d’échantillonnage compressé, qui exploite les capacités de recherche des algorithmes génétiques (AG).
Venons-en maintenant à la deuxième partie de la thèse, via le chapitre 6, dans laquelle une nouvelle solution permettant de s’affranchir de la présence des ombres en très haute résolution (THR) est introduite. Nous proposons une chaîne de traitement complète, qui repose sur un traitement d'image avancé et divers outils de reconnaissance de formes. Plus en détails, la détection des zones d'ombre est réalisée par une classification, mise en oeuvre par une méthode à vecteurs supports (support vector machine, SVM), tandis que la reconstruction est basée sur une méthode de régression linéaire, capable d'ajuster les intensités des pixels à l’ombre par rapport à leur correspondants de la même classe en dehors de l’ombre.
Dans le chapitre 7, différents critères sont utilisés pour aider à savoir a priori s'il est possible ou non de reconstruire une zone d'ombre spécifique. En particulier, nous supposons qu'un critère de potentiel de reconstruction idéal ne devrait pas tolérer qu'une zone d'ombre irrécupérable soit considérée comme reconstructible et, en même temps, celui-ci devrait permettre de maximiser la probabilité de détection des zones reconstructible. Plusieurs critères d'évaluation qui travaillent au niveau des pixels et de la texture sont présentés et discutés, afin d'aboutir à la définition d'un indice global basé sur la fusion de deux critères simples qui sont la divergence de Kullback-Leibler des distributions locales et la différence des seconds moments angulaires.
Enfin, dans le dernier chapitre, des considérations finales sur les techniques proposées sont données, avec des questions ouvertes et des travaux de recherche futurs.
2.4.Références
[1] Jian Guo Liu, and Philippa J. Mason, Essential Image Processing for GIS and Remote Sensing, Chichester: Wiley-Blackwell, 2009.
[2] Robert A. Schowengerdt, Remote sensing: Models and methods for image processing, 3rd ed., Tucson: Academic Press, 2007.
[3] John Robert Schott, Remote sensing: The image chain approach, 2nd ed., New York: Oxford University Press, 2007.
[4] R. Hellermann, “Growing demand for VHR satellite imagery for civilian use,” in Proc. International Commercial Remote Sensing Symposium, Washington, USA, Mar. 2010.