R E S E A R C H
Open Access
Application of quantitative proteomics to the
integrated analysis of the ubiquitylated and
global proteomes of xenograft tumor tissues
Stefani N Thomas
1*, Hui Zhang
1and Robert J Cotter
2ˆ
Abstract
Background:Post-translational modification by ubiquitin is a fundamental regulatory mechanism that is implicated in many cellular processes including the cell cycle, apoptosis, cell adhesion, angiogenesis, and tumor growth. The low stoichiometry of ubiquitylation presents an analytical challenge for the detection of endogenously modified proteins in the absence of enrichment strategies. The recent availability of antibodies recognizing peptides with Lys residues containing a di-Gly ubiquitin remnant (K-ε-GG) has greatly improved the ability to enrich and identify ubiquitylation sites from complex protein lysates via mass spectrometry. To date, there have not been any published studies that quantitatively assess the changes in endogenous ubiquitin-modification protein stoichiometry status at the proteome level from different tissues.
Results:In this study, we applied an integrated quantitative mass spectrometry based approach using isobaric tags for relative and absolute quantitation (iTRAQ) to interrogate the ubiquitin-modified proteome and the cognate global proteome levels from luminal and basal breast cancer patient-derived xenograft tissues. Among the proteins with quantitative global and ubiquitylation data, 91 % had unchanged levels of total protein relative abundance, and less than 5 % of these proteins had up- or down-regulated ubiquitylation levels. Of particular note, greater than half of the proteins with observed changes in their total protein level also had up- or down-regulated changes in their ubiquitylation level.
Conclusions:This is the first report of the application of iTRAQ-based quantification to the integrated analysis of the ubiquitylated and global proteomes at the tissue level. Our results underscore the importance of conducting integrated analyses of the global and ubiquitylated proteomes toward elucidating the specific functional significance of ubiquitylation.
Keywords:Ubiquitylation, Mass spectrometry, Proteomics, iTRAQ, Quantification, Xenograft, Tissue
Background
Ubiquitin is a 76 amino acid, 8.5 kDa protein that is highly conserved among eukaryotes [1–4]. Correspond-ingly, covalent post-translational modification (PTM) by ubiquitin entails the formation of an isopeptide bond be-tween the C-terminus of ubiquitin and the ε-amino group of the targeted Lys residue on the substrate pro-tein, although it is possible, but rare, for N-terminal
amines or Cys residues to be ubiquitylated as well [5]. Pro-tein substrates can be mono-ubiquitylated at one or more Lys residues or they can be poly-ubiquitylated by multiple ubiquitin chains whereby each of the seven Lys residues of ubiquitin can serve as a base to initiate chain formation. Ubiquitylation regulates the localization, activity, and sta-bility of protein substrates [3, 6] with functional conse-quences related to protein turnover, endocytosis, immune response, transcription, and DNA repair [7, 8].
Ubiquitylation has been implicated in the development and progression of cancer and neurodegenerative dis-eases [9, 10], and pharmacological inhibitors have been developed that target the ubiquitin-proteasome system for the treatment of cancer [11–13]. In the context of
* Correspondence:[email protected]
ˆDeceased
1Department of Pathology, Clinical Chemistry Division, Johns Hopkins
University School of Medicine, 1550 Orleans Street CRBII Room 3M06, Baltimore, MD 21231, USA
Full list of author information is available at the end of the article
cancer, ubiquitylation regulates tumor-suppressing and tumor-promoting pathways. Thus, the precise analysis of ubiquitylation is required for the identification of ubiqui-tylated substrates and components of the ubiquitylation pathway that can serve as novel drug targets in the de-velopment of highly selective therapeutic compounds. For example, a recent ubiquitylome study by Theurillat
et al. analyzed changes in the ubiquitin landscape in-duced by prostate cancer-associated mutations of an E3 ubiquitin ligase substrate-binding protein, thus providing a framework to elucidate the tumorigenic mechanisms linked to dysregulated ubiquitylation [14].
It has only been recently that advances in mass spec-trometry and the peptide-based affinity enrichment of the ubiquitylated proteome have permitted the large-scale mapping of ubiquitylation sites [15–22]. The peptide-based affinity enrichment of the ubiquitylated proteome entails the use of a K-ε-GG antibody that spe-cifically recognizes the di-Gly ubiquitin remnant that re-mains conjugated to Lys residues on substrate proteins following trypsin digestion [16, 22, 23]. K-ε-GG anti-bodies do not distinguish between ubiquitin and two ubiquitin-like proteins (UBLs) – NEDD8 and ISG15 – that contain C-terminal di-Gly motifs that are generated by trypsin cleavage [16]. However, for the current study, the di-Gly-modified proteome and K-ε-GG-containing peptides will be referred to as the ubiquitylated prote-ome and ubiquitylated peptides, respectively.
The majority of the published studies that entail the quantitative mass spectrometry-based analysis of ubiqui-tylation using anti-K-ε-GG antibodies have been con-ducted using cell lysate [16–20]. Although a study was recently published that quantified the ubiquitin-modified proteome regulated by transient forebrain ischemia in mouse brain tissue using a label-free quantification method [24], to date, there are no published studies of a quantitative analysis to determine the changes in en-dogenous protein ubiquitylation relative stoichiometry at the tissue proteome level.
The analysis of the protein ubiquitylation level can yield relevant biological insights that cannot be deter-mined from the ubiquitylation or global protein level alone. Prabakaranet al. proposed the concept of revers-ible PTM as a form of information processing [25]. Be-cause PTM substrate molecules can be either modified or unmodified, and the entire pool of substrate mole-cules is comprised of a mixture of both molecular states, the relative stoichiometry of the modified state is there-fore representative of the state of the population of the substrate molecule. Olsen et al. illustrated this concept in the context of phosphorylation site occupancy during mitosis [26].
The relative stoichiometry of the modified state of the population of substrate molecules is a function of the
PTM’s“writers”and“erasers”[27]. Ubiquitylation entails a highly regulated enzymatic cascade involving ubiquitin activating (E1), ubiquitin conjugating (E2), and ubiquitin ligating (E3) enzymes [6]. In addition to the E1, E2, and E3 enzymes that are considered “writers” of ubiquityla-tion, approximately 100 ubiquitylation “erasers” exist in the form of deubiquitylating enzymes [28]. Hence, com-plex enzymatic cascades regulate ubiquitylation.
Analyzing differences in relative abundance that are specifically attributable to ubiquitylation instead of the global protein level is an important step towards the de-termination of the functional relevance of ubiquitylation in the proteome of interest. Accordingly, in this study, we used a mass spectrometry-based quantitative prote-omic approach combined with the immunoaffinity en-richment of di-Gly-modified peptides to quantitatively analyze the relative stoichiometry of protein ubiquityla-tion in breast cancer patient-derived xenograft tissues using iTRAQ. We used basal and luminal human-in-mouse breast cancer patient-derived xenografts as two disparate tumor types from which we would expect to observe quantitative differences in global protein levels and ubiquitylation levels. Our integrated approach per-mitted the analysis of changes in relative abundance not only at the ubiquitylated protein level, but also at the global protein level. To our knowledge, this study is the first integrated quantitative mass spectrometry-based analysis of endogenous ubiquitylation relative stoichiom-etry in tissues.
Results and discussion
Quantitative approach to interrogate the ubiquitylated proteome of tissues
The goal of this study was to identify up- or down-regulated ubiquitylation sites on proteins with stable global relative abundance in basal and luminal breast cancer patient-derived xenograft tissue toward the characterization of ubiquitylation sites that could be involved in biological information processing. The xenografts were derived from breast cancer patients with poor prognosis and treatment-resistant disease [29]. Following protein extraction and trypsin digestion, peptides from each breast cancer patient-derived xenograft tumor tissue sample (two basal and two luminal xenograft tissue aliquots) were subjected to di-Gly ubiquitin remnant motif (K-ε-GG) immunoaffinity enrich-ment using an antibody that recognizes Lys residues that are modified with a di-Gly ubiquitin remnant (K-ε-GG).
(basal xenograft 2), iTRAQ-116 (luminal xenograft 1), and iTRAQ-117 (luminal xenograft 2) reagents from a 4-plex iTRAQ reagent kit, and they were subjected to LC-MS/ MS analysis.
Because the primary amine group of the di-Gly ubiqui-tin remnant on the target Lys of the substrate protein can be modified by iTRAQ reagents, in addition to the constant and variable modifications that were used for peptide and protein identification for the global prote-ome analysis, variable modifications of +258.1449 Da (mass of iTRAQ 4-plex reagent added to di-Gly ubiquitin remnant) and +114.0429 Da (mass of di-Gly ubiquitin remnant) were added to Lys residues when conducting database searches of the ubiquitylated proteome data. An-other consideration for the analysis of the ubiquitylated proteome data is that results from large-scale analyses of ubiquitin modified proteomes have indicated that trypsin, which has a strict sequence specificity [30], does not cleave at di-Gly-modified Lys residues [20, 21]. Hence, missed cleavage at di-Gly-modified Lys residues provides confidence for ubiquitylation site localization [31].
The enrichment selectivity of the ubiquitylated peptides was 80 %, as determined by the number of peptide-spectrum matches (PSMs) of ubiquitylated peptides (357) divided by the total number of PSMs of all identified pep-tides (450). In the absence of immunoaffinity enrichment, 0.02 % of the identified peptides were ubiquitylated, and only 2 ubiquitylated peptides were identified in common with the enriched samples: 1 polyubiquitin peptide with 4 PSMs, and 1 histone H2A.J peptide with 10 PSMs (data not shown). The remaining 8 ubiquitylated peptides iden-tified in the global dataset were ideniden-tified by 1 PSM. The very low yield of ubiquitylated peptides in the non-enriched samples supports the need for an enrichment step in the mass spectrometry-based analysis of the ubi-quitylated proteome of complex biological samples.
In the enriched dataset, the majority (99.7 %) of the ubiquitylated peptides had a charge ≥3+, which reflects the additional charge from the N-terminal amine on the di-Gly adduct from the C-terminal tryptic ubiquitin remnant. The average peptide yield after immunoaffinity enrichment was 5μg from an input of 3 mg of peptides.
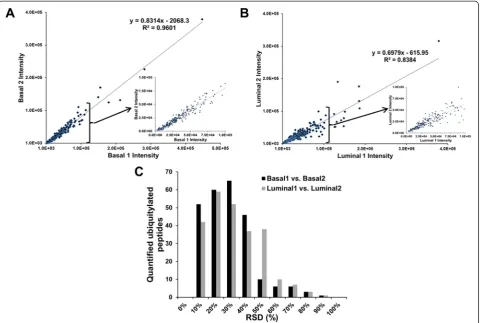
To evaluate the reproducibility of the quantified ubi-quitylated peptides of human origin in the luminal vs. basal breast tumor xenograft tissues, a linear regression analysis was conducted on the correlation of the iTRAQ reporter ion intensities in each luminal and basal xeno-graft tissue specimen. Ideally, the iTRAQ reporter ion intensities associated with the same peptide from both replicates would be nearly identical. The reproducibility of the two replicates (Basal 1 vs. Basal 2, Fig. 1a and Lu-minal 1 vs. LuLu-minal 2, Fig. 1b) was assessed based on the slope and R2 values of the linear regressions. The slope of the linear regression fit to the basal xenograft
replicates was 0.8314, whereas the slope of the linear re-gression fit to the luminal xenograft replicates was 0.6979. The 0.9601 and 0.8384 R2values of the linear regressions of the basal and luminal replicates, respectively, indicate acceptable reproducibility. Technical variability was fur-ther assessed by the distribution of the RSDs of the log2-transformed iTRAQ reporter ion intensities of the
quantified ubiquitylated peptides (Fig. 1c). The mean iTRAQ reporter ion intensity RSDs of the basal and lu-minal replicates were 23 % and 27 %, respectively, which indicates the degree of technical variability of the work-flow that we developed to quantify endogenous ubiqui-tylation in tissue samples.
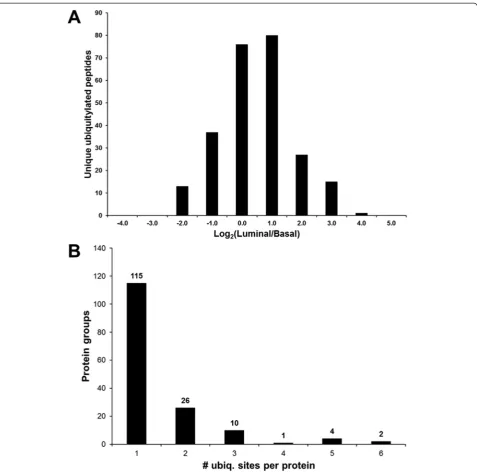
This iTRAQ-based quantitative proteomic approach to analyze the ubiquitin-modified proteome of luminal and basal breast tumor xenografts resulted in the identifica-tion of 327 unique ubiquitylated peptides at a 1 % false discovery rate and 319 unique non-ambiguously local-ized ubiquitylation sites that were quantified across all four samples (Additional file 1: Table S1). For each ubi-quitylated peptide, the average iTRAQ reporter ion in-tensity values of the luminal samples (116 and 117 labels) were divided by the average iTRAQ reporter ion in-tensity values of the basal samples (114 and 115) and log2
-transformed. The mean ratio of these peptides was -0.004 (log2(luminal/basal)) with a standard error of 0.06
indicat-ing that the data are approximately normally distributed. The distribution of the relative abundance ratios of the ubiquitylated peptides is shown in Fig. 2a.
Reflecting the mixed human and murine proteome backgrounds of the xenograft samples, 76 % of the identi-fied unique ubiquitylated peptides (249) were derived from 173 proteins of human origin. The identified ubiquitin-derived poly-ubiquitylated peptides were common toMus musculus polyubiquitin and Homo sapiens ubiquitin-40S ribosomal protein S27a; therefore, it could not be defini-tively determined whether these 6 peptides were of human or murine origin. Proteins with functions related to the ubiquitylation machinery (E2 ubiquitin conjugating en-zymes, E3 ubiquitin ligases, and proteasome subunits) and ubiquitin-like modifiers (NEDD8 and SUMO 2) were among the quantified ubiquitylated proteins.
suggestive of the well-known function of ubiquitylation in conferring site-specific differential modes of regula-tion on substrate proteins [2].
Ubiquitin was among the quantified ubiquitylated pro-teins. Six of its seven Lys residues (K6, K27, K29, K33, K48 and K63) (Additional file 1: Table S1) were quantified. These Lys residues are known to form poly-ubiquitin linkages, and the specific Lys residue that is involved in the linkage confers different cellular functions on the substrate proteins. K48 linkages are considered canonical signals for proteasomal degradation by the 26S proteasome [32]; K63 linkages are known to be involved in several non-proteolytic processes such as protein sorting, NF-κB signaling, kinase activation, and translational control [33]; and K6, K27, K29, and K33 linkages are hypothesized to have roles in DNA repair [34]. None of the six quantified ubiquitylation sites were up- or down-regulated, and the global pro-tein level of ubiquitin was stable [average (log2
(lum-inal/basal) = −0.03)].
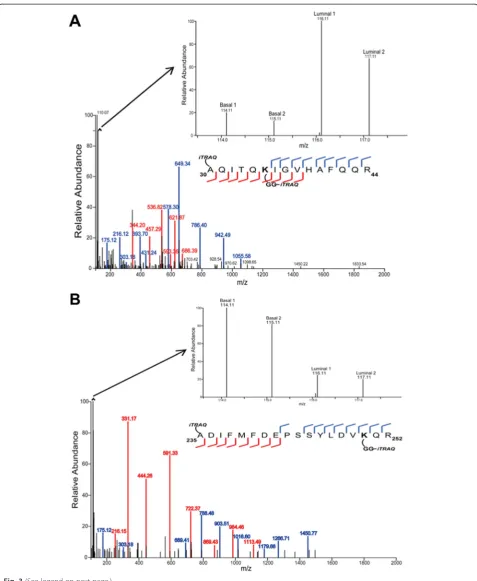
Representative peptides with up-regulated and down-regulated ubiquitylation sites are presented in Fig. 3. Up-regulated and down-Up-regulated peptides were considered as those with log2(luminal/basal) values that were greater
or less than the mean ± 2 s.d. of the distribution of the ra-tios for each dataset. Shown in Fig. 3a is a representative spectrum of an ubiquitylated peptide from ubiquitin-like protein ISG15 precursor with an up-regulated ubiquityla-tion site (K35) in the luminal compared to the basal tumor xenografts. The di-Gly ubiquitin remnant on K35 was la-beled with the iTRAQ reagent, and the relative abundance ratio (log2(luminal/basal)) was 2.69. Fig. 3b is a
representa-tive MS/MS spectrum of an ubiquitylated peptide from ATP-binding cassette sub-family E member 1 with a down-regulated ubiquitylation site (K250) in the luminal compared to the basal tumor xenografts. The di-Gly ubiquitin remnant on K250 was labeled with the iTRAQ reagent, and the relative abundance ratio (log2(luminal/basal)) was −2.36. The cognate
cleavage occurring at K250 was identified in the global proteome dataset with an average log2(luminal/basal)
relative abundance ratio of−1.03. Some of the ubiquity-lated peptides that were not identified in their cognate unmodified form contained di-Gly-modified Lys resi-dues at locations in the peptide that would result in tryptic peptides with m/z values below the mass spec-trometer’s detection range.
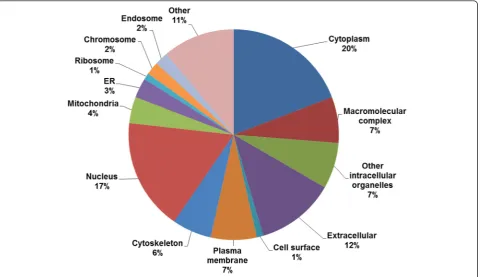
component distribution of the ubiquitylated proteins indi-cates that the enrichment was not biased toward ubiquity-lated proteins from a specific region of the cell.
Global proteome analysis yields the identification and quantification of hormone receptor and tumor antigen proteins commonly used to characterize luminal and basal breast cancer subtypes
The determination of differentially regulated ubiquityla-tion sites relies on analysis of not only the ubiquitylated proteome, but also the global proteome. To enable the analysis of the basal and luminal tumor xenograft global proteomes, 5 % of each protein digest was chemically labeled with 4-plex iTRAQ reagents 114 and 115 (basal xenografts 1 and 2, respectively) and 116 and 117 (luminal xenografts 1 and 2, respectively). An equivalent amount of peptides from the four samples was combined and sub-jected to offline bRPLC fractionation. The 96 bRPLC
fractions were concatenated in a non-contiguous man-ner to yield 24 fractions. Concatenating multiple frac-tions that have minimal overlap and cover a wide separation window improves the effective orthogonality of bRPLC first dimension separation to the second dimen-sion online RPLC separation [36]. These fractions were then subjected to LC-MS/MS analysis, which resulted in a total of 5,416 quantified protein groups with a minimum of two unique peptides. Reflecting the species origin of the samples, 78 % (4,244) were Homo sapiens proteins and 22 % (1,172) were Mus musculus proteins. A total of 46,393 unique peptides were quantified, among which 46,258 were quantified across all four xenograft tumor tis-sue samples.
The iTRAQ reporter ion intensity ratios were log2
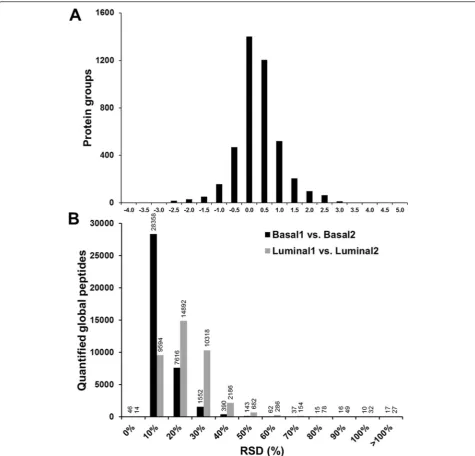
-transformed. The mean and standard error of the protein ratios was 0.00 ± 0.01 (Additional file 2: Table S2). The dis-tribution of the quantified proteins of human origin is (See figure on previous page.)
Fig. 3Representative spectra of quantified up-regulated and down-regulated ubiquitylated peptides.aUp-regulated ubiquitylated peptide from ubiquitin-like protein ISG15 precursor (aa30-44) with ubiquitylation of K35. The main figure shows the MS/MS spectrum and the corresponding ion coverage of the peptide to which the spectrum was assigned. The inset shows an enlarged region of the MS/MS spectrum (113.0–118.0 m/z) with the iTRAQ reporter ions. Based on the intensity of the 114.11 and 115.11 m/z (basal xenografts) and the 116.11 and 117.11 m/z (luminal xenograft) reporter ions, the peptide was determined to be up-regulated 2.69-fold in the luminal compared to the basal tumor sample.bDown-regulated ubiquitylated peptide from ATP-binding cassette sub-family E member 1 (aa235-252) with ubiquitylation of K250. The main figure shows the MS/MS spectrum and the corresponding ion coverage of the peptide to which the spectrum was assigned. The inset shows an enlarged region of the MS/MS spectrum (113.5–118.0 m/z) with the iTRAQ reporter ions. The peptide was determined to be down-regulated 2.36-fold in the luminal compared to the basal tumor samples
shown in Fig. 5a. The technical process replicate reprodu-cibility of the global proteome analysis workflow was assessed based on the RSD (%) of the iTRAQ reporter ion intensities of the quantified global peptides (Fig. 5b). The mean RSD of the iTRAQ reporter ion intensities of the quantified global peptides from the Basal samples was 8 %, whereas the mean RSD from the Luminal samples was 18 %. The lower RSDs of the quantified global pep-tides compared to the ubiquitylated peppep-tides reflect the differences in the workflows for these two proteomes.
Unlike the ubiquitylation workflow, the basal and lu-minal tissue-derived peptides for global analysis were combined immediately following iTRAQ labeling and prior to bRPLC fractionation and LC-MS/MS analysis, whereas the peptides for ubiquitylation analysis were not combined until after digestion, enrichment, and iTRAQ labeling.
Ubiquitin/ISG15 conjugating enzyme was the most abun-dant protein in the luminal xenografts (log2(luminal/
basal) = 3.36). Ubiquitin/ISG15 conjugating enzyme is an
Fig. 5Distribution of the quantified proteins from the global analysis workflow.aA total of 4,244 proteins of human origin were quantified with a mean relative abundance ratio of 0.00 ± 0.01, where 0.01 is the standard error of the mean. The ratios are reported as log2(luminal/basal).bAssessment
E2 ubiquitin-conjugating enzyme that functions to couple the activation of ubiquitin to downstream conjugation events, thereby influencing the fate of substrate proteins. Relative abundance is not directly related to enzymatic ac-tivity; therefore, the higher relative abundance of Ubiqui-tin/ISG15 conjugating enzyme in the luminal xenografts does not necessarily indicate an overall elevation of ubi-quitylation in these xenografts compared to the basal xe-nografts. There are 30 members of the E2 ubiquitin-conjugating enzyme family, 15 of which were quantified in this study. Whereas 6 of these E2 enzymes displayed higher levels of relative abundance in the luminal xeno-grafts, 9 exhibited higher levels of relative abundance in the basal xenografts. This result reflects the complexity of ubiquitylation that is partially attributable to the sub-strate specificity and ubiquitin linkage topologies of the 30 E2 conjugating enzymes and the >1000 E3 ligating enzymes in the ubiquitylation enzymatic cascade.
The depth of the proteome coverage permitted the identification and quantification of proteins that are clinically used to stratify breast cancer subtypes [37]: epidermal growth factor receptor isoform 1 (log2(luminal/
basal) = −1.04), cellular tumor antigen p53 (log2(luminal/
basal) = 2.06), membrane-associated progesterone receptor component 1 (log2(luminal/basal) =−0.44), and
membrane-associated progesterone receptor component 2 (log2
(lum-inal/basal) = 0.09). The expression of progesterone recep-tors (PR) is generally associated with luminal breast cancers (PR+), whereas triple negative or basal-like tumors are typically PR- [37, 38]. The quantification of PR indi-cates that it was present in the basal and luminal xeno-grafts. Not all basal-like tumors are triple negative, and it has been shown that much of the clinically observable plasticity and heterogeneity occurs within, and not across, the major biological breast cancer subtypes [37–39].
The molecular clinical subtype information for the pa-tients from whom the basal and luminal breast cancer xenograft models were derived indicate that the basal xenograft is HER2-, ER- and PR-, whereas the luminal xenograft (luminal A subtype) is HER2-, ER+ and PR+ [29]. However, these phenotypes were validated at pas-sage 1 (P1) for the xenografts, and the xenografts used for this study were acquired after P32 (basal) and P33 (luminal) following extensive expansion. No actively growing cancer has a static genome, and genetic drift is inherent in the xenografting process. Results from a late-exome expansion study to characterize genomic drift in the basal patient-derived xenograft used in this study indicated the presence of moderate genomic in-stability determined by the detection of several single nucleotide variations [29]. Furthermore, although the basal and luminal xenografts were clinically character-ized as being HER2-, Western blot data indicated low levels of HER2 protein expression [29].
Taken together, the results from our global proteomic analysis indicate that the workflow resulted in an ad-equate depth of coverage to permit the identification and quantification of hormone receptor and tumor anti-gen proteins that are typically used to classify breast cancer subtypes.
Differences in abundance of global proteins vs.
ubiquitylated proteins suggest differential ubiquitylation site occupancy
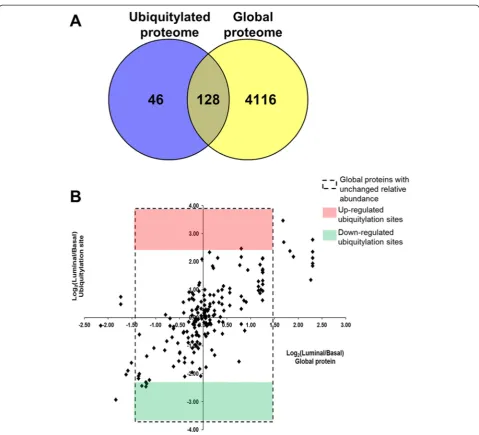
After analyzing the global and ubiquitylated proteomes of the basal and luminal breast tumor xenografts, we sought to analyze differences in relative abundance be-tween the global protein levels and the ubiquitylation sites on the proteins that were common to both work-flows. For this analysis, we only focused on the proteins of human origin. Among the 4,244 quantified proteins of human origin from the global analysis, 128 quantified proteins contained ubiquitylation sites that were quanti-fied in the ubiquitylation workflow (Fig. 6a). In this set of commonly identified proteins, 91 % (116) had un-changed levels of total protein relative abundance. Al-though there were 10 ubiquitylation sites on 9 proteins with up- or down-regulated relative abundance (6 and 4 ubiquitylation sites, respectively) in the set of commonly identified proteins, the global relative abundance levels of 5 of these proteins were also up- or down-regulated. Consequently, only 4 of the up- or down-regulated ubi-quitylation sites were localized to proteins with un-changed relative abundance (Table 1 and Fig. 6b, dashed rectangular box). This underscores the importance of analyzing total protein levels when determining differ-ences in ubiquitylation relative abundance towards the calculation of ubiquitylation site occupancy.
The down-regulated ubiquitylation sites were on NADPH-cytochrome P450 reductase (K613; mean ubiqui-tylated peptide RSDBasal1,Basal2; Luminal1,Luminal2= 24 %;
cognate global peptide not detected), bifunctional 3′ -phosphoadenosine 5′-phosphosulfate synthase 1 (K194; mean ubiquitylated peptide RSDBasal1,Basal2;
Luminal1,Lum-inal2= 12.5 %; cognate global peptide mean RSDBasal1,Basal2;
Luminal1,Luminal2= 8 %), and ATP-binding cassette
sub-family E member 1 (K250; mean ubiquitylated peptide RSDBasal1,Basal2; Luminal1,Luminal2= 10 %; cognate global
pep-tide mean RSDBasal1,Basal2; Luminal1,Luminal2= 9.5 %). The
up-regulated ubiquitylation site was on fatty acid synthase (K1142; mean ubiquitylated peptide RSDBasal1,Basal2;
Lumi-nal1,Luminal2= 27 %; cognate global peptide mean RSD
Basal1,-Basal2; Luminal1,Luminal2= 18 %). It is possible that these
Fig. 6Relative abundance of global proteome vs. ubiquitylated proteome.aAmong the 4,244 quantified proteins of human origin from the global analysis and the 173 quantified proteins of human origin from the ubiquitylation analysis, 128 proteins were identified in common.bAmong the 128 commonly identified proteins, 116 had unchanged total relative abundance levels (dashed rectangular box). Of these 116 proteins, 1 had up-regulated ubiquitylation levels in the luminal xenografts (red box) and 3 had down-regulated ubiquitylation levels in the luminal xenografts (green box)
Table 1Proteins of human origin with unchanged total relative abundance levels that have up-regulated (italic text) or down-regulated (bold text) ubiquitylation levels in the luminal vs. basal xenografts
Protein Accession Protein function Total protein relative abundance
Ubiquitylation site (relative abundance) NADPH-cytochrome P450 reductase
[Homo sapiens]
127139033 Electron donation from NADPH to microsomal P450 enzymes −
1.20 K613 (-2.47)
bifunctional 3′-phosphoadenosine
5′-phosphosulfate synthase 1 [Homo sapiens]
46094058 Mediation of two steps in sulfate activation pathway −
1.29 K194 (-2.44)
ATP-binding cassette sub-family E member 1 [Homo sapiens]
108773782 Transport of molecules across extra-and intra-cellular membranes −
1.19 K250 (-2.36)
fatty acid synthase [Homo sapiens] 41872631 Catalysis of palmitate synthesis into long-chain saturated fatty acids
Conclusions
In summary, we conducted an integrated iTRAQ-based quantitative proteomic analysis that enabled the interrogation of the relationship between global protein and endogenous ubiquitylation relative abundance using basal and luminal breast cancer patient-derived xenograft tissue. Among the proteins that were quantified in their global and ubiquity-lated forms, 91 % had unchanged levels of total protein relative abundance in the luminal vs. basal tumor xeno-grafts. Of the proteins with unchanged levels of global rela-tive abundance, 4 % (5) had either up- or down-regulated ubiquitylation relative abundance levels. The proteins with regulated ubiquitylation levels – NADPH-cytochrome P450 reductase, bifunctional 3′-phosphoadenosine 5′ -phos-phosulfate synthase 1, ATP-binding cassette sub-family E member 1, and fatty acid synthase–could have functional implications in the differentiation between the breast can-cer subtypes used for this study.
To date, there have been relatively few quantitative studies of endogenous ubiquitylation in tissue. Although a study using label-free quantification to analyze the ubi-quitylated proteome of rat brain tissue was recently pub-lished [41], to our knowledge, our study represents the first integrated quantitative analysis of endogenous glo-bal protein and ubiquitylation in tissue using iTRAQ la-beling. Variations of this approach could entail the use of metabolic stable isotope-labeling by amino acids in cell culture (SILAC)-labeled cell lines as spike-in stan-dards [42, 43] as opposed to chemical-based stable iso-tope labeling. A primary benefit of using SILAC-labeled cell lines as spike-in standards would be the potentially decreased technical variability because the biological samples could be combined at an early stage in the sam-ple preparation workflow. It has been shown that the error associated with multiple steps of sample prepar-ation in a SILAC-based comparative experiment entail-ing immunoaffinity enrichment can be limited to a reasonably low level to enable optimal quantitative ac-curacy [44].
The workflow described in our study permits the ana-lysis of global protein and ubiquitylation site relative abundance toward the determination of ubiquitylation site occupancy. Our observation that 61 % of the quanti-fied ubiquitylation sites were on proteins whose global relative abundance levels were up- or down-regulated underscores the importance of analyzing the modified and unmodified forms of ubiquitylation substrates in studies that are designed to identify ubiquitylation sites that have potential functional significance. Regulated ubiquitylation sites that occur on proteins whose global levels of relative abundance are also up-or down-regulated are sites that are not likely involved in bio-logical information processing. Rather, it is possible that the regulated ubiquitylation sites with functional
roles in biological information processing are those that occur on proteins with stable global relative abundance levels.
Methods
Chemicals and reagents
Dithiothreitol (DTT), 2-chloroacetamide, Tris-HCl, EDTA, aprotinin, leupeptin, PR-619, PMSF, and LC-MS-grade water were purchased from Sigma-Aldrich (St. Louis, MO). Ultra-pure urea, NaCl, dimethyl pimelimidate, LC-MS grade acetonitrile, trifluoroacetic acid (TFA), formic acid (FA), PepClean C18 spin columns and Empore C18 solid-phase extraction disks were purchased from Thermo Fisher Scientific (Fair Lawn, NJ). Sequencing grade modi-fied trypsin was purchased from Promega (Madison, WI). Sep-Pak SPE C18 cartridges (50 mg, 1 cc) were obtained from Waters (Milford, MA). iTRAQ 4-plex reagent kits were purchased from AB Sciex (Framingham, MA).
Tissue homogenization
Aliquots of frozen, powderized patient-derived xenograft tumors from established basal (WHIM2, passage 32) and luminal A (WHIM16, passage 33) breast cancer subtypes were obtained from the Washington University Clinical Proteomic Tumor Analysis Consortium (CPTAC) Prote-ome Characterization Center. The xenografts were raised subcutaneously in 8 week old NOD.Cg-PrkdcscidIl2rgtm1Wjl/
SzJ mice (Jackson Labs, Bar Harbor, Maine) as previously described [29, 45]. All animal procedures were reviewed and approved by the Institutional Animal Care and Use Committee at Washington University in St. Louis, MO.
Two aliquots of xenograft tumor tissue from basal subtype and two aliquots of xenograft tumor tissue from luminal subtype were used. Tissues were sonicated in denaturing buffer (8 M urea, 50 mM Tris-HCl pH 8,
150 mM NaCl, 1 mM EDTA, 50 μM PR-619, 1 mM
2-chloroacetamide) supplemented with protease inhibitors (2 μg/mL aprotinin, 10μg/mL leupeptin, 1 mM PMSF). One hundredμL denaturing buffer was added per 10 mg tissue. Lysates were sonicated and cleared by centrifuga-tion at 16,000 x g for 20 min at 4 °C.
Protein digestion and iTRAQ labeling
with 50 mM Tris-HCl, pH 8, trypsin was added at an enzyme-to-substrate ratio of 1:50 (wt/wt), and the diges-tion was allowed to proceed for 4 h at 37 °C with shaking. An additional aliquot of trypsin was added (1:50; wt/wt) for overnight digestion at 37 °C with shaking. Protease di-gestion was stopped by the addition of TFA to a final con-centration of 1 %, and the digests were subsequently desalted using 50 mg, 1 cc Sep-Pak SPE C18 cartridges (Waters). Sep-Pak SPE C18 cartridges were conditioned with 1 mL 100 % acetonitrile, followed by 1 mL 50 % acetonitrile/0.1 % TFA, and equilibrated with 2 mL 0.1 % TFA. The peptides were loaded onto the conditioned Sep-Pak SPE C18 cartridges, washed with 3 mL 0.1 % TFA and eluted with 0.5 mL 50 % acetonitrile/0.1 % FA. The A280nm-based concentration of the de-salted peptide
sam-ples was determined using a NanoDrop spectrophotom-eter (Thermo Fisher Scientific). Aliquots of each de-salted peptide sample (75 μg) were prepared and dried in a SpeedVac concentrator prior to iTRAQ labeling. Three mg aliquots of each de-salted peptide sample were pre-pared and dried by lyophilization using a vacuum freeze dryer (Labconco) prior to K-ɛ-GG peptide enrichment.
K-ε-GG peptide enrichment
The anti-K-ε-GG ubiquitin remnant motif antibody (component of the PTMScan® ubiquitin remnant motif kit, Cell Signaling Technology, Danvers, MA) was cross-linked with DMP according to the procedure detailed in [18]. Briefly, the antibody-coupled beads were washed three times with 1 mL of 100 mM sodium bicarbonate, pH 9. The beads were then re-suspended in 1 mL of 20 mM DMP in 100 mM sodium bicarbonate and incu-bated for 30 min at room temperature with end-over-end rotation. The cross-linking reaction was stopped by wash-ing the beads twice with 1 mL of 200 mM ethanolamine, pH 8 and incubating for 2 h at 4 °C with end-over-end ro-tation. The cross-linked antibody was washed three times with 1.5 mL of immunoaffinity purification (IAP) buffer (50 mM MOPS pH 7.2, 10 mM sodium phosphate, 50 mM NaCl).
Each dried 3 mg peptide aliquot was reconstituted in 1.5 mL of IAP buffer, and approximately 35 μg of the cross-linked anti-K-ε-GG ubiquitin remnant motif anti-body was added to each sample followed by incubation for 1 h at 4 °C with end-over-end rotation. The samples were washed twice with 1.5 mL of IAP buffer followed by three washes with PBS. Peptides were eluted by add-ing 50 μL of 0.15 % TFA and incubating at room temperature for 5 min. The elution procedure was re-peated once and the eluates were combined. Peptides were de-salted using 200μL C18 Stage Tips [47] packed with three C18 Empore extraction disks. De-salted pep-tides were dried in a SpeedVac concentrator.
Because the anti-K-ε-GG antibody that was used to en-rich for ubiquitin remnant motif-containing peptides does not recognize iTRAQ-labeled peptides, the iTRAQ labeling of the samples for the ubiquitylation analysis was con-ducted after anti-K-ε-GG enrichment. The iTRAQ labeling scheme was the same as the global samples: 114 (WHIM2 – basal tumor 1: aliquot P32–16), 115 (WHIM2 – basal tumor 2: aliquot P32–17), 116 (WHIM16–luminal tumor 1: aliquot P33–17), and 117 (WHIM16–luminal tumor 2: aliquot P33–18). The iTRAQ-labeled, K-ε-GG-enriched samples were combined, de-salted using PepClean C18 spin columns according to the manufacturer’s instructions and dried in a SpeedVac concentrator.
Basic reversed phase chromatography–global proteome analysis
For the global proteome analysis, 240 μg de-salted pep-tides were labeled with iTRAQ 4-plex 114 (WHIM2 – basal tumor 1: 60 μg), 115 (WHIM2 – basal tumor 2: 60 μg), 116 (WHIM16 – luminal tumor 1: 60 μg), and 117 (WHIM16–luminal tumor 2: 60 μg) reagents. Pep-tides were dissolved in 30μL of 0.5 M triethylammonium bicarbonate. SeventyμL of ethanol was added to each tube containing 1 U iTRAQ labeling reagent. After the peptides were added to the tubes containing the respective iTRAQ labeling reagent, the labeling reaction was allowed to proceed for 1 h at room temperature. The labeling reac-tion was terminated by hydrolysis of the iTRAQ reagents with the addition of 300μL 0.05 % TFA followed by incu-bation at room temperature for 30 min. The peptides were then mixed, dried in a SpeedVac concentrator and subse-quently de-salted using a 50 mg, 1 cc Sep-Pak SPE C18 cartridge and dried again in a SpeedVac concentrator.
Approximately 100 μg of the combined
iTRAQ-labeled sample was subjected to offline basic reversed phase liquid chromatography (bRPLC) using a 4.6 x 100 mm Zorbax Extend-1.8 μm C18 column (Agilent Technology, Santa Clara, CA) on an Agilent 1220 Infinity HPLC System. The solvent consisted of 10 mM ammo-nium formate (pH 10) in water as mobile phase A and 10 mM ammonium formate in 90 % ACN (pH 10) as mo-bile phase B. The separation gradient was set as follows: 2 % B for 10 min, 2 –8 % B for 5 min, 8 – 35 % B for 85 min, 35– 95 % B for 5 min, and 95 % B for 25 min. The 96 fractions were pooled in a non-contiguous manner into 24 fractions by combining fractions 1, 25, 49, and 73; 2, 26, 50, and 75, etc. The concatenated fractions were dried in a SpeedVac concentrator.
LC-MS/MS analysis
to a Dionex Ultimate 3000 RSLCnano system (Thermo Fisher Scientific) with a 75μm x 50 cm Acclaim PepMap RSLC 2 μm C18 separating column (Thermo Fisher Scientific) protected by a 100μm x 2 cm Acclaim Pep-Map100 5 μm C18 guard column (Thermo Fisher Sci-entific). The mobile phase flow rate was 300 nL/min and consisted of 0.1 % formic acid in water (A) and 0.1 % formic acid in 95 % acetonitrile (B). The gradient profile was set as follows: 2 –22 % B for 70 min, 22– 29 % B for 8 min, 29 –95 % B for 4 min, and 95 % B for 8 min. The mass spectrometer spray voltage was set at 2.2 kV. Full scan Orbitrap spectra (AGC 1x10⁶) were collected from 400–1800 m/z at a resolution of 30,000 with a maximum injection time of 10 ms followed by data-dependent HCD MS/MS (7,500 resolution, 35 % collision energy, 0.1 ms activation time, 100 ms max-imum injection time, 1x10⁴AGC) of the 10 most abun-dant ions using an isolation width of 2.0 Th. The minimum signal required to trigger an MS2 scan was 500, and the first mass value was fixed at 100 m/z. Charge state screening was enabled to reject the acqui-sition of MS/MS spectra for unassigned and singly charged precursor ions. A dynamic exclusion duration of 25 s was used.
MS data analysis
MS/MS spectra were searched with SEQUEST HT using Proteome Discoverer version 1.4 (Thermo Fisher) against a customized combined NCBI RefSeq Release 37 of
Homo sapiens and Mus musculus database with 55,415 entries (http://fenchurch.mc.vanderbilt.edu/misc/ 20111201-RefSeq-Human-37-Mouse-37-Trypsin.fasta). The precursor and fragment mass tolerances were set to 20 ppm and 0.05 Da, respectively. Enzymatic cleavage spe-cificity was set to fully tryptic with three missed cleavages allowed. For the global proteomic dataset, carbamido-methylation of cysteine and iTRAQ 4-plex modification of peptide N-termini were set as fixed modifications, and oxidation of methionine and iTRAQ 4-plex modification of Lys were set as variable modifications. The data were also searched against a decoy database (reversed protein sequences) and filtered using a 1 % false discovery rate. Only peptides with a search engine rank of 1 and protein groups identified by at least two unique (non-redundant) peptide sequences were considered. Protein ratios were normalized based on the mean ratio distribution of each dataset.
For the ubiquitylation dataset, to account for the add-itional amine group that is present on the–GG remnant of the ubiquitylated peptides that could be labeled by the iTRAQ reagent, a variable modification of +258.1449 Da on Lys (mass of iTRAQ 4-plex reagent and two Gly resi-dues) was included. GlyGly addition to Lys was also used as a variable modification. Four modifications per
peptide were permitted. The data were also searched against a decoy database (reversed protein sequences) and filtered with a 1 % false discovery rate. Only pep-tides with a search engine rank of 1 were considered. All spectra that were assigned to ubiquitylated peptides were manually validated. Di-Gly-modified Lys residues located on peptide C-termini were considered false positive identi-fications and were removed.
Peptide and protein quantification was based on the iTRAQ reporter ion intensities using Proteome Discoverer v.1.4. Only unique (non-redundant) peptide sequences were used for protein quantification. Although methionine residues are chemically unstable and prone to oxidation, peptides containing these amino acids (<1 % of the ubiqui-tylated peptides in our dataset) were not excluded from quantification. Unless otherwise noted, all quantification data refer to only peptides and proteins of human origin. Ubiquitylated peptide normalization was based on the mean ratio distribution of each dataset. Ubiquitylation sites or proteins with relative abundance ratios greater or less than the mean ± 2 s.d. of the distribution of ratios for each dataset were considered to be up- or down-regulated, respectively, in the luminal compared to the basal breast cancer tumor xenografts.
Gene ontology functional analysis
STRAP (Software for Researching Annotations of Proteins) [35] was used to determine the distribution of Gene Ontology cellular compartment terms in the ubiquityla-tion dataset.
Additional files
Additional file 1: Table S1.List of quantified ubiquitylated peptides from basal and luminal breast tumor xenografts subjected to anti-di-Gly ubiquitin remnant immunoaffinity enrichment. The log2 peptide ratio from each replicate is an average of all the quantified peptide-spectrum matches for a given peptide. CVs are reported for peptides quantified by >1 peptide-spectrum match. Peptides from human and murine proteins are included.
Additional file 2: Table S2.List of quantified proteins from global proteome analysis of basal and luminal breast tumor xenografts. Proteins of human and murine origin are included.
Abbreviations
K-ε-GG:Di-glycine remnant; MS: Mass spectrometry; GO: Gene ontology; bRPLC: Basic reversed phase liquid chromatography.
Competing interests
The authors declare that they have no competing interests.
Authors’contributions
Acknowledgments
This work was supported in part by the National Institutes of Health under grants and contracts from the National Cancer Institute: Clinical Proteomics Tumor Analysis Consortium (CPTAC, U24CA160036), the Early Detection Research Network (EDRN, U01CA152813 and U24CA115102), and R01CA112314; and from the National Heart, Lung and Blood Institute: Programs of Excellence in Glycosciences (P01HL107153) and Proteomic Center (N01-HV-00240). The authors gratefully acknowledge Sherri Davies and Matthew Ellis of the Washington University Clinical Proteomic Tumor Analysis Consortium (CPTAC) Proteome Characterization Center for providing the patient-derived xenograft tumor tissue.
Author details
1
Department of Pathology, Clinical Chemistry Division, Johns Hopkins University School of Medicine, 1550 Orleans Street CRBII Room 3M06, Baltimore, MD 21231, USA.2Department of Pharmacology and Molecular Sciences, Johns Hopkins University School of Medicine, Baltimore, MD 21205, USA.
Received: 19 December 2014 Accepted: 11 May 2015
References
1. Glickman MH, Ciechanover A. The ubiquitin-proteasome proteolytic pathway: destruction for the sake of construction. Physiol Rev. 2002;82:373–428. 2. Haglund K, Dikic I. Ubiquitylation and cell signaling. Embo J. 2005;24:3353–9. 3. Hershko A, Ciechanover A. The ubiquitin system. Annu Rev Biochem.
1998;67:425–79.
4. Mukhopadhyay D, Riezman H. Proteasome-independent functions of ubiquitin in endocytosis and signaling. Science. 2007;315:201–5.
5. McDowell GS, Philpott A. Non-canonical ubiquitylation: mechanisms and consequences. Int J Biochem Cell Biol. 2013;45:1833–42.
6. Pickart CM, Eddins MJ. Ubiquitin: structures, functions, mechanisms. Biochim Biophys Acta. 2004;1695:55–72.
7. Komander D, Rape M. The ubiquitin code. Annu Rev Biochem. 2012;81:203–29. 8. Weissman AM, Shabek N, Ciechanover A. The predator becomes the prey:
regulating the ubiquitin system by ubiquitylation and degradation. Nat Rev Mol Cell Biol. 2011;12:605–20.
9. Bennett EJ, Shaler TA, Woodman B, Ryu KY, Zaitseva TS, Becker CH, et al. Global changes to the ubiquitin system in Huntington’s disease. Nature. 2007;448:704–8.
10. Sacco JJ, Coulson JM, Clague MJ, Urbe S. Emerging roles of deubiquitinases in cancer-associated pathways. IUBMB Life. 2010;62:140–57.
11. Bedford L, Lowe J, Dick LR, Mayer RJ, Brownell JE. Ubiquitin-like protein conjugation and the ubiquitin-proteasome system as drug targets. Nat Rev Drug Discov. 2011;10:29–46.
12. Edelmann MJ, Nicholson B, Kessler BM. Pharmacological targets in the ubiquitin system offer new ways of treating cancer, neurodegenerative disorders and infectious diseases. Expert Rev Mol Med. 2011;13, e35. 13. Cohen P, Tcherpakov M. Will the ubiquitin system furnish as many drug
targets as protein kinases? Cell. 2010;143:686–93.
14. Theurillat JP, Udeshi ND, Errington WJ, Svinkina T, Baca SC, Pop M, et al. Prostate cancer. Ubiquitylome analysis identifies dysregulation of effector substrates in SPOP-mutant prostate cancer. Science. 2014;346:85–9. 15. Danielsen JM, Sylvestersen KB, Bekker-Jensen S, Szklarczyk D, Poulsen JW,
Horn H, et al. Mass spectrometric analysis of lysine ubiquitylation reveals promiscuity at site level. Mol Cell Proteomics. 2011;10:M110 003590. 16. Kim W, Bennett EJ, Huttlin EL, Guo A, Li J, Possemato A, et al. Systematic
and quantitative assessment of the ubiquitin-modified proteome. Mol Cell. 2011;44:325–40.
17. Udeshi ND, Mani DR, Eisenhaure T, Mertins P, Jaffe JD, Clauser KR, et al. Methods for quantification of in vivo changes in protein ubiquitination following proteasome and deubiquitinase inhibition. Mol Cell Proteomics. 2012;11:148–59.
18. Udeshi ND, Mertins P, Svinkina T, Carr SA. Large-scale identification of ubiquitination sites by mass spectrometry. Nat Protoc. 2013;8:1950–60. 19. Udeshi ND, Svinkina T, Mertins P, Kuhn E, Mani DR, Qiao JW, et al. Refined
preparation and use of anti-diglycine remnant (K-epsilon-GG) antibody enables routine quantification of 10,000s of ubiquitination sites in single proteomics experiments. Mol Cell Proteomics. 2013;12:825–31.
20. Wagner SA, Beli P, Weinert BT, Nielsen ML, Cox J, Mann M, et al. A proteome-wide, quantitative survey of in vivo ubiquitylation sites reveals widespread regulatory roles. Mol Cell Proteomics. 2011;10:M111 013284. 21. Wagner SA, Beli P, Weinert BT, Scholz C, Kelstrup CD, Young C, et al.
Proteomic analyses reveal divergent ubiquitylation site patterns in murine tissues. Mol Cell Proteomics. 2012;11:1578–85.
22. Xu G, Paige JS, Jaffrey SR. Global analysis of lysine ubiquitination by ubiquitin remnant immunoaffinity profiling. Nat Biotechnol. 2010;28:868–73. 23. Peng J, Schwartz D, Elias JE, Thoreen CC, Cheng D, Marsischky G, et al.
A proteomics approach to understanding protein ubiquitination. Nat Biotechnol. 2003;21:921–6.
24. Iwabuchi M, Sheng H, Thompson J, Wang L, Dubois LG, Gooden D, et al. Characterization of the ubiquitin-modified proteome regulated by transient forebrain ischemia. J Cereb Blood Flow Metab. 2014;34:425–32.
25. Prabakaran S, Lippens G, Steen H, Gunawardena J. Post-translational modification: nature’s escape from genetic imprisonment and the basis for dynamic information encoding. Wiley Interdiscip Rev Syst Biol Med. 2012;4:565–83. 26. Olsen JV, Vermeulen M, Santamaria A, Kumar C, Miller ML, Jensen LJ, et al.
Quantitative phosphoproteomics reveals widespread full phosphorylation site occupancy during mitosis. Sci Signal. 2012;3:ra3.
27. Goldbeter A, Koshland Jr DE. An amplified sensitivity arising from covalent modification in biological systems. Proc Natl Acad Sci U S A. 1981;78:6840–4. 28. Komander D, Clague MJ, Urbe S. Breaking the chains: structure and function
of the deubiquitinases. Nat Rev Mol Cell Biol. 2009;10:550–63. 29. Li S, Shen D, Shao J, Crowder R, Liu W, Prat A, et al.
Endocrine-therapy-resistant ESR1 variants revealed by genomic characterization of breast-cancer-derived xenografts. Cell Rep. 2013;4:1116–30.
30. Olsen JV, Ong SE, Mann M. Trypsin cleaves exclusively C-terminal to arginine and lysine residues. Mol Cell Proteomics. 2004;3:608–14.
31. Seyfried NT, Xu P, Duong DM, Cheng D, Hanfelt J, Peng J. Systematic approach for validating the ubiquitinated proteome. Anal Chem. 2008;80:4161–9.
32. Thrower JS, Hoffman L, Rechsteiner M, Pickart CM. Recognition of the polyubiquitin proteolytic signal. Embo J. 2000;19:94–102.
33. Ikeda F, Dikic I. Atypical ubiquitin chains: new molecular signals.‘Protein Modifications: Beyond the Usual Suspects’review series. EMBO Rep. 2008;9:536–42.
34. Polge C, Uttenweiler-Joseph S, Leulmi R, Heng AE, Burlet-Schiltz O, Attaix D, et al. Deciphering the ubiquitin proteome: limits and advantages of high throughput global affinity purification-mass spectrometry approaches. Int J Biochem Cell Biol. 2013;45:2136–46.
35. Bhatia VN, Perlman DH, Costello CE, McComb ME. Software tool for researching annotations of proteins: open-source protein annotation software with data visualization. Anal Chem. 2009;81:9819–23.
36. Yang F, Shen Y, Camp 2nd DG, Smith RD. High-pH reversed-phase chromatography with fraction concatenation for 2D proteomic analysis. Expert Rev Proteomics. 2012;9:129–34.
37. Network TCGA. Comprehensive molecular portraits of human breast tumours. Nature. 2012;490:61–70.
38. Hu Z, Fan C, Oh DS, Marron JS, He X, Qaqish BF, et al. The molecular portraits of breast tumors are conserved across microarray platforms. BMC Genomics. 2006;7:96.
39. Fan C, Oh DS, Wessels L, Weigelt B, Nuyten DS, Nobel AB, et al. Concordance among gene-expression-based predictors for breast cancer. N Engl J Med. 2006;355:560–9.
40. Warburg O. On the origin of cancer cells. Science. 1956;123:309–14. 41. Na CH, Jones DR, Yang Y, Wang X, Xu Y, Peng J. Synaptic protein
ubiquitination in rat brain revealed by antibody-based ubiquitome analysis. J Proteome Res. 2012;11:4722–32.
42. Geiger T, Cox J, Ostasiewicz P, Wisniewski JR, Mann M. Super-SILAC mix for quantitative proteomics of human tumor tissue. Nat Methods. 2010;7:383–5. 43. Ong SE, Blagoev B, Kratchmarova I, Kristensen DB, Steen H, Pandey A, et al.
Stable isotope labeling by amino acids in cell culture, SILAC, as a simple and accurate approach to expression proteomics. Mol Cell Proteomics. 2002;1:376–86.
44. Zhang G, Fenyo D, Neubert TA. Evaluation of the variation in sample preparation for comparative proteomics using stable isotope labeling by amino acids in cell culture. J Proteome Res. 2009;8:1285–92.
46. Nielsen ML, Vermeulen M, Bonaldi T, Cox J, Moroder L, Mann M.
Iodoacetamide-induced artifact mimics ubiquitination in mass spectrometry. Nat Methods. 2008;5:459–60.
47. Rappsilber J, Mann M, Ishihama Y. Protocol for micro-purification, enrichment, pre-fractionation and storage of peptides for proteomics using StageTips. Nat Protoc. 2007;2:1896–906.
Submit your next manuscript to BioMed Central and take full advantage of:
• Convenient online submission • Thorough peer review
• No space constraints or color figure charges • Immediate publication on acceptance
• Inclusion in PubMed, CAS, Scopus and Google Scholar • Research which is freely available for redistribution