Application of GIS Technology and Sensor Technology in
Tunnel Deformation Mapping
https://doi.org/10.3991/ijoe.v13i05.7059
Xiangfa Liu
Weifang University of Science and Technology, Shandong, China [email protected]
Abstract—The purpose of this study is to enhance the role of sensor
tech-nology in tunnel deformation mapping. The method is to combine RTK (real-time dynamic difference) algorithm with GIS (Geographic Information Sys-tems) technology. After coordinating transformation of the deformed data that was collected from the test tunnel, the HGMonitor was then employed to solve the problems. The results show that the horizontal accuracy of tunnel defor-mation monitoring is about 5mm, and the elevation accuracy is about 15mm, which can meet the actual requirements. We also verified that the test data meets the requirements for tunnel deformation mapping accuracy, which can help to improve the safety and reliability of the tunnel structure.
Keywords—GIS technology, sensor technology, real-time dynamic difference
(RTK), tunnel deformation
1
Introduction
With the continuous development of railways and highways in China, tunnels have made great progress as an indispensable underground project. However, the tunnel construction technology is still far behind other countries, and owing to its long histo-ry, a considerable proportion of the tunnel has been damaged to varying degrees In view of the tunnel lining structure deformation, crack, block and seepage, the real-time monitoring of tunnel health not only can improve the safety and reliability of the structure, but also can be used for early warning, so as to avoid the occurrence of accidents and to protect the lives and property of the people. Therefore, in order to nip in the bud, we need to establish a comprehensive early warning mechanism and to carry out real-time all-round monitoring of the structure of the project. However, the current monitoring model is still in the traditional way, or only limited to a certain level of technical improvement, which is far less than the actual operation of the pro-ject management needs.
monitor-ing, and combine GIS technology with real-time dynamic difference (RTK) to im-prove the accuracy of tunnel deformation mapping.
2
State of the art
In recent years, with the development of satellite measurement technology and the development of geographic information science, the technical means of acquiring spatial information has been progressing. At present, the powerful spatial information acquisition and management capabilities of GPS and GIS technology play an increas-ingly important role in the fields of surveying and mapping, resource exploration and transportation [1-2]. As a new technology, the satellite positioning network RTK technology, with its unique advantages, can obtain the three-dimensional coordinates of high precision and high sampling frequency all day long. The sampling frequency of the receiver has reached 10-20HZ, and the positioning accuracy can reach millime-ter level, which is widely used in the field of deformation monitoring, especially in the application of tunnel deformation monitoring [3-5]. The GIS technology combines the spatial data and the attribute data management as a whole. The GIS technology can not only manage the geographic spatial data and attribute data of tunnel, but also can visualize the deformation points. Therefore, the combination of satellite position-ing technology and GIS is to apply in the tunnel deformation monitorposition-ing, which can achieve real-time monitoring of tunnel deformation, spatial positioning and visualiza-tion [6-8].
Real-time dynamic difference method (RTK) is a new commonly used GPS map-ping method, which is one of the most important applications and research fields of GPS, used to obtain the real-time position information of any moving target by build-ing a wireless communication link for data transmission between the reference station and rover. It has the advantages of high operation efficiency, high operation automa-tion, high integration degree, low operating conditions, easy operaautoma-tion, easy to use and strong data processing capability. Its application is very strong, and it is widely used in various industries of surveying and mapping, such as project lofting, topo-graphic mapping, survey and design, land demarcation, cadastral survey, real estate side painting, geological prospecting and other fields. The measurement accuracy of RTK technology has always been the focus of surveying experts and scholars. At present, GPS RTK technology has been widely used in survey field, but RTK survey-ing can be affected by more complex error than static surveysurvey-ing, so the suitable con-trol measure must be taken in order to ensure the reliability of RTK surveying achievement [9].
we can quickly and comprehensively obtain the complete data of the tunnel surface, thus overcoming the deficiency of the traditional method [10]. Aiming at the short-comings of tunnel deformation, Kun, T (2016) uses the s-spline curve to fit the tunnel section scan data, and calculates the Hausdorff distance between the two-stage curve segment. It uses the overall deformation information of each part of the curve section to reflect the deformation of the section. At the same time, according to the character-istics of subway tunnel section scanning data, he proposes the s spline curve fitting of the main point selection method and the non-section information removal method [11]. Based on the monitoring method of tunnel deformation, Gan (2016) proposes a method to extract the deformation by means of the coordinate migration of the nodes on the central axis, and the central axis node is extracted by the segment fitting meth-od. This method gives the implementation steps of tunnel deformation monitoring using 3D laser scanning [12].
In summary, the above studies cannot accurately measure the cross-section of the tunnel. In order to enhance the role of sensor technology in tunnel deformation map-ping, we combine RTK (real-time dynamic difference) algorithm with GIS (Geo-graphic Information Systems) technology. After coordinate transformation of the deformed data that is collected from the test tunnel, the HGMonitor is used to solve it. The results show that the horizontal accuracy of tunnel deformation monitoring is about 5mm, and the elevation accuracy is about 15mm, which can meet the actual requirements. We have verified that the test data meets the requirements for tunnel deformation mapping accuracy, which helps to improve the safety and reliability of the tunnel structure.
3
Methods
3.1 GIS (Geographic Information Systems)
GIS (Geographic Information Systems), also known as geographic information system, is a comprehensive discipline combining with geography and cartography, and has been widely applied in different fields. GIS is an information system that acquires, stores, analysis and displays spatial data. A geographic information system is a kind of information system space professional form of data management system. In a strict sense, this is a computer system with centralized, storage, manipulation, and display of geographic reference information, for example, according to the loca-tion of the data in the database to identify the data, it is generally considered that the entire GIS system including the operator and the input system data.
The data collection and editing of GIS is that the operation of the layer. According to certain requirements, it usually uses effective tools and means convert field meas-urement data, map elements, photo information and other space and attribute data into a (x, y) coordinates that the computer can identify.
vector data and raster data. GIS database cannot only manage the spatial data, but also has the DBMS function to manage the attribute data.
GIS can manage different types of data. Before the data is unified, it must be in ac-cordance with certain standards and formats for data processing and transformation. The main data processing tasks and contents include: Data transformation (data trans-formation is the use of certain mathematical formulas and models of data in the math-ematical form of the conversion, including projection transformation, scale scaling, image correction, etc.), data refactoring (data refactoring is the use of certain tools in the geometry of the structure of the conversion, including data splicing, compression, interception and structure type conversion, etc.), and data extraction (data extraction is the use of certain conditions will be the complete set of data extraction of its subset, including data type selection, Boolean extraction, data window, spatial interpolation, etc.).
Spatial statistics and analysis is a unique feature of GIS, which is a tool for deter-mining the relationship between spatial geography elements. It mainly includes the following: (1) topological superposition. Topological superposition is to overlay lay-ers with different attribute attributes in the same region, and to form new spatial at-tribute characteristics, which can give new spatial atat-tribute feature retrieval query, map update, splicing and tailoring, and model application analysis. (2) buffer estab-lishment. Buffer is one of the most basic spatial analysis functions of GIS. It is to set up buffer polygons according to the requirements of various types of elements, such as point, line and surface of spatial geography entity, and to determine the spatial distance relationship among different geographical elements according to polygons. (3) digital terrain analysis. GIS provides the functions of constructing DEM (digital elevation model) and related terrain analysis, including slope, slope, valley line, ridge line, surface roughness, surface area, volume, profile and visual analysis, and this provides basic data for geoscience research decisions and engineering design. (4) spatial set analysis. Spatial set analysis is the use of the given conditions for geo-graphical data Boolean logic operations.
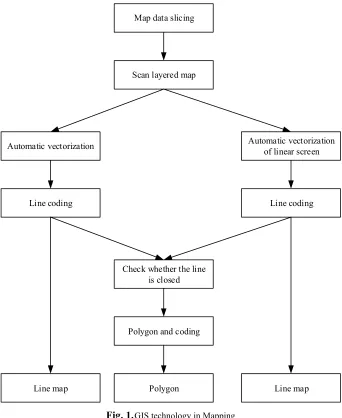
By means of GIS software, the data is processed and analyzed to generate new ge-ographic information. The gege-ographic information is usually displayed in the form of a map.as shown in Figure 1.
3.2 Real-time dynamic difference method (RTK)
the suitable control measure must be taken in order to ensure the reliability of RTK surveying achievement.
Map data slicing
Scan layered map
Check whether the line is closed
Automatic vectorization of linear screen Automatic vectorization
Line coding Line coding
Polygon and coding
Polygon
Line map Line map
Fig. 1.GIS technology in Mapping
used, the difference is composed of poisoning error and coordinate transformation error. In the Precise positioning of GPS, whether the detection and reparation for cycle slips of carrier phase is feasible or not it will affect the precision of positioning results directly, especially in the RTK. GPS carrier phase surveying technique has been developed from static, fast static to real time kinematic (RTK) positioning, which changed the acquiring way of spatial information and enlarged the area of GPS application. The way it works is that there are at least two simultaneous GPS receiv-ers (one base station, running on the flow), and use the carrier phase difference tech-nique to process the difference between the two station carrier phase observations in real time. The forensic station transmits its observation and station coordinate infor-mation to the rover through the data link. The rover not only receives the data from the base station through the data link, but also collects the GPS observation data. In the system, the real-time location results of the mobile station are obtained by the differential observation.
According to the working principle of RTK measurement, and reference to the rel-evant research literature, it shows that the accuracy of RTK measurement is related to the selection of the reference station, the selection of the coordinate transformation parameters, the selection of the observation time, the characteristics of the equipment and so on, which has significant characteristics.
1.The accuracy of the RTK measurement accuracy is reflected in the baseline solu-tion accuracy of the reference stasolu-tion and the mobile stasolu-tion, which has a systemat-ic influence on the selection of conversion parameters, the selection of equipment and the status of the satellite.
2.The measurement error of RTK is directly related to the distance between two sta-tions (base station and the flow station). The smaller the pitch, the higher the accu-racy, and the greater the spacing, the lower the accuracy.
3.The RTK measurement error and the distance between two stations are nonlinear. The spacing is limited, the accuracy is not changed, and the distance is more than this range. The farther the distance, the lower the accuracy.
According to the characteristic analysis of RTK lateral error, the relative error of the baseline distance based on the exponential function is obtained by inverting the comparison of the mathematical function. It has a good correlation and can reflect the accuracy of RTK reasonably.
Set the RTK to measure the baseline distance (X) is the x-axis, and the relative er-ror ( ) between the coordinate inverse distance and the measured distance
is the y-axis, then there are:
(1)
(2)
Set , then there are:
(4)
(5)
Thus it can be seen that, through the least squares principle, we can solve the mod-el parameters u and h, so we can get the mathematical modmod-el formula (1) of the rmod-ela- rela-tive accuracy. In its relarela-tive error, the error m is:
(6)
It can be seen that the mathematical model of the relative measurement accuracy of RTK baseline is:
(7)
3.3 Coordinate system conversion
According to the geographical location and existing data of Yunnan Province, the coordinate system of geography data is used in Xi'an 80 coordinate system. The pro-jection system is selected by Albers propro-jection (double standard latitude and other area conic projection). The model of Albers projection is as follows:
(8)
The plane coordinate is:
(9) According to the conditions of the area conic projection:
(10)
Then, there is:
(11)
C
-
Mrd
2
C
-
S
2
2
!
"
!
#
=
$
=
(12)In the formula:
-weft projection radius; -projection constant; -difference of longitude;
-the projection radius of the weft ; -integral constant;
-the trapezoidal area of 1 radian longitude difference and latitude dif-ference on ellipsoid surface;
The geographic data from the study area are derived from the highway data updat-ing system of Yunnan Province. The basic geographical data includes the administra-tive divisions (to the county level), rivers (to five level), residential (to counties) and highways; and the thematic geography data includes tunnels, service area, toll sta-tions, entrances and exits, weather stasta-tions, governance super stasta-tions, road mainte-nance stations and monitoring points.
The BDS uses the Chinese Geodetic Coordinate System (CGCS2000), and the GPS uses the wGS-84 coordinate system. In the tunnel deformation monitoring, the information collected by the satellite receiver is transmitted to the data center through the wireless network in real time. Then we carry out the calculation and analysis. In this paper, we use a GNSS (Global Satellite Navigation System) deformation moni-toring data calculation software HCMonitor that Shanghai Huaxing Navigation Tech-nology Co., Ltd. developed to carry out the data solution.
4
Experiment
In the analysis of the test data accuracy, due to the deflection of the tunnel in the case of the load will be deformed, we try to select the tunnel itself and the impact of the external environment of small changes in the measured points. Therefore, this paper chooses the data of the 3 # tunnel top point as the test data, and estimates the accuracy of the data by the average deviation (AVEDEV).
The average deviation refers to the individual measurements and the average dif-ference of the sum of absolute value, divided by the number of measurements, it can reflect the trend of concentration measurement data, and can embody the difference between the measured value and the average value, so as to give expression to the level of data accuracy.
(13)
individual measurements.
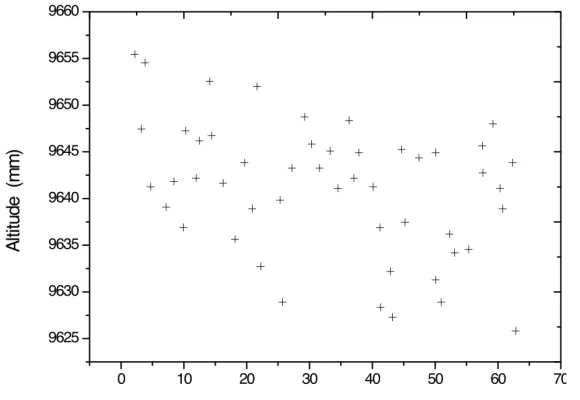
Using the formula to take the original solution after the data bit and decimal place (unit: m), convert to mm, and remove the data in the X (red), Y (blue), elevation (green) of the abnormal value, we do the following analysis:
(1) make the scatter plot of X, Y, elevation point, as shown in Figure 2 and Figure 3;
(2) according to the actual data, the percentage of abnormal data
is: .
(3) the mean deviation of the longitude, latitude and elevation values is: X deviation:
Y deviation:
the levation deviation:
According to the calculated results, it is concluded that the horizontal accuracy of tunnel deformation monitoring is about 5mm, and the elevation accuracy is about 15mm, which can meet the actual requirements.
!"#$ !"#% !"&$ !"&% !"'$ !"'% !"($ )"%%
)"#$ )"#% )"&$ )"&% )"'$ )"'% )"($
*
.
Fig. 3. The elevation value scatter plot
5
Conclusion
The large-scale engineering safety monitoring needs to use the Internet of Things thought, and combine with the global navigation and positioning system, total station, laser scanner, sensor, communication and computer technology, in order to achieve intelligent monitoring and management of objects. In this paper, we mainly study the application of GIS technology and sensor technology in tunnel deformation monitor-ing, and combine GIS technology with real-time dynamic difference (RTK) to im-prove the accuracy of tunnel deformation mapping. It is embodied that the defor-mation monitoring data collected from the test tunnel is solved by HGMonitor. The results show that the horizontal accuracy of tunnel deformation monitoring is about 5mm, and the elevation accuracy is about 15mm, which can meet the actual require-ments. Finally, we have verified that the test data can meet the requirements for tun-nel deformation mapping accuracy.
6
References
[1]Borges, R.C., Dos Santos, F.V., Caldas, V.G. and Lapa, C.M.F. (2015). Use of geographic information system (GIS) in the characterization of the Cunha Canal, Rio de Janeiro, Bra-zil: effects of the urbanization on water quality.Environmental Earth Sciences, 73(3), pp.1345-1356. https://doi.org/10.1007/s12665-014-3493-1
Prospective Cohort Study.Clinical Infectious Diseases, 60(5), pp.741-749. https://doi.org/10.1093/cid/ciu871
[3]Devkota, K.C., Regmi, A.D., Pourghasemi, H.R., Yoshida, K., Pradhan, B., Ryu, I.C., Dhital, M.R. and Althuwaynee, O.F. (2013). Landslide susceptibility mapping using cer-tainty factor, index of entropy and logistic regression models in GIS and their comparison at Mugling–Narayanghat road section in Nepal Himalaya. Natural hazards, 65(1), pp.135-165. https://doi.org/10.1007/s11069-012-0347-6
[4]Donghui, W., & Linya, T. (2011). Application of GPS-RTK in map control surveying of Jiyun river and its precision analysis. Geotechnical Investigation & Surveying, 10, 012. [5]LI, F. S., & YAO, Z. M. (2012). Discussion on the Application of RTK Technology in
Ca-dastration [J]. Geomatics & Spatial Information Technology, 1, 043.
[6]Moon, S., Lee, S.G., Kim, M. and Joo, D. (2014). Assessment and Reliability Validation of Lane Departure Assistance System Based on DGPS-GIS Using Camera Vision. Trans-actions of the Korean Society of Automotive Engineers,22(6), pp.49-58. https://doi.org/10.7467/KSAE.2014.22.6.049
[7]Nampak, H., Pradhan, B. and Manap, M.A. (2014). Application of GIS based data driven evidential belief function model to predict groundwater potential zonation. Journal of Hy-drology, 513, pp.283-300. https://doi.org/10.1016/j.jhydrol.2014.02.053
[8]Pijanowski, B.C., Tayyebi, A., Doucette, J., Pekin, B.K., Braun, D. and Plourde, J. (2014). A big data urban growth simulation at a national scale: configuring the GIS and neural network based land transformation model to run in a high performance computing (HPC) environment. Environmental Modelling & Software, 51, pp.250-268. https://doi.org/10.1016/j.envsoft.2013.09.015
[9]Pourghasemi, H.R., Moradi, H.R., Aghda, S.F., Gokceoglu, C. and Pradhan, B. (2014). GIS-based landslide susceptibility mapping with probabilistic likelihood ratio and spatial multi-criteria evaluation models (North of Tehran, Iran). Arabian Journal of Geosciences, 7(5), pp.1857-1878. https://doi.org/10.1007/s12517-012-0825-x
[10]Tapete, D., Morelli, S., Fanti, R., & Casagli, N. (2015). Localising deformation along the elevation of linear structures: An experiment with space-borne InSAR and RTK GPS on the Roman Aqueducts in Rome, Italy. Applied Geography, 58, 65-83. https://doi.org/10.1016/j.apgeog.2015.01.009
[11]Kun, T. A. N. G. "Tunnel Deformation Monitoring Method Based on 3D Laser Scanning." Geospatial Information 4 (2016): 032.
[12]Gan, Chuang, and Yong Lei. "Tunnel deformation monitoring based on laser distance measuring and vision assistant." Mechatronic and Embedded Systems and Applications (MESA), 2016 12th IEEE/ASME International Conference on. IEEE, 2016. https://doi.org/10.1109/mesa.2016.7587157
7
Author
Xiangfa Liu is with Weifang University of Science and Technology, Shandong, China ([email protected]).