Proposed Intelligent Pre-Processing Model of
Real-Time Flood Forecasting and Warning for
Data Classification and Aggregation
https://doi.org/10.3991/ijoe.v13i11.7382
Marouane El Mabrouk!!", Salma Gaou
Abdelmalek Essaadi University, Tangier, Morocco
Abstract—A wireless sensor network is a network that can design a self-organizing structure and provides effective support for several protocols such as routing, locating, discovering services, etc. It is composed of several nodes called sensors grouped together into a network to communicate with each other and with the base stations. Nowadays, the use of Wireless sensor networks in-creased considerably. It can collect physical data and transform it into a digital values in real-time to monitor in a continuous manner different disaster like flood. However, due to various factors that can affect the wireless sensor net-works namely, environmental, manufacturing errors hardware and software problems etc... It is necessary to carefully select and filter the data from the wireless sensors since we are providing a decision support system for flood forecasting and warning. In this paper, we presents an intelligent Pre-Processing model of real-time flood forecasting and warning for data classification and ag-gregation. The proposed model consists on several stages to monitor the wiless sensors and its proper functioning, to provide the most appropriate data re-ceived from the wireless sensor networks in order to guarantee the best accura-cy in terms of real-time data and to generate a historical data to be used in the further flood forecasting.
Keywords—wireless sensor networks, multi-agent systems, data, classification, aggregation
1
Introduction
Flood disaster is the rise of watercourse waters, it is due to precipitation in large quantities, to which can be added a soil impermeable or became impermeable due to a drought important: the soil no longer absorbs the quantity of water that reaches it [1]. However, this may also be accentuated by direct and indirect causes like drainage, soil waterproofing, climate change etc. [2]. Nowadays, facing floods become a chal-lenge for humans, that’s why humans tried to anticipate and to forecast floods before its incidence in order to take all necessary precautions.
scientific and industrial communities. Thanks to its various advantages, this technolo-gy has been able to establish itself as an essential actor in the current network archi-tectures [3]. In order to overcome floods, researchers have tried to obtain and acquire physical data in an automatic way in real-time. Thanks to this need, now we can bene-fit of the wireless sensors networks.
A wireless sensor network is a network composed of a set of embedded processing units, called "sensors", communicating via wireless links [4]. These wireless sensors are equipped with standard transmitters measuring instruments that convert the sig-nals from radio transmission in process control instruments [5]. Despite its many advantages, wireless sensors networks has still major problems in terms of data acqui-sition and processing [6].
The classification approach was among the most suitable solutions to overcome this problem. Data classification is an approach that consists on organizing data into categories and into same specification [7]. Thanks to this process, data become easier to retrieve and to access. This approach requires tagging data in order to make easy the searching, eliminating duplication and getting the most accurate data [8].
The wireless sensor networks, the wireless communication and the data classifica-tion approach has significantly improved with the appearance and the utilizaclassifica-tion of the multi-agent systems [9]. A multi-agent system is an environment that has multiple agents communicating and collaborating between them to achieve the final result in a distributed way [10]. Thanks to the distribution property, that has the multi-agents systems, the WSN could benefit of this property to do complex processing and to do the classification process.
In this paper, we will present a new proposed intelligent pre-processing model of real-time flood forecasting and warning data received from the wireless sensors in order to do the classification and the aggregation of data using multi-agents system.
The rest of this paper is organized as follow:
The section 2 introduces the proposed model for classification and aggregation in wireless sensor networks by other researchers in the literature. The section 3 presents our new proposed intelligent pre-processing model of real-time flood forecasting and warning for data classification and aggregation, which consists on several stages to do this process. The section 4 introduces the design and the implementation of our pro-posed model. The results are presented in section 5, finally the Conclusion, and the future work in Section 6.
2
Related Work
There are many researches in the literature presented by other researchers in the field of the data classification in wireless sensor networks.
In [12], the authors proposed a new hierarchical clustering algorithm based on spectral classification in order to get accurate data and extend the lifetime and the energy of the wireless sensors. This algorithm has to stages; the first stage is for di-viding and partitioning the wireless sensors into clusters, which contains some of sensors of the WSN. The second stage is for selecting a cluster head according to the energy of the sensor and its distance from the base station in order to communicate with the latter. The authors mentioned that using their algorithm reduce effectively the energy consumption of the sensor nodes and improve their lifetime according to the simulation and the results that they made.
In [13], the authors proposed a new adaptive preprocessing model for managing the received streaming data using a preprocessor and a predictor in order to increase the forecasting accuracy. The system two units, PCA (Principal Component Analysis) as preprocessor and Hyperbolic Hopfield Neural Network (HHNN) as predictor. Ac-cording to the authors, by using this model, it provides an efficient and adaptive pre-processing of streaming data.
In [14], the authors proposed an adaptive technique for classification process to re-duce the energy consumption of the sensor nodes and improve their lifetime. Accord-ing to the authors, the strength of their proposed technique is that the functions are aware of the environmental situation changes. The authors proposed also an adaptive model for the acquisition and the utilization of the sensor data.
In [15], the authors proposed model that combines three different methods of ma-chine learning, which are Parzen Windows, Identifying Densitybased Local Outliers and Outlier Detection With Active Learning for classifying data received from the wireless sensors to overcome the outlier fault in the wireless sensor networks. The authors made the validation and the simulation using real data acquired from motes deployed in an actual living lab.
In [16], the authors proposed a classifier for the Human activity recognition sys-tems (HAR) using hybrid classification. In their paper, they presented the classifica-tion techniques (Un-supervised and the supervised) used to classify data received from the sensors placed in the human body to identify the activities made by these human. The authors made a comparison between the different presented classifiers presented in their paper with their proposed classifier in terms of accuracy. According to the authors, the results made showed that their proposed classifier is more accurate and efficient compared to the classification approaches in the literature.
3
Proposed Intelligent Pre-Processing Model of Real-Time
Flood Forecasting and Warning for Data Classification and
Aggregation [17]
stored in the database. In the next section, we will describe and detail the different stages of this proposed model.
3.1 Sensor Verification Stage
This stage consists of identifying which sensors are not working before beginning the classification phase. This process ensures the proper functioning of the sensors; if any sensor is broken, the system sends warning messages, text messages (SMS) and emails to managers advising them to repair or replace the sensors, which requires contacting the maintenance service. The verification agent is responsible for the pro-cess of verification and for monitoring the sensors’ functioning. They are also re-sponsible for sending ACL messages to the agents of the second stage, the classifica-tion stage, to trigger it.
3.2 Data Aggregation and Classification Stage
In this stage, three agents are responsible for the classification process, the Rainfall Agent, the Runoff Agent and the Water Level Agent. Each agent calculates a square matrix using a proposed formula to perform the comparison and classification as follows:
2 1
3 1 3 2
4 1 4 2 4 3
1 2 3 1
( , ) ( , ) ( , ) ( , ) ( , ) ( , ) ( , ) ( , ) ( , ) ( , )
0
0
0
( )
0
0
0
n n n n n
d d
d d d d
d d d d d d
d d d d d d d d
T
T
T
M C
T
T
T
T
T
T
T
!"
#
$
%
$
%
$
%
$
%
=
$
%
$
%
$
%
$
%
&
'
!
!
!
"
#
(1)
Where
( , )
min( , ) [2, ] Where
1 Where
[1, 1] Where max( , )
i j
i j d d
i j
d d i n n
T
j n n
d d
! " $ # #
=&& % '' ( # % #
)
* +
!
! (2)
The
d
i andd
j are ones data from the dataset sent by sensors to be processed in the proposed matrix in positioni
andj
.n
is the number of lines and columns in the matrix.(2
)
100
C FTC
T
P
=
! " +
(3)Where
•
!
C: Sensor uncertainty designated by the fabrication company.•
T
F: Uncertainty that may be attached to a factor in the study area (Rainfall,Runoff, ...)
3.2.1 Application
{
Rainfall,
Runoff,
WaterLevel}
E V
=
V
V
is the set of vectors for all data received fromthe sensors installed in the area.
V
Rainfall=
{80,82,81,84,90}
is a vector of five pieces of rainfall data sent by the rainfall sensor,V
Runoff=
{30,78,73,77,70}
is a vector of five pieces of runoff data sent by the runoff sensor and{40,45,20,41,42}
WaterLevel
V
=
is a vector of five pieces of water level data sent bythe water level sensor at the instant
t
.We have
V
Rainfall=
{80,82,81,84,90}
, son
=
5
. Thus the Rainfall Matrix is,Rainfall Matrix M(C)
80 82 81 84 90
80 0 # # # #
82 1 min(82,80) max(82,80)
! 0 # # #
81 1 min(81,80) max(81,80)
! 1!min(81,82)max(81,82) 0 # #
84 1 min(84,80) max(84,80)
! 1!max(84,82)min(84,82) 1!max(84,81)min(84,81) 0 # 90 1 min(90,80)
max(90,80)
! 1 min(90,82)
max(90,82)
! 1 min(90,81)
max(90,81)
! 1 min(90,84)
max(90,84)
! 0
We have,
( , )
min( , ) [2, ] Where
1 Where
[1, 1] Where max( , )
i j
i j d d
i j
d d i n n
T
j n n
d d
! " $ # #
=&& % '' ( # % #
)
* +
So,
For
i
=
2
we have: Forj
=
1
we have:Rainfall Matrix M(C)
80 82 81 84 90
80 0 # # # #
82 0.0244 0 # # #
81 1!max(81,80)min(81,80) 1!min(81,82)max(81,82) 0 # #
84 1!max(84,80)min(84,80) 1!max(84,82)min(84,82) 1!max(84,81)min(84,81) 0 # 90 1 min(90,80)
max(90,80)
! 1 min(90,82)
max(90,82)
! 1 min(90,81)
max(90,81)
! 1 min(90,84)
max(90,84)
! 0
For
i
=
3
we have: Forj
=
1
we have:Rainfall Matrix M(C)
80 82 81 84 90
80 0 # # # #
82 0.0244 0 # # #
81 0.0123 1!min(81,82)max(81,82) 0 # #
84 1!max(84,80)min(84,80) 1!max(84,82)min(84,82) 1!max(84,81)min(84,81) 0 # 90 1!max(90,80)min(90,80) 1!max(90,82)min(90,82) 1!max(90,81)min(90,81) 1 min(90,84)
max(90,84)
! 0
For
i
=
3
we have: Forj
=
2
we have:Rainfall Matrix M(C)
80 82 81 84 90
80 0 # # # #
82 0.0244 0 # # #
81 0.0123 0.0122 0 # #
84 1 min(84,80) max(84,80)
! 1!max(84,82)min(84,82) 1!max(84,81)min(84,81) 0 # 90 1 min(90,80)
max(90,80)
! 1 min(90,82)
max(90,82)
! 1 min(90,81)
max(90,81)
! 1 min(90,84)
max(90,84)
For
i
=
4
we have: Forj
=
1
we have:Rainfall Matrix M(C)
80 82 81 84 90
80 0 # # # #
82 0.0244 0 # # #
81 0.0123 0.0122 0 # #
84 0.0476 1!max(84,82)min(84,82) 1!max(84,81)min(84,81) 0 # 90 1 min(90,80)
max(90,80)
! 1 min(90,82)
max(90,82)
! 1 min(90,81)
max(90,81)
! 1 min(90,84)
max(90,84)
! 0
For
i
=
4
we have: Forj
=
2
we have:Rainfall Matrix M(C)
80 82 81 84 90
80 0 # # # #
82 0.0244 0 # # #
81 0.0123 0.0122 0 # #
84 0.0476 0.0238 1!max(84,81)min(84,81) 0 # 90 1 min(90,80)
max(90,80)
! 1 min(90,82)
max(90,82)
! 1 min(90,81)
max(90,81)
! 1 min(90,84)
max(90,84)
! 0
For
i
=
4
we have: Forj
=
3
we have:Rainfall Matrix M(C)
80 82 81 84 90
80 0 # # # #
82 0.0244 0 # # #
81 0.0123 0.0122 0 # #
84 0.0476 0.0238 0.0357 0 #
90 1 min(90,80) max(90,80)
! 1 min(90,82)
max(90,82)
! 1 min(90,81)
max(90,81)
! 1 min(90,84)
max(90,84)
! 0
For
i
=
5
we have: Forj
=
1
we have:Rainfall Matrix M(C)
80 82 81 84 90
80 0 # # # #
82 0.0244 0 # # #
81 0.0123 0.0122 0 # #
84 0.0476 0.0238 0.0357 0 #
90 0.1111 1 min(90,82) max(90,82)
! 1 min(90,81)
max(90,81)
! 1 min(90,84)
max(90,84)
For
i
=
5
we have: Forj
=
2
we have:Rainfall Matrix M(C)
80 82 81 84 90
80 0 # # # #
82 0.0244 0 # # #
81 0.0123 0.0122 0 # #
84 0.0476 0.0238 0.0357 0 #
90 0.1111 0.0888 1 min(90,81) max(90,81)
! 1 min(90,84)
max(90,84)
! 0
For i= 5we have: For
j
=
3
we have:Rainfall Matrix M(C)
80 82 81 84 90
80 0 # # # #
82 0.0244 0 # # #
81 0.0123 0.0122 0 # #
84 0.0476 0.0238 0.0357 0 #
90 0.1111 0.0888 0.1 1 min(90,84) max(90,84)
! 0
Here is the final resulting matrix.
Rainfall Matrix M(C)
80 82 81 84 90
80 0 # # # #
82 0.0244 0 # # #
81 0.0123 0.0122 0 # #
84 0.0476 0.0238 0.0357 0 #
90 0.1111 0.0888 0.1 0.0667 0
1.2
C
!
=
for the sensor used in forecasting that is installed in the area under ob-servation, andT
F=
5
according to a study carried out in several areas in Morocco for the rainfall factor, soP
TC=
0.074
. Thus, after completing several experiments, we found that when we do a comparison between the tolerance percentage and the matrix elements already calculated inside a loop statement for all the sensors data, we obtain the data that are valid and the data that are invalid in order to be stored in the data-base.{80,82,81,84}
Rainfall
ValidData = and the invalid data for the Rainfall Matrix M(C)
above are: InvalidDataRainfall ={90}
Additionally, the proposed model performs the same process for the other vectors (Runoff and Water Level).
When all of the agents have completed their processing and the data classification and aggregation steps have been completed successfully, each agent sends ACL mes-sages to the database interaction agent to trigger the database interaction stage.
3.3 Database Interaction Stage
Before saving data in the database, the agent performs additional processing. First, for the valid data, it calculates the average of the data, then it calculates the distance between the average and the data, and, finally, the agent selects the data that has the nearest distance to the average and saves it as the most relevant data.
Second, the invalid data are saved in the database, and the agent calculates the number of mistakes made by the sensors that sent invalid data. When a sensor ex-ceeds five errors, it turns off immediately because it requires maintenance or replace-ment. This number of errors parameter is configured from the platform for indicating it as needed.
3.4 Algorithm of the proposed model
In this section, we will present the algorithm of our proposed model. The functions
VerificationFunctionalSensors(), VerificationNonFunctionalSensors() are used to search for the sensors that are functional and those that are not and to arrange them in lists to be used by the main algorithm, respectively. The SensorVerificationAgent()
function is used to display the list of functional and non-functional sensors and to send warning messages, text messages and emails to the managers to repair or replace the sensors that are non-functional..
Function VerificationFunctionalSensors(Flag)
Data:
List SensorsFunctionalList;
Begin
SensorsFunctionalList = ResearchFunctionalSensorsDB(Flag); return SensorsFunctionalList;
End
Function VerificationNonFunctionalSensors(Flag)
Data:
List SensorsNFunctionalList;
Begin
SensorsNFunctionalList = ResearchNonFunctionalSensorsDB(Flag); return SensorsNFunctionalList;
End
Procedure SavingFinalValidData(ValidDataList)
Data:
Double Average; Double FinalValidData;
Begin
Average = CalculateAverageDataValidList(ValidDataList);
FinalValidData =
CalculateSmallestDistanceAverageDa-ta(ValidDataList,Average);
SavingDB(SensorID, FinalValidData);
Procedure SavingNonValidData(NonValidDataList)
Begin
SavingDB(SensorIDList, NonValidDataList); ErroneousNumberTime(SensorIDList);
End
Procedure ErroneousNumberTime(SensorIDList)
Begin
foreach Sensor do
if Erroneous Number Time of This Sensor
!
5 thenErroneousNumberTime++; else
ChangeFlag(SensorID); endif
endforeach End
Procedure ChangeFlag(SensorID)
Begin
EditFlag(SensorId, False);
End
Function SensorVerificationAgent()
Data:
List SensorsFunctionalList; List SensorsNFunctionalList;
Begin
SensorsFunctionalList = VerificationFunctionalSensors(True); SensorsNFunctionalList = VerificationNonFunctionalSensors(False); if SensorsNFunctionalList <> empty then
MessageWarningSMSEmail(SensorsNFunctionalList); endif
return SensorsFunctionalList;
Procedure DatabaseInteractionAgent(ValidDataList, NonValidDataList)
Begin
SavingFinalValidData(ValidDataList); SavingNonValidData(NonValidDataList);
End
Algorithm DataClassificationAggregationAgentSensors
Data:
List FunctionalDataList; List ValidDataList; List NonValidDataList; List DataSensorFileList; Matrix M;
Double
P
TC; Double!
C,
T
F;Begin
The verification agent function Triggers the process of the classification using ACL Message and send the SensorsFunctionalList;
if SensorsFunctionalList <> empty then
DataSensorFileList = ReadFile(File);
foreach Functional Sensor from DataSensorFileList do
FunctionalDataList = TempList[DataSensorFunctional]; endforeach
for
i
= 2 To FunctionalDataList.size() - 1 dofor
j
= 1 Toi
do[ , ] 1 ( [ ], [ ]);
( [ ], [ ])
Min ValidDataList i ValidDataList j M i j
Max ValidDataList i ValidDataList j = !
endfor
endfor
(2
)
;
100
C FTC
T
P
=
! "
+
for
i
= 2 To FunctionalDataList.size() - 1 dofor
j
= 1 Toi
doif
P
TC!
M i j
[ , ] 0
"
thenif This sensor does't exist in the list then
endif else
if This sensor does't exist in the list then
NonValidDataList[i] = FunctionalDataList[i]; endif
endif
endfor
endfor
The three agents trigger the database interaction stage by sending ACL mes-sage and the valid and erroneous list to the database interaction agent;
endif End
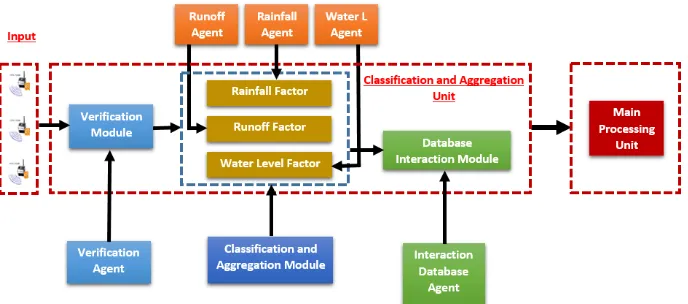
3.5 Pre-Processing Mode Architecture
The figure 1 below presents the architecture of the pre-processing mode.
Fig. 1. Pre-Processing Mode Architecture
4
Design & Implementation
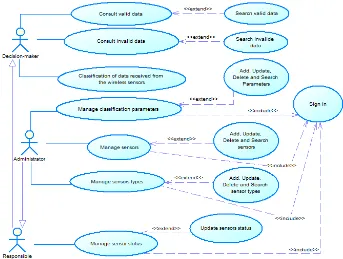
4.1 Behavioral modeling
Behavioral diagrams focus on the dynamic behavior of the system, the behavioral diagrams that we used are the use case diagram and sequence diagram. The main actors in our system are the decision makers who watch over the control and man-agement of floods, responsibles and administrators. The use case diagrams are shown in figure 2.
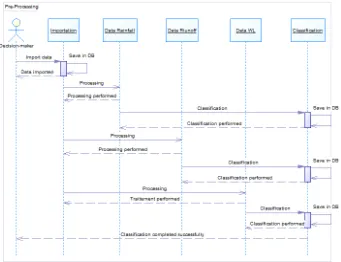
The sequence diagrams are shown in the figures 3.
4.2 Interaction Modeling
The diagrams of interaction between objects modeling used to model the dynamic behavior of the system, and to indicate how the objects interact at run time. The most interesting diagram of this kind of modeling is the communication diagram. The communication diagrams are shown in the figure 4.
Fig. 3. Sequence diagram for Main Processing phase
4.3 Implementation
In this section, we present our Intelligent Pre-Processing Model of Real-Time Flood Forecasting and Warning for Data Classification and Aggregation.
In this stage, as already described, the system first verifies the functioning of the wireless sensors installed in the surveillance area to identify the functioning and non-functioning sensors. The system disables the wireless sensors that are broken to re-move them from the forecasting process and to have them repaired later. This is the warning message from the system show in the figure 5:
Fig. 5. Sensors verification phase
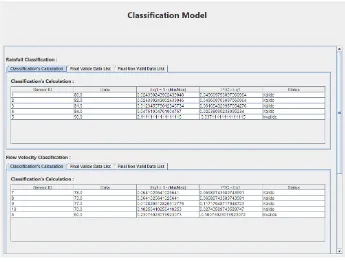
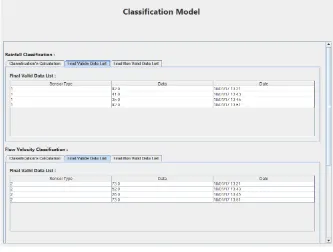
Next Figures 6, 7 and 8 presents the classification interfaces of the proposed model for classification and aggregation, where the most appropriate value to be stored in the database is obtained from all of the valid data. In this stage, we also obtain the invalid values and the sensors that sent the erroneous values.
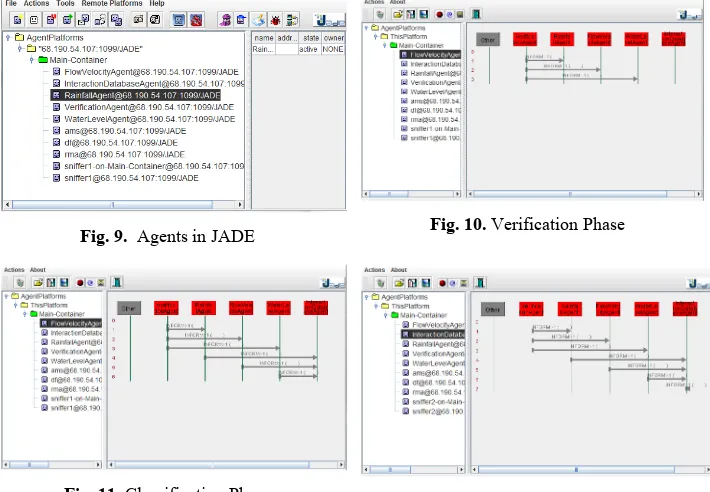
The figures 9, 10, 11 and 12 present the agents that perform the pre-processing in the JADE platform.
Fig. 7. List of final valid data
Fig. 9. Agents in JADE Fig. 10. Verification Phase
Fig. 11. Classification Phase Fig. 12.Interaction with database phase
5
Results & Discussion
To evaluate the performance of our system and our different proposed models, we made several experiments. For the Pre-Processing mode, we are interested to the ac-curacy criterion of its performance and its ability to classify data. To evaluate the performance and the accuracy, we have done forty-five experiments; in each experi-ment, we increased the number of data to classify in order to test the performance of our systems, we used the following formula:
FVD
Accuracy
FVD FIVD
=
+
(4)Where:
FVD: is the Final Valid Data filtered after the classification process by our pro-posed model for classification and aggregation.
FIVD: is the Final InValid Data filtered after the classification process by our pro-posed model for classification and aggregation.
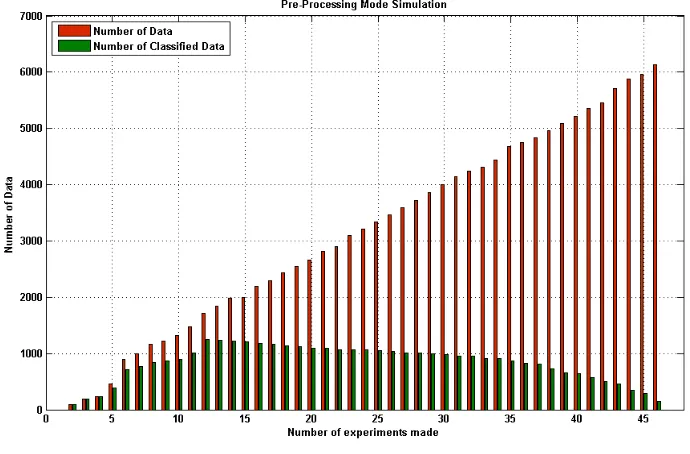
Three types of sensors installed in the at-risk areas are responsible for sending data. Each sensor has five copies, so the maximum number of data sent in real time to be classified is fifteen, so the results achieved already indicate that our system can classi-fy 100% of the data until three hundred data are reached. Thus, for our system, the performance of the classifications for the Pre-Processing mode do not and will never decrease and the decision accuracy will always be excellent because we will never reach three hundred data sent in real time. Figure 13 summarizes what we have just explained.
Fig. 13. Pre-Processing Mode Simulation
6
Conclusions
In this paper, we presented a new proposed intelligent pprocessing model of re-al-time flood forecasting and warning data received from the wireless sensors in order to do the classification and the aggregation of data using multi-agents system. Our proposed model is divided into three stages:
• Sensor Verification Stage for monitoring the proper functioning of the wireless sensors
• Finally the Database Interaction Stage for saving the valid and the invalid data and to trigger the offline mode of our decision support system
Our future work will focus on the reducing energy consumption and extending the lifetime of the sensors by using the clustering approach to regroup sensors into clus-ters and selecting a cluster head, whom will communication with the base station. We will use also the multi-agent systems to speed up this process and to transform the wireless into a collaborative, cooperative and distributed physical wireless sensor network.
7
References
[1] G. Furquim et al., "Combining Wireless Sensor Networks and Machine Learning for Flash Flood Nowcasting," 2014 28th International Conference on Advanced Information Net-working and Applications Workshops, Victoria, BC, 2014, pp. 67-72.
https://doi.org/10.1109/WAINA.2014.21
[2] Sagar Sudhakar Mane and M. K. Mokashi, "Real-Time Flash-Flood Monitoring, Alerting and Forecasting System using Data Mining and wireless sensor Network," 2015 Interna-tional Conference on Communications and Signal Processing (ICCSP), Melmaruvathur, 2015, pp. 1881-1886. https://doi.org/10.1109/ICCSP.2015.7322851
[3] T. Hashimoto, R. Ito, T. Ohta and Y. Kakuda, "Information Dissemination Scheme Using Mobile Agents in Autonomous Clustering-Based Heterogeneous Wireless Networks," 2016 Fourth International Symposium on Computing and Networking (CANDAR), Hiro-shima, Japan, 2016, pp. 279-285. https://doi.org/10.1109/CANDAR.2016.0057
[4] S. V. Halde and S. T. Khot, "Efficient collection of big data in WSN," 2016 International Conference on Inventive Computation Technologies (ICICT), Coimbatore, India, 2016, pp. 1-5. https://doi.org/10.1109/INVENTIVE.2016.7823196
[5] F. Del Ama Gonzalo, J. A. Hernandez and B. Moreno, "Wireless low cost temperature and humidity sensors with PV microcells. Determination of design parameters by means of ex-perimental measurements," 2016 5th International Conference on Electronic Devices, Sys-tems and Applications (ICEDSA), Ras Al Khaimah, United Arab Emirates, 2016, pp. 1-4. [6] Yenke Blaise Omer, Sambo Damien Wohwe, Ari Abo Adamou Abba and Gueroui
Abdel-hak " MMEDD: Multithreading Model for an Efficient Data Delivery in Wireless Sensor Networks," International Journal of Communication Networks and Information Security (IJCNIS), Vol 8, Issue 3, December 2016, pp. 179-186.
[7] R. I. Batygin and O. K. Alsova, "Software system for different types of data classification based on the ensemble algorithms," 2016 13th International Scientific-Technical Confer-ence on Actual Problems of Electronics Instrument Engineering (APEIE), Novosibirsk, 2016, pp. 506-509.
[8] Y. Yan, Q. Zhu, M. L. Shyu and S. C. Chen, "A Classifier Ensemble Framework for Mul-timedia Big Data Classification," 2016 IEEE 17th International Conference on Information Reuse and Integration (IRI), Pittsburgh, PA, 2016, pp. 615-622.
[9] A. Hamzi, M. Koudil, J. Jamont and M. Occello, "Multi-Agent Architecture for the Design of WSN Applications," Wireless Sensor Network, Vol. 5 No. 2, 2013, pp. 14-25.
https://doi.org/10.4236/wsn.2013.52003
Communica-tions, Cloud and Big Data Computing, Internet of People, and Smart World Congress (UIC/ATC/ScalCom/CBDCom/IoP/SmartWorld), Toulouse, France, 2016, pp. 753-758.
https://doi.org/10.1109/UIC-ATC-ScalCom-CBDCom-IoP-SmartWorld.2016.0121
[11] C. Bennila Thangammal, P. Rangarajan and J. Raja Paul Perinban, "Low power wireless sensor networks for real-time data acquisition system using Bloom filter," 2011 Interna-tional Conference on Emerging Trends in Electrical and Computer Technology, Tamil Na-du, 2011, pp. 88-91. https://doi.org/10.1109/ICETECT.2011.5760097
[12] A. Jorio, S. El Fkihi, B. Elbhiri and D. Aboutajdine, "A hierarchical clustering algorithm based on spectral classification for Wireless Sensor Networks," 2014 International Confer-ence on Multimedia Computing and Systems (ICMCS), Marrakech, 2014, pp. 861-866. [13] V. M. Kuthadi, R. Selvaraj and T. Marwala, "An efficient adaptive preprocessing
mecha-nism for streaming sensor data," 2015 IEEE 9th International Conference on Intelligent Systems and Control (ISCO), Coimbatore, 2015, pp. 1-6.
[14] J. P. Yoon and J. Ortiz, "Data mining approach to situation-aware sensor actuation in wire-less sensor networks," 2015 Fourth International Conference on Future Generation Com-munication Technology (FGCT), Luton, 2015, pp. 1-6. https://doi.org/10.1109/FGCT. 2015.7300250
[15] H. Ayadi, A. Zouinkhi, B. Boussaid and M. N. Abdelkrim, "A machine learning methods: Outlier detection in WSN," 2015 16th International Conference on Sciences and Tech-niques of Automatic Control and Computer Engineering (STA), Monastir, 2015, pp. 722-727. https://doi.org/10.1109/STA.2015.7505190
[16] Amir Mehmood, Akhter Raza; Adnan Nadeem and Umair Saeed " Study of Multi-Classification of Advanced Daily Life Activities on SHIMMER Sensor Dataset," Interna-tional Journal of Communication Networks and Information Security (IJCNIS), Vol 8, Is-sue 2, August 2016, pp. 86-92.
[17] E. M. Marouane, E. Mostafa and E. Mohamed, "Intelligent data classification and aggrega-tion in wireless sensors for flood forecasting system," Proceedings of 2014 Mediterranean Microwave Symposium (MMS2014), Marrakech, 2014, pp. 1-8. https://doi.org/10.1109/ MMS.2014.7088991
[18] El Mabrouk Marouane, Ezziyyani Mostafa, SADOUQ A. Zouahir and Essaaidi Moham-mad " New Expert System for Short, Medium and Long term Flood Forecasting and Warn-ing, " Journal of Theoretical and Applied Information Technology (JATIT), Vol 78, Issue 2, August 2015, pp. 286-302.
8
Authors
Marouane EL MABROUK is a doctor and researcher in the Mathematics and Application Laboratory, reviewer and committee member in several journals and conferences, IEEE Member and holder of PhD from the Faculty of Sciences and Technologies, Abdelmalek Essaadi University, Tangier, Morocco.
Salma GAOU is a doctor and researcher in LIROSA Laboratory, IEEE Member and holder of PhD from the Faculty of sciences, Abdelmalek Esaâdi University, Tetuan, Morocco.