Automated Chinese medicinal plants classification based on machine
learning using leaf morpho-colorimetry, fractal dimension and
visible/near infrared spectroscopy
Jinru Xue
1,4,5,
Sigfredo Fuentes
2,
Carlos Poblete-Echeverria
3,
Claudia Gonzalez Viejo
2,
Eden Tongson
2,
Hejuan Du
6,
Baofeng Su
1,4,5*(1. College of Mechanical and Electronic Engineering, Northwest A&F University, Yangling 712100, Shaanxi, China; 2. School of Agriculture and Food. Faculty of Veterinary and Agricultural Sciences, the University of Melbourne, 3010 Australia;
3. Faculty of AgriSciences, Stellenbosch University, Stellenbosch 7602, South Africa;
4. Key Laboratory of Agricultural Internet of Things, Ministry of Agriculture and Rural Affairs, Yangling 712100, Shaanxi, China; 5. Key Laboratory of Agricultural Perception and Intelligent Services, Shaanxi Province, Yangling 712100, Shaanxi,China;
6. College of Information Engineering, Tibet Nationality University, Xianyang 712089, Shaanxi, China)
Abstract: The identification of Chinese medicinal plants was conducted to rely on ampelographic manual assessment by experts. More recently, machine learning algorithms for pattern recognition have been successfully applied to leaf recognition in other plant species. These new tools make the classification of Chinese medicinal plants easier, more efficient and cost effective. This study showed comparative results between machine learning models obtained from two methods: i) a morpho-colorimetric method and ii) a visible (VIS)/Near Infrared (NIR) spectral analysis from sampled leaves of 20 different Chinese medicinal plants. Specifically, the automated image analysis and VIS/NIR spectral based parameters obtained from leaves were used separately as inputs to construct customized artificial neural network (ANN) models. Results showed that the ANN model developed using the morpho-colorimetric parameters as inputs (Model A) had an accuracy of 98.3% in the classification of leaves for the 20 medicinal plants studied. In the case of the model based on spectral data from leaves (Model B), the ANN model obtained using the averaged VIS/NIR spectra per leaf as inputs showed 92.5% accuracy for the classification of all medicinal plants used. Model A has the advantage of being cost effective, requiring only a normal document scanner as measuring instrument. This method can be adapted for non-destructive assessment of leaves in-situ by using portable wireless scanners. Model B combines the fast, non-destructive advantages of VIS/NIR spectroscopy, which can be used for rapid and non-invasive identification of Chinese medicinal plants and other applications by analyzing specific light spectra overtones from leaves to assess concentration of pigments such as chlorophyll, anthocyanins and others that are related active compounds from the medicinal plants.
Keywords: ampelography, computer vision, artificial neural networks, pattern recognition, Chinese medicinal plants
DOI: 10.25165/j.ijabe.20191202.4637
Citation: Xue J R, Fuentes S, Poblete-Echeverria C, Viejo C G, Tongson E, Du H J, et al. Automated Chinese medicinal plants classification based on machine learning using leaf morpho-colorimetry, fractal dimension and visible/near infrared spectroscopy. Int J Agric & Biol Eng, 2019; 12(2): 123–131.
1 Introduction
Medicinal plants are of high cultural importance to the health of individuals and communities in China. The medicinal value of
Received date: 2018-09-03 Accepted date: 2019-01-16
Biographies: Jinru Xue, Master, research interests: remote sensing of
agriculture, image processing and computer vision, Email: jinruxue@ nwsuaf.edu.cn; Sigfredo Fuentes, PhD, Associate Professor, research interests: environment, remote sensing and plant physiology, Email: sfuentes@ unimelb.edu.au; Carlos Poblete-Echeverria, PhD, Senior Lecturer, research interests: environment, plant biology and photography, Email: sfuentes@ unimelb.edu.au; [email protected]; Claudia Gonzalez Viejo, PhD, research interests: machine learning, computer vision and food chemistry, Email: [email protected]; Eden Tongson, PhD, research interests: machine learning, computer vision and plant physiology, Email: Eden.tongson@ unimelb.edu.au; Hejuan Du,PhD,Lecturer, research interests: remote sensing, environment and agriculture, Email: [email protected].
*Corresponding author: Baofeng Su, PhD, Associate Professor, research
interests: precision agriculture, remote sensing and pattern recognition. College of Mechanical and Electronic Engineering, Northwest A&F University, Yangling 712100, Shaanxi, China. Tel: +86-15609279711, Email: bfs@nwsuaf. edu.cn.
these plants relies on particular chemical compounds that produce a measurable physiological action on the human body against specific illnesses[1]. The impending situation is that many Chinese medicinal plants are at risk of disappearing from historical cultivation regions due to human activities and climate change[2]. Therefore, it is of high importance to set up a descriptive database and automated identification system for their protection and to assess performance in changing climatic areas. One of the most commonly used methods to identify medicinal plants is using ampelography by the shape, size and color of leaves, which is normally conducted in an observational basis by an expert[3,4]. Traditional manual discrimination methods have high demand of staff experience and knowledge, and the recognition results are subjective and with the risk of a significant percentage of misclassification.
from pictures or scans of the adaxial side of leaves. Automated recognition of leaves based on feature extraction using computer-vision algorithms, chemical fingerprinting and machine learning classification has been a challenging task due to the variability of proper selection of significant morpho-colorimetric features and overtones from the light spectra reflected from leaves plus the availability of robust machine learning algorithms.
The evolutionary complexity of leaf morphology and leaf edge structure provides a suitable way for the identification and classification of Chinese medicinal plants. Every leaf morphology and chemical fingerprinting are unique for each plant species, which allows their classification through a series of different observations or measurements for identification purposes[5]. For example, Singh et al.[6] recognized 32 different plants classes according to their geometric features using Support Vector Machine (SVM) based Binary Decision Tree architecture, which led to a dramatic improvement in recognition speed when addressing problems with large number of classes. Wang et al.[7] recognized Near Infrared (NIR) fingerprinting spectroscopy of plant extractions of 60 Chinese medicinal plant species using pattern identification. Michael et al.[8] studied nine image types and three pre-processing strategies to understanding the trade-off between effort and information gain in acquiring and pre-processing leaf images for automated plant identification, results showed that the way in which leaf images are acquired and pre-processed does have a substantial effect on the accuracy of the classification.
Morphometric measurements such as area, perimeter, eccentricity, edge shape and the fractal dimension (FD) have been considered as robust classification parameters. Xiang et al.[9] recognized plant species by morphological features from leaves such as length, width, diameter, perimeter, area, smooth factor, aspect ratio and Fourier moments, which could be used as discriminant traits. With the development of digital photography, image scanning methods, and image analysis algorithms, it is possible to obtain a series of morphological parameters automatically or semi-automatically that have been already applied for plants identification[4,10-12]. However, computer-aided medicinal plant recognition is still a very challenging task since these semi- or automatic methods have not yet considered color parameters in their algorithms as part of their output variables, which can be associated as a proxy to chemical composition, specifically pigments such as chlorophyll (green) and anthocyanins (dark blue). Moreover, none of these techniques offer an automated classification system. They are only descriptive, showing different species or clones clustered and separated using multivariate statistical methods such as principal component analysis (PCA) and cluster analysis. Nonetheless, feature extraction from objects using image analysis algorithms or morphometrics have been widely used for different plant species based on methods varying from morphometric analysis[13] and machine learning algorithms either for identification, classification or detection of biotic and abiotic stresses[4,14-18].
On the other hand, in recent years there have been considerable advances in chemical fingerprinting of objects based on chromatograph and spectroscopy coupled with the development of new and more robust computer pattern recognition algorithms. These developments have allowed pattern recognition of medicinal plants based on the chemical fingerprinting with potential applications in the detection of biotic or abiotic stresses[19-21]. However, the spectroscopy instruments have been cost prohibitive
in the past, which limits the practical application of the models in-field situations.
This work describes the application of image analysis of scanned leaves using computer-vision algorithms to obtain morpho-colorimetric and fractal dimension features in comparison to chemical fingerprinting using an affordable, smartphone/Tablet PC based visible (VIS)/NIR spectral instrument and analysis through customized codes written in Matlab® (Mathworks Inc., Natick, MA. USA). Multivariate data analysis based on principal components analysis (PCA) was used to determine the relationship between different feature parameters and for descriptive plant clustering as a form of pre-validation of machine learning classification models. These extracted morpho-colorimetric features and NIR spectra were later used separately as inputs to build machine learning classification algorithms, for the automatic identification of 20 traditional Chinese medicinal plants based on morpho-colorimetry (Model A) and chemical fingerprinting parameters (Model B).
2 Materials and methods
2.1 Site and medicinal plants description
This study was carried out in May 2017, in a Chinese medicinal plant collection site located in the Northwest A&F University, South Campus (34°10′N, 108°10′E, Shaanxi, China). The medicinal plant site contains 87 species planted in different plots of 5 m × 3 m. In this region, the climate is identified as temperate monsoon with hot, rainy summers and cold, dry winters. The average annual temperature is 13.2°C with a maximum temperature of 41.2°C in the warmest month (August). The annual rainfall is around 500-600 mm concentrated in the summer period (50% from July to September). For data collection, 20 medicinal plant species (Table 1) were selected according to their importance and universality of applications. Specifically, for each species, five representative plants were selected as replicates (n = 100 total plants). From each replicate, three fully expanded and mature leaves without visible damage and including petioles were collected (n = 300 total leaves). For the morpho-colorimetric measurements (Experiment A), leaf samples were collected, and stored in labelled zip lock plastics bags and transported in a cooler with ice to avoid dehydration for digital scanning in the laboratory. For VIS/NIR range spectroscopy (Experiment B), measurements were conducted in the field from the same leaves collected for Experiment A under natural light from clear and full sunny days. All leaves were measured with the VIS/NIR device before placing them in the cooler.
2.2 Morpho-colorimetric analysis and fractal dimension analysis (Experiment A)
For experiment A, leaves were scanned in laboratory using a Brother MFC-660CN (Brother Industries, Ltd., Japan) scanner. All images were analyzed using a customized code written in Matlab® ver. R2017b (Mathworks Inc., Natick, MA. USA). Initial calibration for each scanner was performed by analyzing black squares of known sizes to relate pixel count in the x and y dimensions to length and area using metric units (cm and cm2 respectively). As described by Fuentes et al.[4,22], this code (after scanner calibration) was able to automatically analyze leaf images and extract morphometric, color parameters, and fractal dimension (FD) from each leaf sample (Figure 1). All the parameters obtained from the customized code are described in Table 2.
characterize complex biological structures[14,23]. The fractal dimension from scanned leaves was obtained using the box counting method[24, 25] from leaves edge analysis (Figure 2). Specifically, the edge detection algorithm to obtain morphological features creates an image containing only the edge of the leaves
(Figure 2c). Then the edge is divided into boxes of fixed length (d) and a number of boxes containing part of an edge [N(d)] (Figure 2d). Then the log[N(d)] versus log(d) can be computed and plotted to obtain an averaged value of FD corresponding to the most linear portion of the curve.
Table 1 Chinese medicinal plant species names with associated traditional use description in China and abbreviations used for the multivariate data analysis
ID Common names Scientific name Traditional use* Abbreviation
1 Apricot leaf radix Adenophora hunanensis Nannf Hot dry cough, lung tuberculosis cough and Yin throat sore throat AHN 2 Angelica Angelica pubescens Anemofrigid-damp arthralgia and cold dampness headache AP 3 Agrimony Agrimonia pilosa Ledeb Irregular menstruation, uterine bleeding, hematemesis, hematuria and duodenal
bleeding APL
4 Digitalis Digitalis purpurea Chronic congestive heart failure and cardiac edema DP 5 Wartwort Euphorbiahelioscopia L. Edematous asthma, bacillary dysentery, scrofula, and osteomyelitis EU 6 Adenophora Glehnia litoralis F.Schmidt ex Miq Hyperactivity dry cough, cough phlegm, and fever thirsty GFM 7 Lycopus Lycopus lucidus Turcz Hypolipidemic, blood stasis, water swelling and irregular menstruation LIT 8 Woodbine Lonicera japonica Detoxification, anti-inflammatory, detumescence, bacterial dysentery and suppurative disease LJ 9 Purple perilla Perilla frutescens Cold, chest tightness, nausea and vomiting PF 10 Chinese bellflower Platycodon grandiflorus Cough, phlegm, chest tightness poor, sore throat, hoarseness and carbuncle spit lung
abscess PG
11 Peristrophe Peristrophe japonica Febrile Convulsion, cold fever, acute mastitis, mosquito bites and bruises PJ 12 Polygonatum Polygonatum odoratum Heart disease, diabetes and tuberculosis PO 13 Isatis root Radix isatidis Fever, sore throat, warm poison spot, mumps, scarlet fever, erysipelas and carbuncle. RI 14 Rabdosia rubescens Rabdosia rubescens Acute laryngitis, acute suppurative tonsillitis, chronic bronchitis and chronic
pharyngitis RR
15 Baikal skullcap Scutellaria baicalensis Georgi threatened abortion, hemostasis, tocolysis, dysentery and jaundice SBG
16 Goldenrod Solidago decurrens Lour Snake bites, carbuncle and furuncle SDL
17 Matrine Sophora flavescens Dysentery, hematochezia, jaundice anuria, pruritus of vagina and colpitis SF 18 Figwort Scrophularia ningpoensis Hemsl Warm heat disease, sore throat swelling and pain, sore ulcer scrofula phlegm nucleus SNH 19 Soapwort Saponaria officinals Linn Expectorant, bronchitis and diuretic SOL 20 Stemona Stemona sessilifolia Pertussis, lice, chantui disease and pruritus vulvae SS Note: * The list of traditional use may not necessarily be backed up by conclusive scientific research.
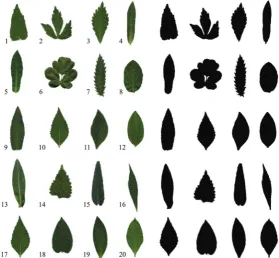
Figure 1 Example of scanned leaves (without petioles) representative from each cultivar for the morpho-colorimetric classification study or Experiment A (left; n = 20) and corresponding binary images for automatic shape and edge recognition (right) to obtain morpho-colorimetric parameters from each leaf dimensions. Leaf numbers are associated to the list described in Table 1. Leaf and petiole size shown are not
Table 2 Description and abbreviations of the parameters obtained from the morpho-colorimetric analysis for the cultivar classification
Number Parameters Units Abbreviation Description
1 Perimeter cm Perimeter Perimeter of the leaf
2 Area cm2 Area Area of the leaf
3 Maximum length cm MaxL Maximum length of the leaf 4 Minimum length cm MinL Minimum length of the leaf
5 Eccentricity unitless Eccent Length: width ratio in which zero is given to a straight line and one represents a circle 6-8 CieLab color scale unitless L, a and b CieLab scale used to measure color parameters, where: L = lightness, a = red to green color
range, b = yellow to blue color range
9-11 RGB color scale unitless R, G and B RGB scale used to measure color where: R = red, G = green and B = blue colors 12 Fractal Dimension unitless FD Fractal dimension measured using the box counting method
a b c d Figure 2 Morpho-colorimetric and fractal dimension analysis example for a Polygonatum odoratum as a less complex leaf shape
(with smaller lobes, top) compared to a more complex leaf shape for Angelica pubescens (marked three lobes, bottom). Steps from the automated analysis were: (a) Border recognition and inner lobe space recognized to extract colorimetric based parameters (marked
with a black line); (b) binary images to obtain morphometric parameters; (c) edge recognition for fractal dimension calculations and (d) box counting method applied to the edge of leaves to obtain
the fractal dimension
2.3 VIS/NIR spectrometry (Experiment B)
Leaves from all species for experiment B were measured using a professional spectrometer Lighting Passport (AsenseTek, New Taipei City, Taiwan) in the field with natural light in a clear day. This device was able to measure the VIS/NIR spectral reflectance in the 380-780 nm range, the spectral resolution is 10 nm and wavelength accuracy is ±0.5 nm. All leaves were measured at around 1 cm from the measurement point with the instrument positioned at 45o angle from incident solar radiation at three different spots within each leaf (n = 9 per leaf) starting always from the top right side and continuing down and finishing in the top left side for each leaf (n = 900).
2.4 Multivariate data analysis
All data were analyzed through a multivariate data analysis based on the principal components analysis (PCA) to find relationships between the morphometric parameters and medicinal plants using The Unscrambler® X ver. 10.3 (CAMO Software, Oslo, Norway) for both, Experiment A (Morpho-colorimetric) and Experiment B (VIS/NIR spectral). The PCAs were used as preliminary assessment to test whether clustering of medicinal plant species was evident or not, which will offer a form of preliminary validation to the machine learning classification results. However, this analysis was only used to explain data separation, which machine learning models do not clarify.
2.5 Machine learning modelling
A total of 23 machine learning classifiers grouped in decision trees (3), discriminant analysis (2), logistic regression (1), support vector machines (6), nearest neighbor classifier (6), ensemble classifiers (5) were tested in this experiment [data not shown] along with artificial neural networks. The ANN models resulted as the best performing algorithms.
The Matlab Neural Network Toolbox™ 10, which is based on pattern recognition and a scaled conjugate gradient algorithm for training was used to develop a model to classify the leaves according to their cultivar by using 12 parameters obtained from their morphometric characteristics from Experiment A (Model A, Figure 3A). A second model (Model B, Figure 3B) using the same algorithm for training was developed using the spectral values obtained for the 401 wavelengths measured with VIS/NIR spectral as the input data (Experiment B). These two models were developed to classify samples into the 20 different species used as the targets. For both models, a random division function was used for training, validation and testing of data to generate the model using 70% of samples for training, 15% for validation and 15% for testing. A total of five neurons were selected in the hidden layer for the morpho-colorimetric model (Experiment/Model A) and seven neurons for the spectrometry model (Experiment/Model B) (Figure 3). The specific number of neurons was obtained through the neuron trimming technique testing 3, 5, 7 and 10 (data not shown).
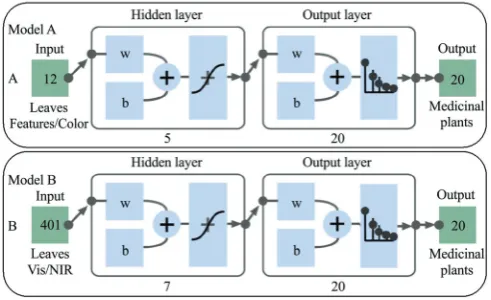
Figure 3 Example of the two-layer feedforward network with sigmoid hidden and output layers for pattern recognition for A)
Model A using 5 neurons with 12 inputs from the morpho-colorimetry leaf features to classify 20 target medicinal plant species (Experiment A) and B) Model B with 401 inputs from
VIS/NIR spectroscopy (380-780 nm) using 7 neurons to classify into 20 medicinal plants (Experiment B). All models were developed using Matlab ver R2017b (Mathworks Inc., Matick,
3 Results
Averaged values for morpho-colorimetric parameters obtained in Experiment A and corresponding statistics are shown in Table 4 for the 20 medicinal plant species studied. Multivariate data analysis results are reported to assess separation of species using morpho-colorimetric (Figure 4) and VIS/NIR spectral data (Figure 5). The PCA analysis was performed to support the validity of the machine learning classification models obtained using ANN. The ANN models are presented correlatively as Model A for morpho-colorimetric classification of 20 medicinal plants in China; Model B for VIS/NIR spectral chemical fingerprinting classification of 20 medicinal plants in China (Table 5; Figure 6).
3.1 Averaged values and statistics of morpho-colorimetric parameters
For experiment A, averaged leaf area dimensions ranged from an averaged minimum of 5.1 cm2 for SBG to a maximum of 71.0 cm2 for RI. Perimeters had a wider range, from lower values such as 5.1 cm for species number 15 and in general associated to less complex leaves (less marked lobes) such as species 5, 8, 11, 12, 13, 18, 19, 20, to species with marked lobes with higher perimeter values and a maximum of 213.4 cm for specie 7 and species 1, 2, 3, 6, 9, 10, 14, 16, 17 (Figure 1, Table 4). The leaf size and complexity results were further supported with statistical differences found for Area, Perimeter, MaxL, MinL and Eccent (Table 4). From the CieLab color code results, all leaves had negative values for a (green) and lower positive values for b (yellow) as expected. The lowest b values were found for species 1, 2, 3, 4, 8, 12, 14, 20, which have a clear negative correlation to higher values of G in the RGB color code, is graphically shown in the PCA (Figure 4). Furthermore, there was a clear differentiation between complex (more lobes) and less complex leaves based on
the FD parameter for different medicinal plant species based on averaged values and statistical analysis.
As expected, there was a significant correlation (R) and determination coefficient (R2) between Area and Perimeter (Perimeter = 2.27 Area +53.2; R = 0.75; R2 = 0.56) from all leaves from the 20 medicinal plant species studied.
3.2 Multivariate data analysis
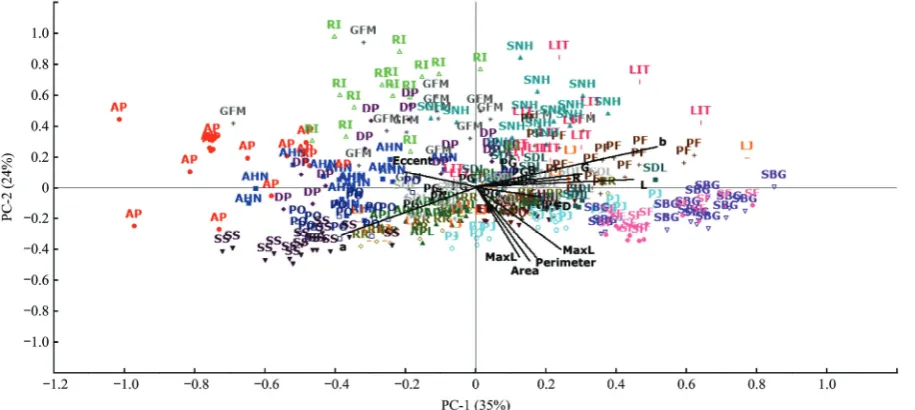
A combined score (samples) and loadings (vectors) PCA graph showing all leaf samples measured to extract morpho-colorimetric features (Table 1) is presented in Figure 4 (Experiment A). Principal component 1 (PC1) and principal component 2 (PC2) accounted for 35% and 24% respectively with a combined total of 59% explanation of total data variability. The PC1 was more characterized by morphometric features and PC2 was more related to colorimetric features which helped to separate species into seemingly defined clusters denoted by different colors. The PCA (Figure 4) shows that morpho-metric parameters such as Area, Perimeter, MaxL, MinL, MaxP separate species with higher values (bigger leaves and medium to complex shape) such as PJ (11), EU (5), APL (3), SDL (16) and RR (14). Higher colorimetric values and FD separated species such as APL (3), SS (20), RR (14) and PG (10). Furthermore, only a few non-representative samples were characterized with higher morphometric values and high colorimetric values for ‘a’ as well as lower morphometric values and high colorimetric values for Eccent.
A score plot from averaged VIS/NIR spectral measurements per leaf of 20 different medicinal plants is presented in Figure 5 (Experiment B). In this case, PC1 accounted for 89% and PC2 for 8% of variability with a total of 97% of variability explanation. This figure also shows an apparent separation and clustering of species, especially SNH, GFM, SBG, PJ and SF with less apparent separation for the rest of the cultivars, which grouped in a plane along PC1 along the positive and negative quadrants.
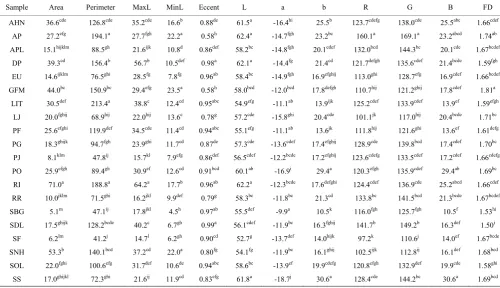
Table 4 Averaged values for morpho-colorimetric parameters obtained by scanning leaves from 20 different medicinal plant species from (Experiment A). Species, units for parameters and abbreviations are described in Tables 1 and 3. Different superscripted letters denote statistically significant differences assessed using the Tukey test with α = 0.05
Sample Area Perimeter MaxL MinL Eccent L a b R G B FD
AHN 36.6cde 126.8cde 35.2cde 16.6b 0.88de 61.5a -16.4hi 25.5b 123.7cdefg 138.0cde 25.5abc 1.66cdef
AP 27.2efg 194.1a 27.7fgh 22.2a 0.58h 62.4a -14.7fgh 23.2bc 160.1a 169.1a 23.2abcd 1.74ab
APL 15.1hijklm 88.5gh 21.6ijk 10.8d 0.86def 58.2bc -14.8fgh 20.1cdef 132.0bcd 144.3bc 20.1cde 1.67bcdef
DP 39.3cd 156.4b 56.7b 10.5def 0.98a 62.1a -14.4fg 21.4cd 121.7defgh 135.6cdef 21.4bcde 1.59fgh
EU 14.6ijklm 76.5ghi 28.5fg 7.8fg 0.96ab 58.4bc -14.9fgh 16.9efghij 113.0ghi 128.7efg 16.9cdef 1.66bcdef
GFM 44.0bc 150.9bc 29.4efg 23.5a 0.58h 58.0bcd -12.0bcd 17.8defgh 110.7hij 121.2ghij 17.8cdef 1.81a
LIT 30.5def 213.4a 38.8c 12.4cd 0.95abc 54.9efg -11.1ab 13.9ijk 125.2cdef 133.9cdef 13.9ef 1.59efgh
LJ 20.0fghij 68.9hij 22.0hij 13.6c 0.78g 57.2cde -15.8ghi 20.4cde 101.1jk 117.0hij 20.4bcde 1.71bc
PF 25.6efghi 119.9def 34.5cde 11.4cd 0.94abc 55.1efg -11.1ab 13.6jk 111.8hij 121.6ghi 13.6ef 1.61defg
PG 18.3ghijk 94.7fgh 23.9ghi 11.7cd 0.87de 57.3cde -13.6cdef 17.4efghij 128.9cde 139.8bcd 17.4cdef 1.70bc
PJ 8.1klm 47.8ij 15.7kl 7.9efg 0.86def 56.5cdef -12.2bcde 17.2efghij 123.6cdefg 133.5cdef 17.2cdef 1.66cdefg
PO 25.9efgh 89.4gh 30.9ef 12.6cd 0.91bcd 60.1ab -16.9i 29.4a 120.3efgh 135.9cdef 29.4ab 1.69bc
RI 71.0a 188.8a 64.2a 17.7b 0.96ab 62.2a -12.3bcde 17.6defghi 124.4cdef 136.9cde 25.2abcd 1.66cdef
RR 10.0jklm 71.5ghi 16.2jkl 9.9def 0.79g 58.3bc -11.8bc 21.3cd 133.8bc 141.5bcd 21.3bcde 1.67bcdef
SBG 5.1m 47.1ij 17.8jkl 4.5h 0.97ab 55.5def -9.9a 10.5k 116.0fgh 125.7fgh 10.5f 1.53hi
SDL 17.5ghijk 128.2bcde 40.2c 6.7gh 0.99a 56.1cdef -11.9bc 16.3fghij 141.7b 149.2b 16.3def 1.50i
SF 6.2lm 41.2j 14.7l 6.2gh 0.90cd 52.7g -13.7def 14.0hijk 97.2k 110.6j 14.0ef 1.67bcde
SNH 53.3b 140.1bcd 37.2cd 22.0a 0.80fg 54.1fg -11.9bc 16.1ghij 102.5ijk 112.8ij 16.1def 1.68bcd
SOL 22.0fghi 100.6efg 31.7def 10.6de 0.94abc 58.6bc -13.9ef 19.9cdefg 120.8efgh 132.9def 19.9cde 1.58ghi
Figure 4 Principal component analysis (PCA) graph combining score plot (samples) and loadings (vectors or features extracted from leaves) for Experiment A for 20 different Chinese medicinal plant species. Different colors represent different species.
Vectors represent the morpho-colorimetric parameters assessed (black)
Figure 5 Principal component analysis (PCA) graph showing a score plot of averaged VIS/NIR spectroscopy per leaf of 20 different medicinal plant species for Experiment B. Different colors represent different species
3.3 Machine learning leaf classification based on leaf morpho-colorimetrics (Model A)
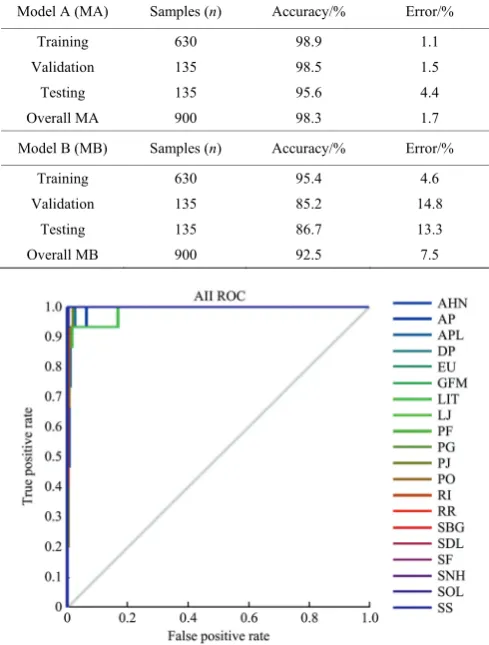
The ANN Model A obtained using the 12 morpho-colorimetric parameters (Table 2) to classify 300 leaves into 20 different species had an overall accuracy of 98.3% (Table 5). This accuracy level was obtained through training (98.9%), validation (98.5%) and testing (95.6%) processes performed by the ANN modelling procedure. There were no signs of overfitting as it presented a cross-entropy performance of 0.004 with the best validation performance at epoch 111 and a similar validation and testing performance values. Table 6 details the number of samples used for each of the three stages (training, validation and testing) as well as the accuracy and error in percentage.
Figure 6a shows the receiver operating characteristic (ROC) curve for the morpho-colorimetry ANN Model A. This curve was obtained by the variation of the threshold and shows the overall prediction values for each cultivar, which are represented by a line
with a different color. Due to the high accuracy of the model, all the species are closer to the values that represent the true positive rate (top left corner).
3.4 Machine learning leaf classification based on VIS/NIR spectroscopy (Model B)
Table 5 Results obtained from the pattern recognition ANN models using morpho-colorimetric parameters to classify 20
medicinal plant species in China (Model A); the VIS/NIR wavelengths to classify 20 medicinal plants in China (Model B).
Number of samples used in each stage, accuracy and percentage of error are presented
Model A (MA) Samples (n) Accuracy/% Error/% Training 630 98.9 1.1
Validation 135 98.5 1.5
Testing 135 95.6 4.4
Overall MA 900 98.3 1.7
Model B (MB) Samples (n) Accuracy/% Error/% Training 630 95.4 4.6
Validation 135 85.2 14.8
Testing 135 86.7 13.3
Overall MB 900 92.5 7.5
a. Model A using morpho-colorimetric data from scanned leaves as inputs to classify 20 medicinal plant species from China
b. Model B using VIS/NIR spectroscopy to classify 20 medicinal plant species from China.
Figure 6 Receiver operating characteristic (ROC) graphs showing the prediction values for cultivar using artificial neural network
models
4 Discussion
Differences between morpho-colorimetric, VIS/NIR averaged data and statistical analysis plus PCA analysis have been used in
previous research as means to validate machine learning modelling for robotics applied to the assessment of beer quality[26, 27]. This can be considered as the first step in machine learning modelling which can contribute to avoid over or under estimations, even though the PCs were not used to develop the ANN models.
Color-based parameters showed a pattern of green leaves with similar range of values but with significant differences between species for luminosity, less yellow, red and blue parameters. Since all the medicinal plant species were maintained without any biotic or abiotic stress though careful water and fertilizer management, it can be assumed that colorimetric differences found are associated to the specific species and pigment differences among them. These pigment differences can be associated to levels of chlorophyll content within leaves[28] from different species associated to the color green and anthocyanins levels associated to the blue color[29]. Therefore, colorimetric parameters can offer a basic chemometric differentiation parameter for machine learning modelling purposes.
Previous studies have included 40 different medicinal plant species, extracted morphological parameters from leaves images including Eccentricity, Aspect Ratio, Elongation, Solidity, Stochastic Convexity and an Isoperimetric Factor, which just described the contribution rate of each component without any machine learning modelling attempt[30], hence these kinds of studies offer only descriptive capabilities. Furthermore, the Eccentricity parameter from the previous mentioned study had a less significant vector length representation with low contribution in the separation of medicinal species.
On the contrary, Jia[31] compared models obtained from NIR of sampled leaves from 5 different Chinese medicinal plants to classify them using PCA, ANN and PCA-ANN. From the PCA and ANN of that study, there were interrelationships between different medicinal plants species; however the PCA-ANN showed high accuracy (error rate = 2.469%) in the identification of medicinal plants. Poor separation of species using descriptive statistics, such as PCA, may be related to overestimations later in the ANN modelling procedure, which require analysis of the input data in relation to the target number, trimming of neurons and more specific techniques for machine learning modelling that are not commonly done or described by previous literature[27]. The accuracy of this technique makes it possible to predict new leaves to classify them into a determined species studied assuming accuracy of ANN models. From previous studies, the practicality of the application of these models is hindered due to the complexity of the technique used to obtain the inputs for the classification algorithm, which requires expensive instrumentation, specialized and skilled people for instrument operation, data acquisition and management.
on the particle size, crystal type, residual solvent and humidity, among others. These characteristics can be represented by specific overtones in the reflected/absorbed spectra[35]. Therefore, it can be said, in general terms, that the separation obtained from the 20 Chinese medicinal plant species (Figure 5) corresponds to the VIS/NIR and chemical fingerprinting from different leaf samples with more or less accuracy related to pigments and organic matter content.
This study presented two ANN models with high accuracies for the automated classification of Chinese medicinal plants based on morpho-colorimetric parameters obtained automatically from scanned leaves (Model A) and VIS/NIR spectroscopy (Model B). All the parameters used for the models had high weight (length of vectors), which contributed to the separation of the 20 medicinal plant species studied (PCA Figures 4 and 5). These ANN models can be easily implemented into computer applications (Apps) for their use through smartphones and tablet PC devices to classify new leaves[36].
The number of parameters used for the models as inputs and their significance in the separation of different species makes the models obtained more robust in comparison to previous studies, and can be applied in the identification of more medicinal plant species. This was supported by the comparison with other 23 machine learner classifiers (data not shown), which consider most of the algorithms used by other studies. Furthermore, the methods proposed for Model A and Model B, which can be used for further classifications do not require expensive instrumentation and specialized personnel to operate them. Specifically, for Model A, the scanner can be replaced by a portable and inexpensive wireless scanner to obtain images in the field, which will transform this method into a non-destructive one. For Model B, the spectroscopy device is affordable, easy to use and can be used with smartphones and tablet PCs for its application in-field conditions as presented in this study.
5 Conclusions
This study presented non-destructive and automated recognition methods based for Chinese medicinal plants using morphological and color features extraction of scanned leaves and VIS/NIR spectroscopy coupled with ANN modelling with high accuracy. These models can be easily applied with cost-effective and easy operation techniques based on Apps for smartphones and tablet PCs. Further studies using morpho-colorimetric or VIS/NIR techniques should comply with these basic requirements for interpretation of data and robust machine learning modelling strategies and procedures for practical use among the general public, botanical enthusiasts, conservation personnel and research scientists.
Acknowledgements
This study was supported by the National Key Research and Development Program of China (No. 2017YFD0700402), the Key Science and Technology Program of Shaanxi Province, China (No. S2016YFNY0066), the Scientific Research Foundation for the Returned Overseas Chinese Scholars, State Education Ministry, Tibet Natural Science Foundation-The Study of Tibet Crop Condition Monitoring Based on Crop Growth Model and Multi-Source Remote Sensing Data (2016-ZR-15-18); Part of this research was supported by the Digital Viticulture program funded by the University of Melbourne’s Networked Society Institute, Australia.
[References]
[1] Edeoga H, Okwu D, Mbaebie B. Phytochemical constituents of some Nigerian medicinal plants. African Journal of Biotechnology, 2005; 4(7): 685–688.
[2] Chi X, Zhang Z, Xu X, Zhang X, Zhao Z, Liu Y, et al. Threatened medicinal plants in China: Distributions and conservation priorities. Biological Conservation, 2017; 210: 89–95.
[3] Zhang H, Xu T, Qin L, Guo C. The Progress in the Identification Skill of Traditional Chinese Medicine and the Introduction of Modern Indentification Technique. Chinese Traditional Patent Medicine, 2000; 22(1): 101–110.
[4] Fuentes S, Hernández-Montes E, Escalona J, Bota J, Viejo C G, Poblete-Echeverría C, et al. Automated grapevine cultivar classification based on machine learning using leaf morpho-colorimetry, fractal dimension and near-infrared spectroscopy parameters. Computers and Electronics in Agriculture, 2018; 151: 311–8.
[5] Chitwood D H, Ranjan A, Martinez C C, Headland L R, Thiem T, Kumar R, et al. A modern ampelography: a genetic basis for leaf shape and venation patterning in grape. Plant Physiology, 2014; 164(1): 259–272. [6] Singh K, Gupta I, Gupta S. Svm-bdt pnn and fourier moment technique
for classification of leaf shape. International Journal of Signal Processing, Image Processing and Pattern Recognition, 2010; 3(4): 67–78.
[7] Wang P, Zhou H L, Xue F Z, Wang Z G. Analysis of infrared spectra of 60 kinds of plant extract of traditional Chinese medicine and study on the identification and evaluation of characteristics of the regional markers associated with cold and heat nature. Spectroscopy and Spectral Analysis, 2014; 34(1): 58–63. (in Chinese)
[8] Rzanny M, Seeland M, Wäldchen J, Mäder P. Acquiring and preprocessing leaf images for automated plant identification: understanding the tradeoff between effort and information gain. Plant Methods, 2017; 13(1): 97.
[9] Du J, Huang D, Wang X, Gu X. Computer-aided plant species identification (CAPSI) based on leaf shape matching technique. Transactions of the Institute of Measurement and Control, 2006; 28(3): 275–285.
[10] Cope J S, Corney D, Clark J Y, Remagnino P, Wilkin P. Plant species identification using digital morphometrics: A review. Expert Systems with Applications, 2012; 39(8): 7562–7573.
[11] Barbedo J G A. Digital image processing techniques for detecting, quantifying and classifying plant diseases. SpringerPlus, 2013; 2(1): 660. [12] Kumar N, Belhumeur P N, Biswas A, Jacobs D W, Kress W J, Lopez I C,
et al. Leafsnap: A computer vision system for automatic plant species identification. Computer Vision–ECCV 2012: Springer, 2012; pp.502–516.
[13] Backhaus A, Kuwabara A, Bauch M, Monk N, Sanguinetti G, Fleming A. LEAFPROCESSOR: a new leaf phenotyping tool using contour bending energy and shape cluster analysis. New Phytologist, 2010; 187(1): 251–261.
[14] Bruno O M, de Oliveira Plotze R, Falvo M, de Castro M. Fractal dimension applied to plant identification. Information Sciences, 2008; 178(12): 2722–2733.
[15] Wu S G, Bao F S, Xu E Y, Wang Y-X, Chang Y-F, Xiang Q-L, editors. A leaf recognition algorithm for plant classification using probabilistic neural network. IEEE International Symposium on Signal Processing and Information Technology, 2007.
[16] Rossatto D R, Casanova D, Kolb R M, Bruno O M. Fractal analysis of leaf-texture properties as a tool for taxonomic and identification purposes: a case study with species from Neotropical Melastomataceae (Miconieae tribe). Plant Systematics and Evolution, 2011; 291(1-2): 103–116. [17] Chaki J, Parekh R. Plant leaf recognition using shape based features and
neural network classifiers. International Journal of Advanced Computer Science and Applications, 2011; 2(10): 41–47.
[18] Pan J, He Y. Recognition of plants by leaves digital image and neural network. 2008 International Conference on Computer Science and Software Engineering, IEEE, 2008.
[19] Fu H, Fan Y, Zhang X, Lan H, Yang T, Shao M, et al. Rapid discrimination for traditional complex herbal medicines from different parts, collection time, and origins using high-performance liquid chromatography and near-infrared spectral fingerprints with aid of pattern recognition methods. Journal of Analytical Methods in Chemistry, 2015(2015): 1–10.
and insects. Field Crops Research, 2014; 156: 199–207.
[21] De Bei R, Cozzolino D, Sullivan W, Cynkar W, Fuentes S, Dambergs R, et al. Non-destructive measurement of grapevine water potential using near infrared spectroscopy. Australian Journal of Grape and Wine Research, 2011; 17(1): 62–71.
[22] Fuentes S, De Bei R, Tyerman S D. Image analysis techniques applied to canopies, berries, plant tissues and leaves. unpublished.[23] Borkowski W. Fractal dimension based features are useful descriptors of leaf complexity and shape. Canadian Journal of Forest Research, 1999; 29(9): 1301–1310.
[23] Foroutan-pour K, Dutilleul P, Smith D L. Advances in the implementation of the box-counting method of fractal dimension estimation. Applied Mathematics and Computation, 1999; 105(2): 195–210.
[24] Liebovitch L S, Toth T. A fast algorithm to determine fractal dimensions by box counting. Physics Letters A, 1989; 141(8-9): 386–390.
[25] Viejo C G, Fuentes S, Li G J, Collmann R, Condé B, Torrico D. Development of a robotic pourer constructed with ubiquitous materials, open hardware and sensors to assess beer foam quality using computer vision and pattern recognition algorithms: RoboBEER. Food Research International, 2016; 89(1): 504–513.
[26] Gonzalez Viejo C, Fuentes S, Torrico D, Howell K, Dunshea F R. Assessment of beer quality based on foamability and chemical composition using computer vision algorithms, near infrared spectroscopy and machine learning algorithms. J Sci Food Agric., 2018; 98(2): 618–627.
[27] Gitelson A A, Gritz Y, Merzlyak M N. Relationships between leaf chlorophyll content and spectral reflectance and algorithms for non-destructive chlorophyll assessment in higher plant leaves. Journal of Plant Physiology, 2003; 160(3): 271–282.
[28] Gitelson A A, Merzlyak M N. Non-destructive assessment of chlorophyll carotenoid and anthocyanin content in higher plant leaves. Principles and Algorithms, 2004: 78–94.
[29] Yang Z H, Hu H P, Bai Y P. Classification method research of leaves based on principal component analysis and POS-SVM. Mathematics in Practice and Theory, 2016; 46(18): 170–175. (in Chinese).
[30] Jia Y F, Min C M, Ju C, Zhu B, Wang P. Application and MATLAB realization of drugs' classification based on the combination of NIRS detection and BP ANN algorithm. International Journal of Biomedical Engineering, 2016; 39(4): 222–225.
[31] Zhang S T, Wang Z Y, Zou X G, Qian Y, Yu L. Recognition of tea disease spot based on hyperspectral image and genetic optimization neural network. Transactions of the CSAE, 2017; 33(22): 200–207.(in Chinese) [32] Wei C S, Lei F H, Ai W X, Feng J, Zheng H, Ma D, et al. Rapid
identification of 6 kinds of traditional Chinese medicines containing resins and other components based on near infrared refectance spectroscopy and PCA-SVM algorithm. Chinese Journal of Experimental Traditional Medical Formulae, 2017; 23(9): 25–31.(in Chinese)
[33] Gitelson A A, Zur Y, Chivkunova O B, Merzlyak M N. Assessing Carotenoid Content in Plant Leaves with Reflectance Spectroscopy. Photochemistry & Photobiology, 2002; 75(3): 272–281.
[34] Yuan M Y, Huang B S, Yu C, Liu Y M, Chen K L. A NIR qualitative and quantitative model of 8 kinds of carbonate-containing mineral Chinese medicines. China Journal of Chinese Materia Medica, 2014; 39(2): 267–272. (in Chinese)