Prediction of methane production performances based on determination
of organic components for different vegetable wastes
Fanfan Cai
1,
Hu Yan
1,
Ruihong Zhang
2,
Guangqing Liu
1*,
Chang Chen
1 (1. Biomass Energy and Environmental Engineering Research Center, College of Chemical Engineering,Beijing University of Chemical Technology, Beijing 100029, China;
2. Department of Biological and Agricultural Engineering, University of California, Davis, CA 95616, USA)
Abstract: The rapid development of the economy has led to rapid consumption of fossil fuels, which results in extremely serious environmental problems. Biomass energy has been accepted as a way to reduce the usage of fossil fuels due to its cleanliness and renewability. In this study, vegetable wastes (VWs), an abundant kind of biomass resource, were treated by anaerobic digestion (AD) to be converted into methane. The total solids (TS), volatile solids (VS), elemental contents, and organic components of 17 kinds of typical VWs were systematically determined. The methane production performances were then measured and ranged from 120.1 mL/g VS (for pepper stem) to 377.7 mL/g VS (for bok choy). To easily and quickly predict the methane yields of VWs, a curvilinear relationship between different organic compositions (e.g., cellulose, hemicellulose, lignin, non-structural carbohydrate, protein, and VFA contents) and methane production was established and proved to be a useful tool for methane prediction. Four kinetic models (first-order model, Fitzhugh model, Cone model, modified Gompertz model) were applied to simulate the process of AD, and Cone and modified Gompertz models were shown to describe the AD process well. This study will not only provide basic data about the characteristics and methane production of 17 kinds of VWs but also contribute a method for predicting the methane yields of vegetable wastes, which is also valuable in future agro-industrial applications.
Keywords: anaerobic digestion, organic components, methane production, vegetable waste, kinetic models DOI: 10.25165/j.ijabe.20191203.4705
Citation: Cai F F, YanH, Zhang R H, Liu G Q, Chen C. Prediction of methane production performances based on the determination of organic components for different vegetable wastes. Int J Agric & Biol Eng, 2019; 12(3): 154–159.
1 Introduction
With the fast development of the economy, the energy demand is increasing every year, which leads to more and more depletion of fossil fuels. According to China Statistical Yearbook 2017, China, which is the second largest economic system in the world, consumed a large amount of coal, oil, and natural gas, which accounts for 86.7% of the total energy consumption in 2016[1]. Inevitability, in the process of utilizing those fossil fuels, various kinds of soil, water, and air pollutants were generated[2-4]. Biomass energy, which is renewable and clean[5], has been regarded as one of the most popular alternatives to fossil fuels[6].
Vegetable waste (VW) is produced in the process of vegetable planting, growing, harvesting, and processing[7]. It is an increasing biomass resource, accounting for approximately 30% of the total vegetable yield[8-10]. Most VWs are currently treated by landfilling and incineration, which lead to secondary pollutants in the environment[7]. Anaerobic digestion (AD), which can
Received date: 2018-10-10 Accepted date: 2019-05-02
Biographies: Fanfan Cai, Master candidate, research interest: environmental engineering, chemical engineering, Email: [email protected]; Hu Yan, PhD candidate, research interest: environmental engineering, chemical engineering, Email: [email protected]; Ruihong Zhang, PhD, Professor, research interest: agricultural engineering, environmental engineering, Email: rhzhang@ ucdavis.edu; Chang Chen, PhD, Professor, research interest: environmental engineering, biological engineering, agricultural engineering, Email: [email protected].
*Corresponding authors: Guangqing Liu, PhD, Professor, research interest: agricultural engineering, environmental engineering. 505 Zonghe Building, Beijing University of Chemical Technology, 15th North 3rd Ring East Road, Beijing
100029, China. Tel/Fax: +86-10-6444-2375, Email: gqliu@ mail.buct.edu.cn.
efficiently convert biomass wastes to methane[11,12], has been applied in managing many conventional agricultural residues, such as lignocellulosic materials and animal manures[13-16]. VW has a high moisture content, organic content, and high biodegradability, which make it a desired feedstock for AD[7,17].
Prior studies have assessed the AD of VWs, and most of them used mixed VWs[10,18-20]. However, AD performance of mixed VWs will be greatly influenced by the vegetable variety, location, season, and even collection method. These factors can cause fluctuations in feedstock and AD performance. It is scientifically necessary and important to investigate waste characteristics and methane production performances, which were rarely reported before. Moreover, as an important energy conversion parameter, the methane yield is directly influenced by the organic components, such as cellulose, hemicellulose, protein, and non-structural carbohydrate[12,21]. It will be very helpful if the methane production of VWs could be quickly estimated by simply measuring the organic components.
The major objectives of this study were as follows: 1) to systematically investigate the characterization and methane production of 17 representative kinds of VWs in China; 2) to explore the correlation between biochemical components and methane yields to predict the methane production performance easily through properties analysis; and 3) to provide some basic data and useful reference for future scientific research and industrial utilization of VWs.
2 Materials and methods
2.1 Feed and inoculum
produced or abandoned in the field, were collected from farms in Shandong province, China, where the output of vegetables is enormous. The common and Latin names, the used parts and the abbreviations are shown in Table 1. After collection, some vegetable wastes were divided into leaves and stems. All the samples were shredded to 3-5 mm using a grinder (JOYOUNG, China). They were then stored at 4°C in a refrigerator.
The sludge was obtained from Donghuashan biogas plant, where only pig manure was used as feedstock. Before use, the inoculum was placed in room temperature. Then, the supernate was removed and the precipitate was use as inoculum.
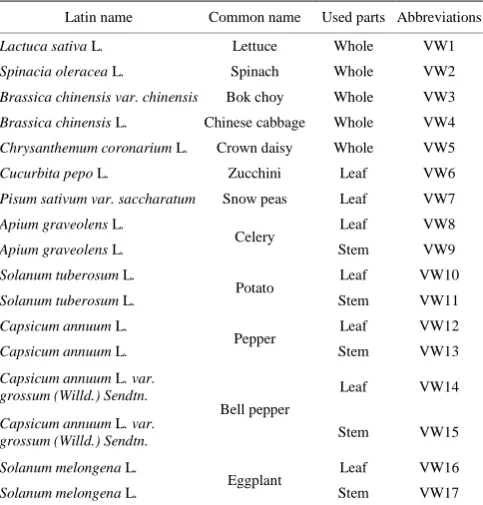
Table 1 Common and Latin name, the used parts, and the abbreviations of 17 kinds of VWs
Latin name Common name Used parts Abbreviations
Lactuca sativa L. Lettuce Whole VW1
Spinacia oleracea L. Spinach Whole VW2
Brassica chinensis var. chinensis Bok choy Whole VW3
Brassica chinensis L. Chinese cabbage Whole VW4
Chrysanthemum coronarium L. Crown daisy Whole VW5
Cucurbita pepo L. Zucchini Leaf VW6
Pisum sativum var. saccharatum Snow peas Leaf VW7
Apium graveolens L.
Celery Leaf VW8
Apium graveolens L. Stem VW9
Solanum tuberosum L.
Potato Leaf VW10
Solanum tuberosum L. Stem VW11
Capsicum annuum L.
Pepper Leaf VW12
Capsicum annuum L. Stem VW13
Capsicum annuum L. var.
grossum (Willd.) Sendtn.
Bell pepper
Leaf VW14
Capsicum annuum L. var.
grossum (Willd.) Sendtn. Stem VW15
Solanum melongena L.
Eggplant Leaf VW16
Solanum melongena L. Stem VW17
Note: VW1-VW5, VW8, and VW9 were edible parts; the others were inedible parts left in the field.
2.2 Characterization methods
(1) Determination of total solids (TS) and volatile solids (VS) TS and VS contents of substrates and inoculum were determined using the APHA standard method[22]. The TS and VS contents of inoculum were measured as (6.00±0.02)% and (2.57±0.00)% (w/w), respectively.
(2) Elemental analysis
The elemental contents of C, N, and H were detected using an organic element analyzer (Vario EL cube, Germany). The oxygen elemental content was then calculated by the equation: C + H + N + O = 99.5% (VS based)[23].
(3) Determination of cellulose, hemicellulose, and lignin contents
The neutral detergent fiber (NDF), acid detergent fiber (ADF), and acid detergent lignin (ADL) were determined using an ANKOM 2000 fiber analyzer (ANKOM, USA)[24]. The ash (AADL) content containing in ADL was measured using the APHA
standard method[22]. The cellulose, hemicellulose, and lignin
contents were calculated as: cellulose = NDF−ADF, hemicellulose = ADF−ADL, lignin = ADL−AADL.
(4) Determination of non-structural carbohydrate, protein, and VFA
The non-structural carbohydrate contents were determined by DNS colorimetric method using 3,5-Dinitrosalicylic acid (DNS) reagent[25]. The protein contents were tested by Branford method
using Coomassie Brilliant Blue G250[26]. The volatile fatty acid (VFA) contents of the raw materials were measured using a gas chromatograph (GC, Agilent 7890A, USA) equipped with a flame ionization detector and DB-wax capillary column (30 m× 530 μm × 1.0 μm).
All the characterizations were measured with three parallels. 2.3 Anaerobic digestion experiments
The organic loading and the feed-to-inoculum ratio of all the anaerobic digesters were set to 5 g VS/L and 1:1[14]. The inoculum and the substrate were firstly added into each digester. Tap water was then poured in to get a working volume of 250 mL. Nitrogen was filled into each digester to remove the oxygen and create an anaerobic condition. All the digesters were put in an incubator with the temperature of 37°C. The blank control without raw material added was also set in the same condition to detect the methane produced by inoculum. Every condition has three parallels.
2.4 Biogas analysis
The biogas production was calculated by incorporating the pressure difference measured by a 3151 WAL-BMP-Test system pressure gauge (WAL Messund Regelsysteme GmbH, Germany) with the following Equation (1)[27]:
Δ h
b
p V C V
R T
(1) where, Vb means the daily biogas production, L; Δp stands for the
absolute pressure difference, kPa; Vh represents the headspace
volume of the anaerobic digester, L; C is the molar volume in normal temperature-pressure, 22.4 L/mol; R refers to the thermodynamic constant, 8.314 kPa/K·mol, and T is the temperature of the incubator, 310.15 K. The biogas compositions were then tested by a GC (Agilent 7890B, USA) equipped with a thermal conductivity detector and an analytical column of Agilent Hayesep Q.
2.5 Maximum theoretical methane production and biodegradability
Maximum theoretical methane production (TMP) means the maximum methane production of the substrate in theory. It was calculated based on the compositions of organic elements, such as carbon (C), hydrogen (H), oxygen (O), and nitrogen (N), as shown in Equations (2) and (3)[28]:
2 4
2 3
3 3
4 2 4 2 8 4 8
3
2 8 4 8
n a b c
a b c n a b c
C H O N n H O CH
n a b c
CO cNH
(2)
4
3 22.4 1000
mL CH 2 8 4 8
TMP
g VS 12 16 14
n a b c
n a b c
(3)
The biodegradability (BD) was calculated as the ratio of the cumulative methane production (CMP) to TMP, as shown in Equation (4):
CMP BD
TMP
(4)
2.6 Kinetic models
Many models have been applied to simulate the AD process[29-32], among which the following four commonly used kinetic models (first-order model, Fitzhugh model, Cone model, and modified Gompertz model) were employed, shown as Equations (5)-(8)[31,33-35]:
[1 exp( )]
o hyd
[1 exp( ) ]n
o hyd
BB k t (6)
1 ( )
o n hyd
B B
k t
(7)
max
exp exp ( ) 1
o
o
R e
B B λ t
B
(8)
where, B represents the CMP, mL/g VS, for a anaerobic digestion time t, d; Bo represents the simulated maximum methane yield,
mL/g VS; khyd stands for hydrolysis rate constant, 1/d; Rmax is the
maximum methane production rate, mL/(g VS·d); e equals to 2.7183; is the lag phase time, d, and n stands for a dimensionless factor.
3 Results and discussions
3.1 Characteristics of VWs
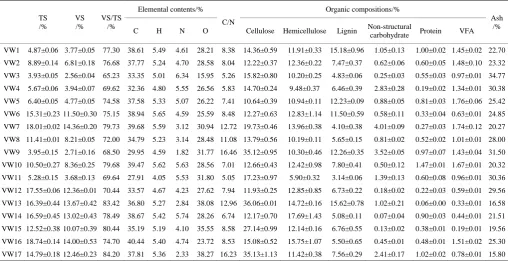
As seen from Table 2, all the selected VWs had extremely different characteristics. Relatively low TS contents of 3.93%± 0.05% to 18.74%±0.14% (w/w) and VS contents of 2.56%±0.05% to 14.36%±0.20% (w/w) were obtained, which were close to other reported mixed VWs[7,18] and indicating the high moisture contents of VWs. In particular, leaf vegetable wastes (e.g., lettuce, spinach, bok choy, Chinese cabbage, crown daisy) had a moisture content of more than 90%[10,20]. In addition, it was found that the leaves of a single species had higher TS contents and VS contents than stems
of the same species in this study, except for pepper, whose VS content of stem (13.67%±0.42%, w/w) was slightly higher than that of leaf (12.36%±0.01%, w/w). Generally high values of VS/TS ranging from 65.23% to 84.20% were calculated for all raw materials, implying high organic matter contents, which were desirable for AD[36]. The C/N ratios ranged from 5.05 to 16.46, most of which were slightly lower than the ideal range of C/N (from 15 to 30)[15,37].
The organic compositions of cellulose, hemicellulose, lignin, non-structural carbohydrate, protein, and VFA are also shown in Table 2. For some stem samples such as celery stem, pepper stem, bell pepper stem, and eggplant stem, lignocellulosic contents were determined to be 57.68%, 66.40%, 46.05%, and 54.11%, respectively, among which cellulose accounted for the majority (35.12%±0.95%, 36.06%±0.01%, 27.14%±0.99%, and 35.13%± 1.13%, respectively). The lignocellulosic contents for the rest of the substrates were less than 45%. For majority of the samples, the contents of non-structural carbohydrate were less than 2%, except for Chinese cabbage, snow pea leaf, celery stem, and eggplant stem, whose contents were 2.83%±0.28%, 4.01%±0.09%, 3.52%±0.05%, and 2.41%±0.17%, respectively. All the VWs had relatively low protein and VFA contents of 0.06%±0.00%- 1.47%±0.01% and 0.19%±0.01%-1.76%±0.06%, respectively.
Table 2 Characteristics of different VWs
TS /%
VS /%
VS/TS /%
Elemental contents/% C/N
Organic compositions/%
Ash /% C H N O Cellulose Hemicellulose Lignin Non-structural
carbohydrate Protein VFA VW1 4.87±0.06 3.77±0.05 77.30 38.61 5.49 4.61 28.21 8.38 14.36±0.59 11.91±0.33 15.18±0.96 1.05±0.13 1.00±0.02 1.45±0.02 22.70 VW2 8.89±0.14 6.81±0.18 76.68 37.77 5.24 4.70 28.58 8.04 12.22±0.37 12.36±0.22 7.47±0.37 0.62±0.06 0.60±0.05 1.48±0.10 23.32 VW3 3.93±0.05 2.56±0.04 65.23 33.35 5.01 6.34 15.95 5.26 15.82±0.80 10.20±0.25 4.83±0.06 0.25±0.03 0.55±0.03 0.97±0.01 34.77 VW4 5.67±0.06 3.94±0.07 69.62 32.36 4.80 5.55 26.56 5.83 14.70±0.24 9.48±0.37 6.46±0.39 2.83±0.28 0.19±0.02 1.34±0.01 30.38 VW5 6.40±0.05 4.77±0.05 74.58 37.58 5.33 5.07 26.22 7.41 10.64±0.39 10.94±0.11 12.23±0.09 0.88±0.05 0.81±0.03 1.76±0.06 25.42 VW6 15.31±0.23 11.50±0.30 75.15 38.94 5.65 4.59 25.59 8.48 12.27±0.63 12.83±1.14 11.50±0.59 0.58±0.11 0.33±0.04 0.63±0.01 24.85 VW7 18.01±0.02 14.36±0.20 79.73 39.68 5.59 3.12 30.94 12.72 19.73±0.46 13.96±0.38 4.10±0.38 4.01±0.09 0.27±0.03 1.74±0.12 20.27 VW8 11.41±0.01 8.21±0.05 72.00 34.79 5.23 3.14 28.48 11.08 13.79±0.56 10.19±0.11 5.65±0.15 0.81±0.02 0.52±0.02 1.01±0.01 28.00 VW9 3.95±0.15 2.71±0.16 68.50 29.95 4.59 1.82 31.77 16.46 35.12±0.95 10.30±0.46 12.26±0.35 3.52±0.05 0.97±0.07 1.43±0.04 31.50 VW10 10.50±0.27 8.36±0.25 79.68 39.47 5.62 5.63 28.56 7.01 12.66±0.43 12.42±0.98 7.80±0.41 0.50±0.12 1.47±0.01 1.67±0.01 20.32 VW11 5.28±0.15 3.68±0.13 69.64 27.91 4.05 5.53 31.80 5.05 17.23±0.97 5.90±0.32 3.14±0.06 1.39±0.13 0.60±0.08 0.96±0.01 30.36 VW12 17.55±0.06 12.36±0.01 70.44 33.57 4.67 4.23 27.62 7.94 11.93±0.25 12.85±0.85 6.73±0.22 0.18±0.02 0.22±0.03 0.59±0.01 29.56 VW13 16.39±0.44 13.67±0.42 83.42 36.80 5.27 2.84 38.08 12.96 36.06±0.01 14.72±0.16 15.62±0.78 1.02±0.21 0.06±0.00 0.33±0.01 16.58 VW14 16.59±0.45 13.02±0.43 78.49 38.67 5.42 5.74 28.26 6.74 12.17±0.70 17.69±1.43 5.08±0.11 0.07±0.04 0.90±0.03 0.44±0.01 21.51 VW15 12.52±0.38 10.07±0.39 80.44 35.19 5.19 4.10 35.55 8.58 27.14±0.99 12.14±0.16 6.76±0.55 0.13±0.02 0.38±0.01 0.19±0.01 19.56 VW16 18.74±0.14 14.00±0.53 74.70 40.44 5.40 4.74 23.72 8.53 15.08±0.52 15.75±1.07 5.50±0.65 0.45±0.01 0.48±0.01 1.51±0.02 25.30 VW17 14.79±0.18 12.46±0.23 84.20 37.81 5.36 2.33 38.27 16.23 35.13±1.13 11.42±0.38 7.56±0.29 2.41±0.17 1.02±0.02 0.78±0.01 15.80 Note: TS and VS were tested based on total materials; elemental contents, organic compositions, and ash contents were measured based on TS.
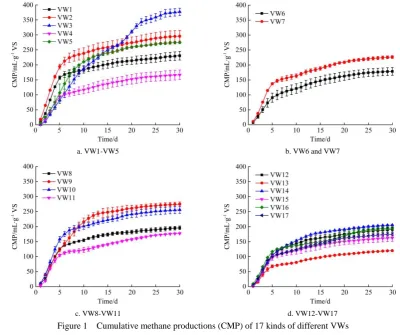
3.2 Methane production performance and biodegradability As seen from Figure 1a-1d, the CMP of all the VWs were in the range of 120.1±1.8 mL/g VS to 377.7±12.1 mL/g VS. The majority of the substrates showed a CMP of more than 150.0 mL/g VS, and nearly half of them had methane yields higher than 200.0 mL/g VS. Among the substrates, leaf vegetable wastes performed especially well, and the highest CMP was produced by bok choy with a value of 377.7±12.1 mL/g VS, which might be attributed to the low TS contents. Generally, the stems of one single species had significantly lower CMP than the leaves of the same species for most VWs. The hardness of stems could be the main reason as they were difficult to dissolve in water. However,
the CMP of celery stem was obviously higher than celery leaf, which might be because of the much higher non-structural carbohydrate content of celery stem (3.52%±0.05%) than leaf (0.81%±0.02%)[12]. The lowest CMP was produced by pepper stem (120.1±1.8 mL/g VS) due to its high lignin content of 15.62%±0.78%, which might influence the methane production[32].
than 250 mL/g VS (296.3±19.5, 377.7±12.1, 275.6±4.3, 275.2±7.0, and 256.1±11.5 mL/g VS, respectively) also showed relatively high BD which exceeded 50% (60.93%, 64.04%, 54.14%, 65.56%, and 51.78%, respectively). The lowest BD was found in pepper stem which also performed the lowest CMP, probably due to the very low nitrogen content (2.88%) which might limit the growth of anaerobic microorganisms[34], and high lignin content (15.62%±0.78%) which was hard to be utilized in AD[37]. Some other VWs, such as Chinese cabbage, zucchini leaf, and eggplant
leaf, also showed relatively low BD (37.33%, 32.98%, and 34.82%, respectively), which could be partly because of the low C/N (5.83, 8.48, and 8.58, respectively) that were extremely less than the optimal C/N ratio for AD[15].
In conclusion, the high CMP and BD for the majority of the selected VWs verified that VWs would be suitable feedstock for methane production during AD. It is worthwhile to employ AD to manage the huge amount of VWs that were left in the field in the future.
a. VW1-VW5 b. VW6 and VW7
c. VW8-VW11 d. VW12-VW17
Figure 1 Cumulative methane productions (CMP) of 17 kinds of different VWs
Note: CMP: cumulative methane production; TMP: theoretical methane production; CMP′: simulated methane production; BD: biodegradability.
Figure 2 Methane productions and BD of 17 kinds of VWs 3.3 Correlation between organic components and CMP
Organic components were completely different in all studied VWs, which resulted in the significant difference of methane production performances. To assess the correlation between organic components and methane yields, a non-linear regression relationship between different organic matters and the CMP was
established. It was found that the function forms for all the organic matters were obviously distinct, e.g., for cellulose and hemicellulose, the forms were linear function together with logarithmic function; for protein, the form was simple linear function; and for lignin, non-structural carbohydrate, and VFA, the forms were linear relation together with quadratic linear relation. Such distinction was shown as the following equation (Equation (9)), in which all the coefficients were calculated using least squares method with a software (Eviews 9.0).
CMP′=641.86+22.11C–431.17lnC–48.63H+422.97lnH–7.31L+ 1.86L2–200.45N+43.74N2+30.68P+315.45V–110.44V2 (9) where, CMP′ means the simulated cumulative methane production,
mL/g VS; C, H, L, N, P, and V represent cellulose, hemicellulose, lignin, non-structural carbohydrate, protein, and VFA, respectively, and all of them are the percentage contents based on TS.
of different organic compositions. 3.4 Kinetic analysis
Kinetic parameters of individual VW during the AD process are important for understanding AD features[38], but there were rare
literatures systematically reported for studied VWs. In this study, four widely used models (first-order, Fitzhugh, Cone, and modified Gompertz models) were chosen to simulate the AD process[31,34], and all the parameters are shown in Table 3.
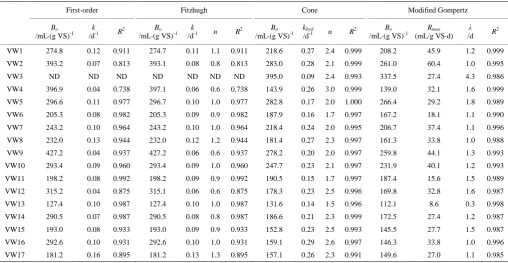
Table 3 Kinetic parameters simulated by the first-order, Fitzhugh, Cone, and modified Gompertz models
First-order Fitzhugh Cone Modified Gompertz
Bo
/mL·(g VS)-1 k
/d-1 R2
Bo
/mL·(g VS)-1 k
/d-1 n R2
Bo
/mL·(g VS)-1
khyd
/d-1 n R2
Bo
/mL·(g VS)-1
Rmax
(mL/g VS·d)
λ
/d R
2
VW1 274.8 0.12 0.911 274.7 0.11 1.1 0.911 218.6 0.27 2.4 0.999 208.2 45.9 1.2 0.999 VW2 393.2 0.07 0.813 393.1 0.08 0.8 0.813 283.0 0.28 2.1 0.999 261.0 60.4 1.0 0.995
VW3 ND ND ND ND ND ND ND 395.0 0.09 2.4 0.993 337.5 27.4 4.3 0.986
VW4 396.9 0.04 0.738 397.1 0.06 0.6 0.738 143.9 0.26 3.0 0.999 139.0 32.1 1.6 0.999 VW5 296.6 0.11 0.977 296.7 0.10 1.0 0.977 282.8 0.17 2.0 1.000 266.4 29.2 1.8 0.989 VW6 205.3 0.08 0.982 205.3 0.09 0.9 0.982 187.9 0.16 1.7 0.997 167.2 18.1 1.1 0.990 VW7 243.2 0.10 0.964 243.2 0.10 1.0 0.964 218.4 0.24 2.0 0.995 206.7 37.4 1.1 0.996 VW8 232.0 0.13 0.944 232.0 0.12 1.2 0.944 181.4 0.27 2.3 0.997 161.3 33.8 1.0 0.988 VW9 427.2 0.04 0.937 427.2 0.06 0.6 0.937 278.2 0.20 2.0 0.997 259.8 44.1 1.3 0.993 VW10 293.4 0.09 0.960 293.4 0.09 1.0 0.960 247.7 0.23 2.1 0.997 231.9 40.1 1.2 0.993 VW11 198.2 0.08 0.992 198.2 0.09 0.9 0.992 190.5 0.15 1.7 0.997 187.4 15.6 1.5 0.989 VW12 315.2 0.04 0.875 315.1 0.06 0.6 0.875 178.3 0.23 2.5 0.996 169.8 32.8 1.6 0.987 VW13 127.4 0.10 0.987 127.4 0.10 1.0 0.987 131.6 0.14 1.5 0.996 112.1 8.6 0.3 0.998 VW14 290.5 0.07 0.987 290.5 0.08 0.8 0.987 186.6 0.21 2.3 0.999 172.5 27.4 1.2 0.987 VW15 193.0 0.08 0.933 193.0 0.09 0.9 0.933 152.8 0.23 2.5 0.993 145.5 27.7 1.5 0.987 VW16 292.6 0.10 0.931 292.6 0.10 1.0 0.931 159.1 0.29 2.6 0.997 146.3 33.8 1.0 0.996 VW17 181.2 0.16 0.895 181.2 0.13 1.3 0.895 157.1 0.26 2.3 0.991 149.6 27.0 1.1 0.985
In the first-order and Fitzhugh models, the values ofR2 were generally low, and the Bo values were much higher than the CMP.
Furthermore, it was found that the experimental results of bok choy could not be simulated by these two models, indicating that first-order and Fitzhugh models might not be appropriate to simulate the AD process for some VWs.
The R2 values obtained by Cone and modified Gompertz models were in the range of 0.991 to 1.000 and 0.985 to 0.999, respectively, which were relatively high. Simulated Bovalues
ranged from 131.6 mL/g VS to 395.0 mL/g VS and from 112.1 mL/g VS to 337.5 mL/g VS for Cone model and modified Gompertz model, respectively, both of which were close to the experimental range of CMP (120.1±1.8 mL/g VS to 377.7± 12.1 mL/g VS). These results suggested that the Cone and modified Gompertz models could simulate the AD process well.
The parameters obtained in these two models (Cone and modified Gompertz models) provided useful information for describing the AD process of VWs. In the Cone model, khyd
stands for the hydrolysis rate constant[34]. A higher khyd value
always implies an easier hydrolysis of the substrate and the khyd
values of studied VWs were ranged from 0.09 d-1 to 0.29 d-1, which were generally higher than Salvinia molesta, rice straw and switchgrass (0.04-0.09 d-1)[31,34], indicating the high degradability of VWs in AD process. In the modified Gompertz model, the kinetic parameter Rmax was the methane production rate and the
Rmax values were in the range of 8.6 mL/(g VS·d) to 60.4
mL/(g VS d). A higher value normally means a higher methane production[34], except for several substrates such as bok choy with high methane yield (377.7±12.1 mL/g VS) simulated a relatively low Rmax value of 27.4 mL/(g VS d). The value
represents the lag phase time, which indicated the adaptation time of microorganisms for the substrates in AD[39]. In this study, the
majority of the substrates was found having relatively low λ values range (from 0.3 d to 1.8 d), suggesting the fast degradation of VWs in AD[36]. Compared to these substrates, the λ value of bok choy was much higher (4.3 d), which might partly due to the lowest VS/TS ratio (65.23%) among all the studied VWs. It also indicated that big difference in organic components might influence the AD process[21,40].
4 Conclusions
In this study, 17 kinds of representative VWs were systematically and comprehensively analyzed. The results showed that all the substrates had different characteristics. The methane yields of all VWs were in the range of 120.1 mL/g VS to 377.7 mL/g VS, and 8 out of 17 had a significantly high methane production over 200.0 mL/g VS. The AD process of VWs was well simulated by the Cone and modified Gompertz models. A correlation between methane yields and individual organic components, which could be used as a quick and reliable tool for methane production prediction in the future, was established. In conclusion, the results obtained in this research provided fundamental knowledge of common vegetable wastes characterizations, their AD performances, and connection between biochemical components and methane yields, which could not only fill in the blanks in scientific research but also facilitate the future utilization of vegetable waste resources.
Acknowledgements
[References]
[1] NBSC. China Statistical Yearbook 2016. Beijing. China Statistics Press, 2017.
[2] Doddapaneni T R K C, Praveenkumar R, Tolvanen H, Rintala J, Konttinen J. Techno-economic evaluation of integrating torrefaction with anaerobic digestion. Applied Energy, 2018; 213: 272–284.
[3] Ettefaghi E, Ghobadian B, Rashidi A, Najafi G, Khoshtaghaza M H, Rashtchi M, et al. A novel bio-nano emulsion fuel based on biodegradable nanoparticles to improve diesel engines performance and reduce exhaust emissions. Renewable Energy, 2018; 125: 64–72. [4] Nikokavoura A, Trapalis C. Graphene and g-C 3 N 4 based
photocatalysts for NO x removal: A review. Applied Surface Science. 2018; 430: 18–52.
[5] Ayala-Parra P, Liu Y, Field J A, Sierra-Alvarez R. Nutrient recovery and biogas generation from the anaerobic digestion of waste biomass from algal biofuel production. Renewable Energy, 2017; 108: 410–416.
[6] Luz F C, Cordiner S, Manni A, Mulone V, Rocco V. Anaerobic digestion of coffee grounds soluble fraction at laboratory scale: Evaluation of the biomethane potential. Applied Energy, 2017; 207: 166–175.
[7] Li D, Chen L, Liu X, Mei Z, Ren H, Cao Q, et al. Instability mechanisms and early warning indicators for mesophilic anaerobic digestion of vegetable waste. Bioresource Technology, 2017; 245(Pt A): 90–97. [8] Ravi P P, Lindner J, Oechsner H, Lemmer A. Effects of target pH-value
on organic acids and methane production in two-stage anaerobic digestion of vegetable waste. Bioresource Technology, 2018; 247: 96–102. [9] Singh A, Kuila A, Adak S, Bishai M, Banerjee R. Utilization of Vegetable
Wastes for Bioenergy Generation. Agricultural Research, 2012; 1(3): 213–222.
[10] Zuo Z, Wu S, Zhang W, Dong R. Effects of organic loading rate and effluent recirculation on the performance of two-stage anaerobic digestion of vegetable waste. Bioresource Technology, 2013; 146: 556–561. [11] Ortner M, Rachbauer L, Somitsch W, Fuchs W. Can bioavailability of
trace nutrients be measured in anaerobic digestion? Applied Energy, 2014; 126: 190–198.
[12] Yin Y, Liu Y J, Meng S J, Kiran E U, Liu Y. Enzymatic pretreatment of activated sludge, food waste and their mixture for enhanced bioenergy recovery and waste volume reduction via anaerobic digestion. Applied Energy, 2016; 179: 1131–1137.
[13] Li R, Duan N, Zhang Y, Liu Z, Li B, Zhang D, et al. Anaerobic co-digestion of chicken manure and microalgae Chlorella sp.: Methane potential, microbial diversity and synergistic impact evaluation. Waste Management, 2017; 68: 120–7.
[14] Li W, Khalid H, Zhu Z, Zhang R, Liu G, Chen C, et al. Methane production through anaerobic digestion: Participation and digestion characteristics of cellulose, hemicellulose and lignin. Applied Energy, 2018; 226: 1219–28.
[15] Sole-Bundo M, Eskicioglu C, Garfi M, Carrere H, Ferrer I. Anaerobic co-digestion of microalgal biomass and wheat straw with and without thermo-alkaline pretreatment. Bioresource Technology, 2017; 237: 89–98.
[16] Croce S, Wei Q, D'Imporzano G, Dong R, Adani F. Anaerobic digestion of straw and corn stover: The effect of biological process optimization and pre-treatment on total bio-methane yield and energy performance. Biotechnology Advances, 2016; 34(8): 1289–1304.
[17] Wu Y, Wang C, Liu X, Ma H, Wu J, Zuo J, et al. A new method of two-phase anaerobic digestion for fruit and vegetable waste treatment. Bioresource Technology, 2016; 211: 16–23.
[18] Li D, Ran Y, Chen L, Cao Q, Li Z, Liu X. Instability diagnosis and syntrophic acetate oxidation during thermophilic digestion of vegetable waste. Water research, 2018; 139: 263–271.
[19] Dhanalakshmi Sridevi V, Rema T, Srinivasan S V. Studies on biogas production from vegetable market wastes in a two-phase anaerobic reactor. Clean Technologies and Environmental Policy, 2014; 17(6): 1689–1697. [20] Zuo Z, Wu S, Qi X, Dong R. Performance enhancement of leaf vegetable
waste in two-stage anaerobic systems under high organic loading rate: Role of recirculation and hydraulic retention time. Applied Energy, 2015; 147:
279–286.
[21] Xu F, Wang Z W, Li Y. Predicting the methane yield of lignocellulosic biomass in mesophilic solid-state anaerobic digestion based on feedstock characteristics and process parameters. Bioresource Technology, 2014; 173: 168–176.
[22] Barbeau E M, Krieger N, Soobader M J. The American Journal of Public Health (AJPH) from the American Public Health Association (APHA) publications. American Journal of Public Health, 2014; 93(10): 1699. [23] Rincón B, Heaven S, Banks C J, Zhang Y. Anaerobic Digestion of
Whole-Crop Winter Wheat Silage for Renewable Energy Production. Energy & Fuels, 2012; 26(4): 2357–2364.
[24] Soest P J V, Robertson J B, Lewis B A. Methods for dietary fiber, neutral detergent fiber, and nonstarch polysaccharides in relation to animal nutrition. Journal of Dairy Science, 1991; 74(10): 3583–3597.
[25] Saqib A A N, Whitney P J. Differential behaviour of the dinitrosalicylic acid (DNS) reagent towards mono- and di-saccharide sugars. Biomass and Bioenergy, 2011; 35(11): 4748–4750.
[26] Liang Q Q, Li Y S. A rapid and accurate method for determining protein content in dairy products based on asynchronous-injection alternating merging zone flow-injection spectrophotometry. Food Chemistry, 2013; 141(3): 2479–2485.
[27] Kafle G K, Kim S H, Sung K I. Ensiling of fish industry waste for biogas production: a lab scale evaluation of biochemical methane potential (BMP) and kinetics. Bioresource Technology, 2013; 127: 326–236.
[28] Yan H, Zhao C, Zhang J, Zhang R, Xue C, Liu G, et al. Study on biomethane production and biodegradability of different leafy vegetables in anaerobic digestion. AMB Express, 2017; 7(1): 27.
[29] Yu L, Ma J, Frear C, Zhao Q, Dillon R, Li X, et al. Multiphase modeling of settling and suspension in anaerobic digester. Applied Energy, 2013; 111: 28–39.
[30] Mani S, Sundaram J, Das K C. Process simulation and modeling: Anaerobic digestion of complex organic matter. Biomass and Bioenergy, 2016; 93: 158–167.
[31] [31] El-Mashad H M. Kinetics of methane production from the codigestion of switchgrass and Spirulina platensis algae. Bioresource Technology, 2013; 132: 305–312.
[32] Shen J, Yan H, Zhang R, Liu G, Chen C. Characterization and methane production of different nut residue wastes in anaerobic digestion. Renewable Energy, 2018; 116: 835–841.
[33] Mao C, Wang X, Xi J, Feng Y, Ren G. Linkage of kinetic parameters with process parameters and operational conditions during anaerobic digestion. Energy, 2017; 135: 352–360.
[34] Syaichurrozi I. Biogas production from co-digestion Salvinia molesta and rice straw and kinetics. Renewable Energy, 2018; 115: 76–86.
[35] Li Y, Jin Y, Li H, Borrion A, Yu Z, Li J. Kinetic studies on organic degradation and its impacts on improving methane production during anaerobic digestion of food waste. Applied Energy, 2018; 213: 136–147. [36] Zhao C, Yan H, Liu Y, Huang Y, Zhang R, Chen C, et al. Bio-energy
conversion performance, biodegradability, and kinetic analysis of different fruit residues during discontinuous anaerobic digestion. Waste Manag., 2016; 52: 295–301.
[37] Li Y, Zhang R, Liu G, Chen C, He Y, Liu X. Comparison of methane production potential, biodegradability, and kinetics of different organic substrates. Bioresource Technology, 2013; 149: 565–569.
[38] Zhao C, Mu H, Zhao Y, Wang L, Zuo B. Microbial characteristics analysis and kinetic studies on substrate composition to methane after microbial and nutritional regulation of fruit and vegetable wastes anaerobic digestion. Bioresource Technology, 2018; 249: 315–321.
[39] Syaichurrozi I, Rusdi R, Hidayat T, Bustomi A. Kinetics studies impact of initial pH and addition of yeast Saccharomyces cerevisiae on biogas production from tofu wastewater in Indonesia. International Journal of Engineering Transactions B Applications, 2016; 29(8): 1037–1046. [40] Molinuevo-Salces B, González-Fernández C, Gómez X, García-González