IJPAR |Vol.8 | Issue 2 | Apr - Jun - 2019
Journal Home page: www.ijpar.com
Research article Open Access
Development and validation of RP-HPLC method for the estimation of
tadalafil in bulk and pharmaceutical dosage forms
A.Sathyaraj*, Dr.M.Ramesh, B.Vijaya
Omega College of Pharmacy, Edulabad, Hyderabad
*Corresponding Author: A.SathyarajEmail: [email protected]
ABSTRACT
A rapid, sensitive, efficient, and reproducible method for the determination of Tadalafil has been developed using reverse phase high performance liquid chromatographic method. This method involves separation of Tadalafil on a reversed phase Agilent Zorbax poroshell 120EC-C18 RP column, 100×4.6 mm, 2.7 µ. The elution was done using a mobile phase consisting of acetonitrile and water (40:60 % v/v) on AGILENT 1120 COMPACT LC HPLC. An external standard calibration method was employed for quantification. A survey of literature revealed spectrophotometric, capillary electrophoresis and a few chromatographic methods for the determination of Tadalafil in bulk drug. Compared to the already reported RP HPLC methods, the current method is rapid, simple and economical for the determination of Purity, accuracy, linearity and Assay of Tadalafil in bulk drug and in pharmaceutical dosage forms.
Keywords:
Gradient, RP HPLC, Tadalafil, AcetonitrileINTRODUCTION
Figure: 1 Structure of Tadalafil
Tadalafil (6R-trans)-6-(1,3-benzodioxol-5-yl)- 2,3,6,7,12,12a-hexahydro-2-methyl-pyrazino [1', 2':1,6] pyrido [3,4-b] indole-1,4-dione is an orally administered phosphodiesterase type 5 (PDE 5) inhibitor which enhances erectile function by increasing the amount of cGMP and this allows the smooth muscle to relax leading to increased blood flow in to the organ and therefore penile erection7,8. Purity determination and assay of Tadalafil was achieved by HPLC using reverse phase. The presence of impurities, even in small amounts, may affect the efficacy and safety of pharmaceuticals. Methods for detecting and controlling impurities are subject to continuous review and improvement. Characterization of impurities is a crucial aspect of drug development and approval, and is central to quality control.
Analytical method validation
[6]
The objective of validation of an analytical procedure is to demonstrate that it is suitable for its intended purpose. A tabular summation of the characteristics applicable to identification, control of impurities and assay procedures is included. Other analytical procedures may be considered in future additions to this document.
Analytical procedure
The analytical procedure refers to the way of performing the analysis. It should describe in detail the steps necessary to perform each analytical test. This may include but is not limited to: the sample, the reference standard and the reagents preparations, use of the apparatus, generation of the calibration curve, use of the formulae for the calculation, etc.
Specificity [1, 3]
Specificity is the ability to assess unequivocally the analyte in the presence of components which may be expected to be present. Typically these might include impurities, degradants, matrix, etc. Lack of specificity of an individual analytical procedure may be compensated by other supporting analytical procedure(s).
Purity Tests: To ensure that all the analytical procedures performed allow an accurate statement of the content of impurities of an analyte, i.e. related substances test, heavy metals, residual solvents content, etc.
Assay (content or potency):
To provide an exact result which allows an accurate statement on the content or potency of the analyte in a sample.
Accuracy [3]
The accuracy of an analytical procedure expresses the closeness of agreement between the value which is accepted either as a conventional true value or an accepted reference value and the value found.
This is sometimes termed trueness.
Precision
The precision of an analytical procedure expresses the closeness of agreement (degree of scatter) between a series of measurements obtained from multiple sampling of the same homogeneous sample under the prescribed conditions. Precision may be considered at three levels: repeatability, intermediate precision and reproducibility. Precision should be investigated using homogeneous, authentic samples. However, if it is not possible to obtain a homogeneous sample it may be investigated using artificially prepared samples or a sample solution. The precision of an analytical procedure is usually expressed as the variance, standard deviation or coefficient of variation of a series of measurements.
Repeatability
Repeatability expresses the precision under the same operating conditions over a short interval of time. Repeatability is also termed intra-assay precision.
Intermediate precision
Intermediate precision expresses within-laboratories variations: different days, different analysts, different equipment, etc.
Reproducibility
Reproducibility expresses the precision between laboratories (collaborative studies, usually applied to standardization of methodology).
Detection Limit
Quantization Limit
The quantization limit of an individual analytical procedure is the lowest amount of analyte in a sample which can be quantitatively determined with suitable precision and accuracy. The quantitation limit is a parameter of quantitative assays for low levels of compounds in sample matrices, and is used particularly for the determination of impurities and/or degradation products.
Linearity
The linearity of an analytical procedure is its ability (within a given range) to obtain test results which are directly proportional to the concentration (amount) of analyte in the sample.
Robustness
The robustness of an analytical procedure is a measure of its capacity to remain unaffected by small, but deliberate variations in method parameters and provides an indication of its reliability during normal usage.
Methodology: validation of analytical
procedures
This document is complementary to the parent document which presents a discussion of the characteristics that should be considered during the validation of analytical procedures. Its purpose is to provide some guidance and recommendations on how to consider the various validation characteristics for each analytical procedure. In some cases (for example, demonstration of specificity), the overall capabilities of a number of analytical procedures in combination may be
investigated in order to ensure the quality of the drug substance or drug product. In addition, the document provides an indication of the data which should be presented in a registrationapplication.
All relevant data collected during validation and formulae used for calculating validation characteristics should be submitted and discussed as appropriate.
EXPERIMENTAL WORK
Analytical method development
Instrumental setup and initial studies
The required instrumentation is setup. Installation, operational and performance qualification of instrumentation using laboratory standard operating procedures (SOP’s) are verified. Always new consumables (e.g. solvents, filters and gases) are used, for example, method development is never started, on a HPLC column that has been used earlier.
The analyte standard in a suitable injection / introduction solution and in known concentrations and solvents are prepared. It is important to start with an authentic, known standard rather than with a complex sample matrix. If the sample is extremely close to the standard (e.g., bulk drug), then it is possible to start work with the actual sample.
Optimization
During optimization one parameter is changed at a time and set of conditions are isolated, rather than using a trial and error approach. Work has been done from an organized methodical plan and every step is documented.
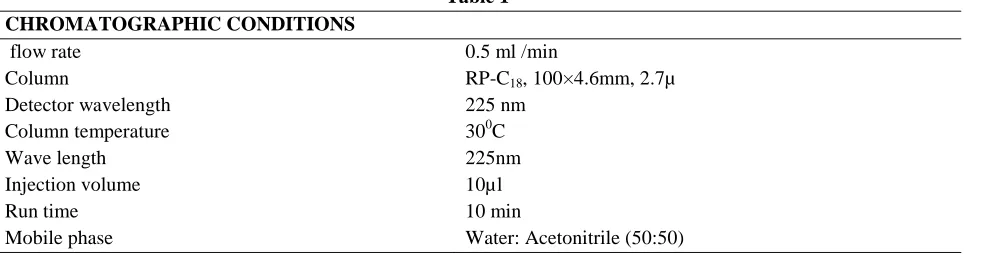
Optimized method
Table 1 CHROMATOGRAPHIC CONDITIONS
flow rate 0.5 ml /min
Column RP-C18, 100×4.6mm, 2.7µ
Detector wavelength 225 nm
Column temperature 300C
Wave length 225nm
Injection volume 10µl
Run time 10 min
PREPARATION OF SOLUTIONS
Preparation of mobile phase
Milli-Q water and Acetonitrile were mixed in the ratio of 60: 40 and sonicated to degas
Preparation of Standard solution
Accurately weighed 10mg of pure drug was taken in clean, dry 10 ml volumetric flask and dissolved in small volume of mobile phase, sonicate to degas and made up to the mark with mobile phase to get a drug concentration of 1000µg/ml. pipette out 0.2ml of standard stock solution into a 10 ml volumetric flask and volume was made up to 10 ml with mobile phase. This solution gave 20µg/ml concentration.
Preparation of sample solution
A total of 10 tablets were accurately weighed and powdered in a mortar. An amount equivalent to 10 mg of Tadalafil was taken and transfers into 10ml volumetric flask and dissolved in 4ml of mobile phase and sonicate for 5min.About 2ml of mobile phase was added and sonicate for further 5mins and dilute to volume with mobile phase. Filter the solution through the membrane filter paper of 0.2µm. 0.2 ml of above solution was pipette out into 10ml volumetric flask and volume was made up to the mark with mobile phase to get a drug concentration of 20µg/ml.
METHOD VALIDATION
Linearity: (Figure 7, 8, Table 4)
The linearity of detector response to different concentrations was studied by analyzing at 5 levels ranging from 50 to 150 % (10, 15, 20, 25 and 30µg/ml). Linear calibration plot for Tadalafil obtained over the calibration ranges tested, i.e., 50 to 150 %. Linear regression analysis of the drug was performed by plotting the peak areas (Y) against the concentration (X). Correlation coefficient (r2) should be greater than 0.99.
Precision
Repeatability
Deternine the precision of test method by assaying twelve samples of Tadalafil as per the test procedure and calculate % RSD of assay results. Inject 10 µl portion of standard preparation and
each sample preparation into the chromatograph and the peak areas were noted. The individual percentage assays should be within 98% to 102 %. The % RSD of percentage assay results should be not more than 2.0%.
Intermediate precision: (Figure 5, 6, Table 3)
Six samples of 20µg/ml solutions were prepared from stock solution and injected into the chromatograph as per test procedure.
The experiment was conducted two times in a day (Intraday precision) and the average % RSD value of the results was calculated. Similarly the experiment was repeated on two different days (Interday precision) and the average % RSD value of the results was calculated. The % RSD of 6 replicate injections should not be more than 2.0%.
Accuracy (Recovery)
Accuracy was checked at three levels of concentrations, i.e., 95%, 100% and 105% each in triplicate and the percentage recovery at each concentration level for Tadalafil was calculated.( Figure 2-4, Table 2) The mean % recoveries at each spike level should be in the range of 98% to 102%. The percentage RSD of recoveries should not be more than 2.0%.
Robustness
The robustness of the proposed method was determined by analysis of aliquots from homogenous lots by differing physical parameters like flow rate and temperature but the responses should still within the specified limits of the assay. (Figure 10, Table 6)
The % assay results of Tadalafil should be within 98% to 102%. The % RSD of Tadalafil Standard should not be more than 2.0%.
The Tailing factor of standard should not more than 2.0 for variation in flow rate, wavelength and temperature.
System Suitability
areas of six replicates for analyte peaks should be not more than 2.0 %.
The number of theoretical plates should be not less than 2000.
The tailing factor for the Tadalafil peaks should be not more than 2.0.
Assay
Assay of different formulations available in the market was carried by injecting sample
corresponding to equivalent weight into HPLC system. And percent purity was found out by following formulae. Recovery studies were carried out. (Figure 11, Table 7)
Calculate the percentage purity of Dapoxetine HCl present in tablet using the formula:
Spl area x Std dil x Avg wt x P
Percentage purity = X 100
Std area x Spl dil x L.C x 100 Where,
P = (%) potency of Dapoxetine HCl working standard use L.C = Label claim
Avg wt = Average weight of tablets
RESULTS AND DISCUSSION
Accuracy
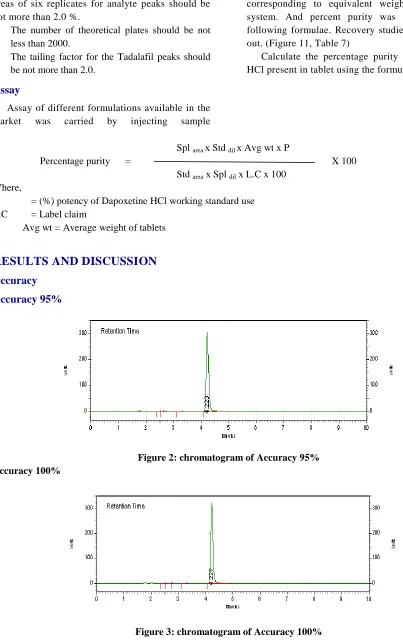
Accuracy 95%
Figure 2: chromatogram of Accuracy 95% Accuracy 100%
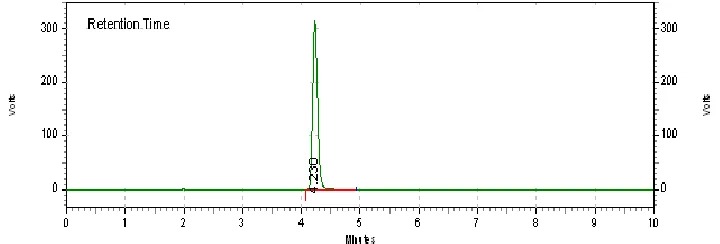
Accuracy 105%
Figure 4: chromatogram of Accuracy 105%
Table 2
Spike level Mean area Amt.present Amt. recoverd % recovered Mean recovery
95% 29332069 19.6 19.5 99.8
99.7
100% 30965406 20.7 20.6 99.5
105% 32107062 21.6 21.5 99.8
The mean recovery for Tadalafil was found to be 99.7%. The acceptance limits should be between 98.0 -102.0%
Precision
Intraday precision
Figure 5: chromatogram of Intraday precision
Interday precision
Table 3
Parameter Intraday precision Interday precision
Avg. area(n) 32108403 32129125
SD 63502.6 58013.6
% RSD 0.19 0.18
The % RSD values for 6 injection samples of Tadalafil was found to be 0.19 which is well within the acceptance limit of <2%
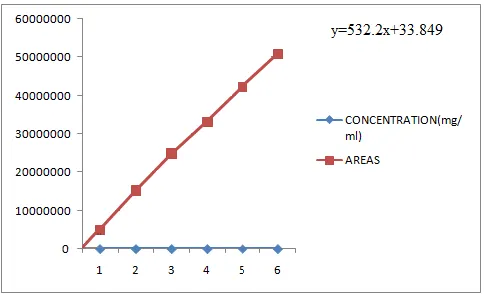
Linearity
Figure 7: chromatogram of Linearity
Table 4
S.No Concentration (mg/ml) Areas
1 0.0102 15257974
2 0.0153 2489064 6
3 0.0205 33052018
4 0.0251 42324846
5 0.0302 50828604
Correlation Coefficient 0.9997
Acceptance Criteria: The correlation coefficient (r2) should be greater than 0.99
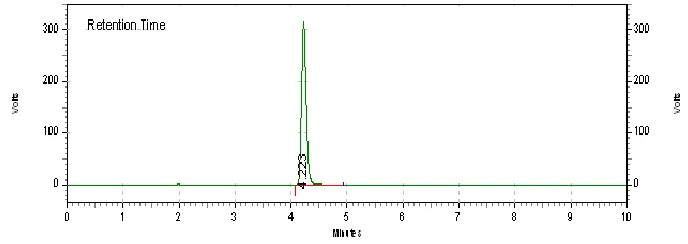
System suitability
Figure 9: chromatogram of System suitability
Table 5
Parameters Tadalafil
Tailing Factor (T) 1.2
Theoretical Plates (N) 12581
Retention Time (R) 4.22
% RSD 0.19
The tailing factor was found to be 1.2 which is found to be in the acceptance limit of not more than 2. The numbers of theoretical plates were found to be 12581 which were found to be in the acceptance
limit of not less than 2000. The % RSD values were found to be 0.19 which is found to be in acceptance limit of <2%
Robustness
Figure 10: chromatogram of Robustness
Table 6:
System suitability parameter Change in flow rate
0.4 ml/min 0.5 ml/min 0.6 ml/min
Theoretical plates 12440 12670 12853
Assay of Tadalafil
Figure 11: chromatogram of Tadalafil sample (assay)
Table 7:
Peak Name Retention time Area
Sample 4.220 31857125
Standard 4.223 32160826
Spl area x Std dil x Avg wt x P
%Assay = X 100 = 100.2%
Std area x Spl dil x L.C x 100
Percentage Label Claim = 100.2 %
SUMMARY AND CONCLUSION
The proposed analytical method is simple, economical, rapid, sensitive, reproducible and accurate for the estimation of Tadalafil. A newer RP-HPLC method was developed for formulations. The proposed method gives reliable assay results with short analysis time using mobile phase of Acetonitrile: water (40:60 % v/v)
The system suitability parameter also reveals that the values within the specified limit for the proposed method. Theoretical plate for Tadalafil
was found to be not less than 2000.The precision (Intraday and Interday) were checked and found to be within limits. This indicates that the method is precise. From the linearity studies, the specified range for Tadalafil was found to be within limits.
The developed method is stability indicating and can be conveniently used by quality control department to determine the related substance and assay in regular Tadalafil production samples and also stability samples.
REFERENCES
[1]. Abdul-Fattah AM, Bhargava HN. A new high performance liquid Chromatography (HPLC) method for the analysis of halofantrine (HF) in Pharmaceuticals. J. Pharm. Biomed. Anal. 29, 2002, 901-908.
[2]. Avarez-Lueje A, Pujol S, Squella JA, Nunez Vergara LJ. A Selective HPLC method for determination of lercanidipine in tablets. J. Pharm. Biomed. Anal. 31, 2003, 1-9.
[3]. Ananda Kumar K, K.Varadharajan, D.Jothieswari, R. Subathrai, G.Sivanseyal, J.Suresh. Determination of Tadalafil in bulk and in tablet dosage forms by RP-HPLC method. Asian Journal of Research in Chemistry. 3(1), 2010.
[4]. B. Prasanna Reddy.B, K. Amarnadh Reddy and M. S. Reddy, “Validation and stability indicating RP-HPLC method for the determination of tadalafil API in pharmaceutical formulations” by Research In Pharmaceutical Biotechnology 2(1), 2010, 001-006.
[6]. Beckett, A. H. and Stenlake, J. B. Practical Pharmaceutical Chemistry. 4th edition, Volume II, CBS Publications and Distributers, New Delhi, 275(90), 2002, 138 – 43.
[7]. Christine A. Farthing, Don E. Farthing, Terri Larus, Itaf Fakhry, Lei Xi, Rakesh C. kukreja.. A simple and sensitive HPLC fluorescence method for the determination of TDF in mouse plasma. Journal of Chromatography B, volume 878, issue 28(15), 2010, 2891-2895.
[8]. Douglas A. Skoog, Donald M. West, James Holler, F. and Stanley R. Crouch. Fundamentals of Analytical Chemistry. 8th edition, Thomson Asia Pvt. Ltd., 2005, 975 – 79.
[9]. FDA Guideline for submitting documentation for stability of human drugs and biologics, Food and Drug Administration, Rockvile, MD, 1987.
[10].ICH. Validation of Analytical Procedures: Methodology, in: Proceeding of the International Conference on Harmonization, Geneva. 1996.
[11].ICH. Guideline on Analytical method Validation, in: Proceeding of International Convention on quality for the pharmaceutical industry, Toronto, Canada 2002.
[12].J. D. Corbin and S. H. Sharron. "Molecular Biology and Pharmacology of PDE-5-Inhibitor Therapy for Erectile Dysfunction". J. Androl. 24, S38-S41.
[13].K. McVary, W. Monnig, J. Camps Jr., J. Young, L. Tseng, G. van den Ende, The Journal of Urology, 177(3), 1071-1077
[14].Kannappan N, Deepthi Yada, Divya Yada, Shashikanth, Mannavalan. R. Method Development and Validation of Stability Indicating Methods for Assay of Tadalafil citrate by HPLC. International Journal of ChemTech Research. 2(1), 2010, 329-333.
[15].Lydia Rabbaa-Khabbaz, Rita Abi Daoud, BS. A sensitive and simple High Performance Liquid Chromatographic Method for Quantification of Tadalafil in Human Serum. The Journal of Applied Research. 6(1), 2006.
[16].Mendham, J., Denney, R. C., Barnes, J. D. and Thomas, M. J. K. Vogel’s Text Book of Quantitative Chemical Analysis. Pearson education, New Delhi, 653(6), 2002, 133 – 140, 269 – 75.
[17].Mohammad Yunoos, D. Gowri Sankar, B. Pragati Kumar, Shahul Hameed. A simple and sensitive UV spectrophotometric method for the estimation of TDF in bulk and tablet dosage forms.
[18].Nikolaou p, Papoutsis I, Athanaselis S, Alevisopoulos G, Khraiwesh A, Pistos C, Spiliopouluc C. Development and validation of a GC/MS method for the determination of TDF in whole blood. J Pharm Biomed Anal. 56(3): 577-81, 2011.
[19].Sharma, B. K. Instrumental Methods of Chemical Analysis. 25th edition, Goel Publishing House, Meerut, India, 2006, 68 – 192, c - 315.
[20].The United States Pharmacopoeia” US Pharmacopoeia convention, Rockville, MD. 26, 2003, 1151.
[21].Webb, D.J.; Freestone, S.; Allen, M.J.; Muirhead, G.J. "Sildenafil citrate and blood-pressure-lowering drugs: results of drug interaction studies with an organic nitrate and a calcium antagonist". Am.J. Cardiol. 83(5A), 1999, 21C–28C. doi:10.1016/S0002-9149(99)00044-2. PMID 10078539
[22].Willard, Meritt. Dean and Settle. Instrumental Methods of Analysis. CBS Publishers and Distributors, New Delhi, 580(7), 1986, 596 – 99, 617 – 51.