349
A.Mellah
2, ETJ
Volume 3 Issue 01 January 2018
Volume 3 Issue 01 January-2018, Page No-349-356
DOI:10.18535/etj/v3i1.02, I.F. - 4.449
© 2018, ETJ
Kinetics Leaching Study of Uranium from Algerian Phosphate by Sulfuric
Acid
S. Chegrouche
1, A. Mellah
2, D. Nibou
3,
B. Bensmain
4, M.Barkat
5, A. Aknoun
61,5,6
Nuclear Research Center of Draria, Atomic Energy Commission, BP 43, 16050 Draria, Algiers, Algeria.
2
Nuclear Research Center of Algiers, Atomic Energy Commission, BP 399, 16000 Algiers, Algeria.
3,4Laboratory of Materials Technology, University of Science and Technology Houari Boumediene, BP 32, 16123,
El-Alia, Bab-Ezzouar, Algiers, Algeria.
Abstract:
The kinetics of dissolution of an Algerian phosphate in sulfuric acid has been investigated in the presence of hydrogen peroxide (H2O2) as oxidant. The effect of different parameters such as leaching time, sulfuric acid concentration, reactiontemperature have been studied in order to optimize various process parameters for maximizing the recovery of uranium. Uranium optimal dissolution efficiency of 87 % was obtained under the following conditions: after 2 h contact time, leaching using 1.5 M sulfuric acid at 50 °C and 1.5 M H2O2. A mathematical model in the following form, including the effects of parameters was
established to express the dissolution kinetics of phosphate ore: 1-(1-X)1/3 and 1-(2/3)X-(1-X)2/3. The activation energy for the process was found to be 12 KJ/mol. This low activation energy supported the findings that the Algerian phosphate leaching rate is controlled by diffusion process.
KEYWORDS: Leaching; Phosphate ore; Sulfuric acid; Diffusion process; Uranium; Phosphoric acid.
I. INTRODUCTION
Phosphate rocks are complex raw materials and mainly used in the production of phosphate fertilizers. The composition of these rocks varies from one deposit to another. Therefore, phosphate rocks from different sources are expected to behave differently in acidulation leaching process [1]. The phosphate ores used for the manufacture of fertilizers are mainly sedimentary, essentially composed of carbonate fluorapatite containing various amounts of impurities such as fluoride, carbonate, clays, quartz, silicates and metal oxides [2, 3].
During the past few decades, different types of leaching processes based on acid leaching and alkaline leaching methods have been developed for uranium ore treatment with different characteristics [4].
The rock phosphate of sedimentary type contains an appreciable amount of uranium in the range of 0.05-0.03 % U308 isomorphous substitution for Ca, whereas the rock
phosphate of igneous origin contains 10 ppm U3O8
associated with an appreciable amount of thorium (232Th) [5]. The rock phosphate deposits of USA, North Africa and Jordon, contain an average U content of 0.01-0.02% U3O8.
However, the Brazilian’s rock phosphate deposits contain 0.03% U3O8 that is higher than the average U content [6].
Today, the world produces 64 000 tons of uranium per year, whereas current reactors require approximately 78 000 tons of uranium each year. The difference comes from drawdown of nuclear stockpiles, especially conversion of weapons materials to fuels. Nevertheless, current mining will not
meet demand in the next decades, thereby incentivizing additional production from a number of mines and permitted projects on standby [7].
Uranium is mainly used as fuel for the production of nuclear energy as harnessed in generating electricity in many countries such as the United States, France, UK, Japan, India, China, and others [8]. Nitric and hydrochloric acids are, usually, the most efficient leaching agents for uranium. Nevertheless, high cost of using nitric acid and corrosive effect of hydrochloric acid make them unpractical for use [2].
On the other hand, sulphuric acid is widely recommended for leaching uranium from phosphate ore. It has been shown that approximately 75% of the global phosphoric acid production involves the use of sulfuric acid for leaching phosphate rocks. Indeed, sulfuric acid is very satisfactory from an industrial viewpoint because calcium is simultaneously precipitated as calcium sulfate and removed by filtration during the leaching [5]. With sulfuric acid leaching, however, the bulk of the radium (roughly 80%) reports to the phosphogypsum, while uranium and thorium mostly follow the phosphoric acid into fertilizer production. In this fact, dissolution with sulfuric acid is the predominant process for recovery of uranium from the rocks [8].
The phosphate rocks are decomposed by sulfuric acid in the manufacturing units of phosphate fertilizers according to the following reaction [9].
CaF2·3Ca3(PO4)2 + 10H2SO4 + → 10CaSO4 + 6H3PO4 +
350
A. Mellah
2, ETJ
Volume 3 Issue 01 January 2018
Various studies showed that the decomposition of phosphate rocks is significantly affected by his chemical composition [4].
In Algeria, the Tébessa region represents a mining district, as it contains a large number of metal deposits and useful substances associated with sedimentary contexts. Among these substances are the natural phosphates, which are concentrated in the south of Tébessa in particular, the mining basin of Djebel Onk, whose resources can reach two billion tons with several deposits (Kef Es senoun, Bled El Hadba, etc.).
The aim of this work is to investigate a leaching process of relatively low-grade uranium ore material from Kef Es Senoun deposit (Djebel Onk, Tébessa), South Eastern of Algiers (Algeria) by using H2SO4 sulfuric acid in the
presence of H2O2 as an oxidant. The effects of solid-liquid
ratio, reaction temperature on the dissolution kinetics of phosphate rock in sulfuric acid solutions have been examined. A mathematical model including the effects of parameters has been established to express the dissolution kinetics of phosphate ore and the apparent activation energy is determined.
II. METHODOLOGY
Material
Phosphate samples used in this study are collected from the deposit of Kef Es Senous (Djebel Onk, Tébessa). After drying at 110°C for 4 h, the ore is finely pulverized in a ball mill and screened to produce a particle size between 88 and 177 µm [9]. All samples are placed in a silica desiccator until use in the study. In all the experiments, the used sulfuric acid had a concentration of 98 % and a density of 1.84g/ml. All the used chemical reagents are analytical grade. Deionized water was also used. The material ground was characterized by XRD and chemical method.
Experimental methods
Chemical composition of uranium tailings were determined by inductively coupled plasma atomic emission spectrometry (ICP). The phase composition was determined by X-ray diffractometer analysis (XRD). The morphology was observed by scanning electron microscopy (SEM) and the uranium content in leaching solution was analyzed by arsenazo III method. The sample of phosphate ore was also characterized by Infrared Spectroscopy (FTIR).
Experimental procedure
All the leaching experiments are carried out with 10 g samples. The investigated material and leaching solution are placed in the round-bottom glass flask equipped with a back cooler and an agitator. The oxidizing agent (H2O2) to
oxidize all uranium to U (VI) form was added. The experiments are performed in the temperature range of 20-50°C, keeping the solid: liquid weight ratio at 1:5. Furthermore, the influence of other parameters such as concentration of the leaching medium, temperature and contact time were also tested. The reaction mixture is agitated at a rate of 300 rpm. Each experiment of leaching is repeated twelfth times in order to confirm the correctness of the obtained results. The uranium leaching rate is defined as the ratio between the contents of U in aqueous and the remaining in solid.
III. RESULTS AND DISCUSSION
Mineralogy characteristic of uranium phosphate
X-ray diffraction analysis of the uranium phosphate showed the presence of Fluorapatite (Ca10(PO4)6F2) and Quartz
(SiO2) as the major phases in the gangue mineral. Besides
Molybdenite of uranium (γMoU2) is also detected as minor
phase (Fig.1).
Figure 1. X-ray spectra of phosphate ore
The chemical analysis of the phosphate ore is given in Table 1. The results confirm the presence of major elements as Ca,
P, Si and U previously identified by XRD as Fluorapatite, Quartz and Molybdenite of uranium.
b
Q F
F
F
F F F
Q
M F
M M
M Q M
M M Q
M
351
A. Mellah
2, ETJ
Volume 3 Issue 01 January 2018
TABLE 1. Chemical composition (wt %) of the sample of phosphate ore.
Component P2O5 SiO2 CaO MgO Fe2O3 SO3 Na2O K2O F U V Al2O3 Organic matters
Content/ wt (%) 29.2 6.8 49.0 1.0 0.3 2.5 2.7 1.25 0.15 2.6 111(ppm) 0.35 4.0
Analysis by Scanning Electron Microscope (SEM)
The SEM observation of the phosphate ore (Fig.2) shows the size of ore particles ranging from 2 to 5 μm. The shape of
the observed grains is non uniform and the surface morphology is not porous.
Figure 2. SEM micrograph of phosphate ore.
Infrared Spectroscopy Analysis
The IR spectrum of the phosphate ore sample is illustrated in Fig.3. The characterization analysis reveals the absorption bands which are as follows:
The bands 3700 to 3200 cm -1 are attributed to the vibrations of the OH groups [11].
The band 2365 cm -1 corresponds to the H-O-H group.
The band observed at 1433 cm -1 corresponds to the Ca-CO3 group.
The band at 880 cm -1 corresponds to the presence of CO3 whereas the band which appears at 1009 cm -1 corresponds to the vibrations of the PO
4 bonds
[12].
The band located at 561 cm-1 characterizes the presence of -PO4 bonds [13, 14, 15, 16].
Figure 3. The IR spectra of Algerian phosphate
Leaching Results
According to Dorozhkinet al., [17], the dissolution process was carried out using various concentrations of sulfuric acid solutions. When H2SO4 is in contact with water, the
following equilibrium equations are established
H2SO4(aq) +H2O → H3O+(aq) + HSO4-(aq) (2)
HSO4-(aq) + H2O → H3O+(aq ) + SO42-(aq) (3)
The dissolution reaction of phosphate are in water can be written as follows
Ca10(PO4)6 . F 2 (s) → 10Ca2+(aq) +6PO4-3(aq) +2F –(aq)
(4)
d
c
878
,41
67
236
5,2
646 143
3,8
152
561
,18
39
102
5,9
445
60 70 80 90 100 110
450 1000
1550 2100
2650 3200
3750
nombre d'onde (cm-1)
T
(%
)
b
352
A. Mellah
2, ETJ
Volume 3 Issue 01 January 2018
The presence of H3O+ ions from the dissolved H2SO4 in the
solution results in the following equilibrium, increasing the dissolution of the ore.
PO4-3(aq) + H3O+ (aq) → H3PO4(aq) (5)
2F – (aq) +2H 3O+(aq) → 2HF(g) +2H2O
(6 )
10Ca2+(aq) +10SO42-(aq) → 10CaSO4 (s) (7)
Thus, the overall reactions can be written as:
Ca10(PO4)6F2(s)+10H2SO4(aq) → 10CaSO4 (s) + 6H3PO4 (aq)
+ 2HF (g) (8)
In the present work various leaching agents are examined e.g. leaching time, sulfuric acid concentration, type of oxidizing agent and temperature on uranium recovery.
Effect of leaching time
Leaching time should be experimentally chosen based on the characteristics of the ore e.g. type of mineralization. In this work, the time of leaching is changed from 0 to 3 h in a series of tests under the same conditions. The experimental results are given in Fig.4 as a relation between uranium leaching efficiency and time. From this Figure, it is clear that, as the time increase from 0.5 to 2 h, the uranium leaching efficiency increases from 15 to 40 % respectively. Further increase in the reaction time up to 2 h, has no effect on uranium leaching. Therefore, 2 h represent the preferred time to maximize Algerian uranium ore dissolution by sulfuric acid.
0 5 10 15 20 25 30 35 40 45
0 30 60 90 120 150 180
E
ff
ic
ie
nc
y
di
ss
ol
ut
io
n
(U
)
%
Time (min)
Figure 4. Effect on time on uranium leaching efficiency.
Effect of H
2SO
4concentration
The effect of sulfuric acid concentration on uranium leaching process from uranium ore is carried out in between 0.5 and 2.0 M of acid concentration. The results are presented in Fig.5. We note that the dissolution rate is
proportional of the sulfuric acid concentration. Indeed, more the concentration of this acid increases more the rate of dissolution is slower and the maximum of leaching is quickly reaches. The present study concludes that the acidity value of 2 M is good to precede further experiments.
0 10 20 30 40 50 60
0 20 40 60 80 100 120
Ef
fic
ie
nc
y
di
sso
lu
tio
n
(U
) %
Time (min)
0.5 M 1 M 1.5 M
Figure 5. Effect of sulfuric acid concentration on leaching process from phosphate ore.
Effect of temperature
The effect of temperature on uranium dissolution is illustrated in Fig.6. The uranium efficiency increased as the temperature increased. However, by increasing the
temperature from 40 to 50°C at t=120 min, a minor raise was observed in the recovery. Therefore, 40°C was selected as the optimum temperature.
353
A. Mellah
2, ETJ
Volume 3 Issue 01 January 2018
30 40 50 60 70 80 90
0 20 40 60 80 100 120
Ef
fic
ie
nc
y
di
ss
ol
ut
ion
(U) %
Time (min)
20°C 40°C 50°C
Figure 6. Effect of temperature on leaching process from phosphate ore.
Effect of oxidation
In order to evaluate the effect of H2O2, a series of leaching
experiments was carried out using 1.5M H2SO4. These
experiments were performed in the presence of different
concentrations of H2O2 varying from 0.1to 0.3 M. The other
leaching conditions were fixed at: a solid/liquid ratio of 1:3, contact time of 120 min, stirring rate of 300 rpm. The result is shown in Fig.7.
0 10 20 30 40 50 60 70 80
0 20 40 60 80 100 120
E
ffi
ci
enc
y
di
ss
ol
ut
ion
(U
) %
Time(mn)
0.1 M
0.2 M
0.3 M
Figure 7. Effect of the H2O2 concentration on the leaching efficiencies of uranium
It is noted that the presence of hydrogen peroxide as an oxidation agent allows increasing the leaching efficiency of uranium from 58.6 to 72.03% for 0.3M. This increase is due to the oxidation of U (IV) to U (VI) under the effect of H2O2. Therefore, 0.3M H2O2 represents the preferred
condition for dissolution experiments.
Thermodynamics studies
The thermodynamic parameters obtained for the dissolution process of phosphate ore were determined by using the following equations [18]:
lnKD= ∆S°dis./R-∆H°dis./RT (9)
Where KD is the distribution coefficient (mL/g), ∆S°dis is the
standard entropy of dissolution (J/mol/K), ∆H°dis is the
standard enthalpy of dissolution (kJ/mol), T is the absolute temperature (K) and R is the gas constant (8.314J/mol/K).
The experiments have been carried out at 298.15, 313.15 and 333.15 K and the values of ∆S°dis and ∆H°dis were
obtained from the slopes and intercepts of linear regression of lnKD versus 1/T.
The standard Gibbs free energy ∆G°dis values (kJ/mol) were
determined through the equation:
∆G°dis = ∆H°dis- T∆S°dis (10)
The values of ∆H°dis, ∆S°dis and ∆G°dis are reported in Table
354
A. Mellah
2, ETJ
Volume 3 Issue 01 January 2018
TABLE 2. Thermodynamic parameters for dissolution of phosphate ore as function temperature
ΔH°dis (kJ/mol) ∆S°dis (J/mol/K) ∆G°dis (kJ/mol)
T=293.15 K T=313.15 K T=323.15 K
Phosphate ore 2 4.839 92.459 -2.306 -3.971 -5.139
From the Table 2, the negative values of the Gibbs free energy show that the dissolution process is spontaneous and that the degree of spontaneity of this reaction increases with increasing temperature. The observed negative ∆H°dis value
confirms the endothermic nature of the process.
Kinetic study
The kinetics of the reaction dissolution of phosphate ore has been studied. Three kinetic models [19, 20] represented in the following equations were applied and the reaction rate constants were determined:
First order:
dCt/dt= k1(C0-C1) (11)
Second order:
dCt/dt= k2(C0-C1)2 (12)
Third order:
dCt/dt= k3(C0-C1)3 (13)
Where kn, n, Co and Ct are respectively the reaction rate
constants (L(n − 1) mol(1 − n)/min), reaction order, the initial uranium concentration (mol/L) and the dissolved uranium
concentration (mol/L). After linearization, the following expressions were obtained.
First order:
k1= 1/t (Ln C0/(C0-Ct) (14)
Second order:
k2= (1/t) Ct/C0((C0-Ct)) (15)
Third order:
k3 = (1/2t)(1/(C0-Ct)2-(1/C0)2). (16)
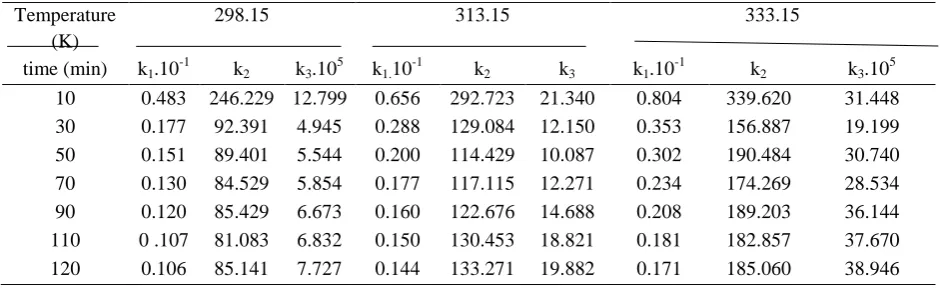
The reaction rate constants were studied up to 2 h at three temperatures T1 = 298.15, T2 = 313.15 and T3 = 333.15 K.
The Eqs. (14), (15) and (16) were used and the results given in Table 3. It was noticed that the value of the second order reaction rate constant k2 (L/mol/min) remains constant,
whereas the first (k1) and the third (k3) order reactions rate
constants vary during all the running time. We can conclude that the uranium dissolution reaction obtained in the thermodynamic study followed the second order (Table 3).
TABLE 3. Kinetic parameters for uranium from phosphate leaching as function temperature
In order to establish the kinetic and the rate-controlling step for the leaching of uranium using sulfuric acid, the experimental data could be analyzed according to the heterogeneous reaction models [21, 22].
For chemical reaction control, we can write:
Kc= 1-(2/3) X – (1-X)2/3 (17)
For surface diffusion control, we can write:
Kd= 1- (1-X)1/3 (18)
Where kc, kd are the apparent reaction rate constants (min-1)
for each case respectively and t is the leaching time (min.) and X is the fractional conversion of the ore where X can be
expressed as the amount of uranium in the solution by the total amount of uranium in initial sample.
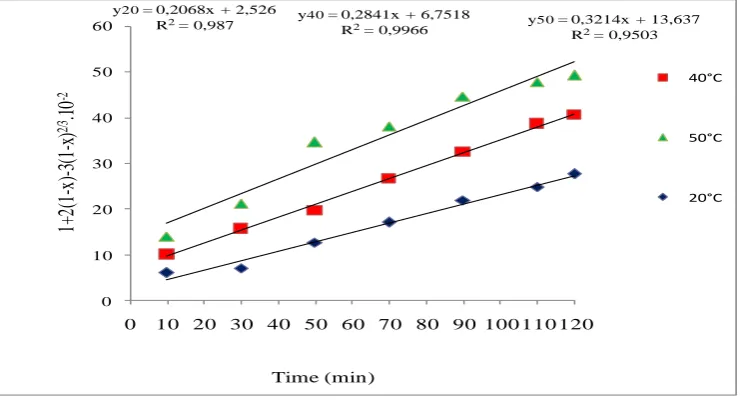
In order to determine rate of the reaction of phosphate dissolution, we can carried out by plotting 1-(2/3)X-(1-X)2/3 and 1-(1-X)2/3 versus the time at various temperature (20, 40 and 50°C) as shown in Fig8 and Fig.9. The rate constant values Kc and Kd, calculated from equations (17) and (18)
respectively and their correlation coefficient for each temperature, are given in Table 4.
Temperature (K)
298.15 313.15 333.15
time (min) k1.10-1 k2 k3.105 k1.10-1 k2 k3 k1.10-1 k2 k3.105
10 0.483 246.229 12.799 0.656 292.723 21.340 0.804 339.620 31.448 30 0.177 92.391 4.945 0.288 129.084 12.150 0.353 156.887 19.199
50 0.151 89.401 5.544 0.200 114.429 10.087 0.302 190.484 30.740 70 0.130 84.529 5.854 0.177 117.115 12.271 0.234 174.269 28.534 90 0.120 85.429 6.673 0.160 122.676 14.688 0.208 189.203 36.144
355
A. Mellah
2, ETJ
Volume 3 Issue 01 January 2018
TABLE 4. The kd, kc , and correlation coefficients values for different temperatures.
Temperature (°C)
Apparent rate constant Correlation coefficient (R2) Kc (10-2 min-1) Kp (10-2 min-1) KC Kp
20 40 50
20.68 28.41 32.14
18.85 22.05 23.31
0.9870 0.9966 0.9503
0.9845 0.9966 0.9365
y40= 0,2205x + 17,886
R2= 0,9966 y50= 0,2331x + 23,921
R2= 0,9365
y20= 0,1885x + 12,332 R2= 0,9845
0 10 20 30 40 50 60
0 10 20 30 40 50 60 70 80 90 100 110 120
1-(1
-x)
1/
3.10
-2
Time (min)
40°C
50°C
20°C
Linear (40°C) Linear (50°C)
Figure 8. Plotting between 1-(2/3)X-(1-X)2/3 and leaching time for uranium dissolution at T=20, 40 and 50°C
y40 = 0,2841x + 6,7518
R2= 0,9966 y50= 0,3214x + 13,637
R2= 0,9503
y20= 0,2068x + 2,526 R2= 0,987
0 10 20 30 40 50 60
0 10 20 30 40 50 60 70 80 90 100 110 120
1+
2(
1-x)
-3
(1
-x)
2/
3
.10
-2
Time (min)
40°C
50°C
20°C
Figure 9. Plotting between (1-X)1/3 and leaching time for uranium dissolution at T=20, 40 and 50°C.
These results indicate that the dissolution rate of Algerian phosphate ore in sulfuric acid solution is controlled by diffusion process.
VI. CONCLUSION
The dissolution kinetics of Algerian phosphate in sulfuric acid solutions was studied at the various parameter levels. Based on the results of this study, the following conclusions can be expected:
Several batch experiments were performed to optimize the uranium dissolution for Algerian phosphate by means sulfuric acid.
Dissolution of uranium from the phosphate ore in sulphuric acid was relatively fast and the reaction was nearly complete within 2h at 50° C, giving 87 % uranium recovery at a 1.5 M molar concentration of acid.
356
A. Mellah
2, ETJ
Volume 3 Issue 01 January 2018
reaction is more favorably by the second order dissolution.
A mathematical model in the following form, including the effects of parameters was established to express the dissolution kinetics of phosphate ore: 1-(1-X)1/3 and 1-(2/3)X-(1-X)2/3. The activation energy for the process was found to be 12 KJ/mol. The dissolution process was thermodynamically
spontaneous under studied conditions.
The dissolution rate of Algerian phosphate ore in sulfuric acid solution is controlled by diffusion process.
REFERENCES
1. Ashraf, M., Iqbal Zafar, Z., Ansari, T., 2005. Selective leaching kinetics and upgrading of low-grade calcareous phosphate rock in succinic acid. Hydrometallurgy 80, 286–292,
2. Becker, P., 1989. Phosphates and Phosphoric Acid, vol. 6. Fertiliser Science and Technology Series Marcel Dekker, New York.
3. Abdel-Hamied, M. A., Abu El Azm, M. G., Orabi, A. H., 2012. Recovery of Uranium from Abu-Rushied Granitic Rocks Using Diluted Phosphoric Acid Leaching Agent. Arab Journal of Nuclear Sciences and Applications, 45 (2) 97-116.
4. Chien, S.H., 1998. Evaluation of Gafsa (Tunisia) and Djebel Onk (Algeria) phosphate rocks and soil testing of phosphate rock for direct application. In: Johnston, A.E., Syers, J.K. (Eds.), Nutrient Management for Sustainable Food Production in Asia, Proc. IMPHOS-AARD/CSAR. Wallingford, UK, CAB International, pp. 175–185.
5. Moussa, M. A., A. M. Daher, Omar, S. A., Khawassek, Y. M., Haggag, E. A., Gawad, E.A., 2014. Kinetics of leaching process of Uranium from EL-Missikat shear zone Eastern Desert, Egypt. Journal of Basic and Environmental Sciences 1 65 – 75.
6. Guimarães, R.C, Araujo, A.C., Peres, A.E.C., 2005. Reagent in igneous phosphate ores flotation. Miner Eng, 18 199–204.
7. Al-Fariss, T.F., Ozbelge, H.O., El-Shall, H.S., 1992. On the phosphate rock beneficiation for the production of phosphoric acid in Saudi Arabia. J. King. Saudi. Univ. Eng .Sci. 4, 13–32.
8. Beltrami, D., Cote, G., Mokhtari, H., Courtaud, B., Moyer, B.A., Chagnes, A., 2014. Recovery of Uranium from Wet Phosphoric Acid by Solvent Extraction Processes.Chem. Rev.114(24), 12002– 12023.
9. International Atomic Energy Agency (IAEA). Uranium 2011: Resources, Production and Demand; OECD Publishing: 2012.
10. Lassis, M., Mizane, A., Dadda, N., Rehamnia, R., 2015. Dissolution of Djebel Onk phosphate ore using sulfuric acid. Environmental nanotechnology monitoring and management 412-416.
11. Habashi, F., 1985. The recovery of lanthanides from rock phosphate. J. Chemical Technol. Biotech., 35A: 5–14.
12. Bunus, F.T., 1977. Determination of low levels of uranium in solutions obtained by acid attack on phosphate. Talanta. 24(2), 117-20.
13. Habashi, F., 1986. Fluorination of water supplies and the phosphate industry. Arab Mining J., 6: 62– 4. rock. Talanta, 24, 117– 20.
14. Tchangbeddji, G., Djeteli, G., Ani Kili, K., Savariault, J.M., and Lacout, J.L., 2003. Chemical and structural characterization of natural phosphate of Hahotoe (Togo). Bull. Chem. Soc. Ethiop. 17(2), 139-146.
15. Frost, R.L., Erickson, K.L., Adebajo, M.O., Weier, M.L., 2005. Near-infrared spectroscopy of autunites . Spectrochimica Acta Part A 61, 367– 372.
16. Yaavoubi, H., Zidania, O., Moufliha, M., Gourai, M., Sebti, S., 2014. Removal of cadmium from water using natural phosphate as adsorbent. Procedia engineering, 83, 386-393.
17. Dorozhkin, V. S., Fundamentals of the wet-process phosphoric acid production., 1996. 1. Kinetics and mechanism of the phosphate rock dissolution. Ind. Eng. Chem. Res., 35, 4329-4335.
18. Bezzi, N., Aïfa, T., Hamoudi, S., Merabet, D., 2012. Trace elements of kef Es sennoun natural phosphate (djebel onk, algeria) and how they affect the various mineralurgic modes of treatment, Procedia Engineering. 42, 1915 – 1927. 19. Elouear, Z., Bouzid, J., Boujelben, A., Feki, M.,
Jamoussi, F., Montiel, A., 2008. Heavy metal removal from aqueous solutions by activated phosphate rock, Journal of Hazardous Materials. 156, 412–420.
20. Cotton, F A and Wilkinson, G., 1988. Advanced Inorganic Chemistry. 5th ed., New York: Wiley, pp 456–458.
21. Khawassek, Y. M., Eliwa, A.A., Haggag, E. A., Mohamed, S.A., Omar, S. A., 2016. Kinetics leaching process of uranium ions from El-Erediya Rock by sulfuric acid solution. International Journal of Nuclear Energy Science and Engineering. 6, 35-48.