Please cite this article as: M. Fazli-Khalaf, A. Hamidieh, A Robust Reliable Forward-reverse Supply Chain Network Design Model under Parameter and Disruption Uncertainties, International Journal of Engineering (IJE), TRANSACTIONS B: Applications Vol. 30, No. 8, (August 2017) 1160-1169
International Journal of Engineering
J o u r n a l H o m e p a g e : w w w . i j e . i r
A Robust Reliable Forward-reverse Supply Chain Network Design Model under
Parameter and Disruption Uncertainties
M. Fazli-Khalafa, A. Hamidieh*b
a Department of Industrial Engineering, Faculty of Engineering, Kharazmi University, Tehran, Iran
b Industrial Engineering group, Department of Engineering, Faculty member of Payamnoor University, Tehran, Iran
P A P E R I N F O
Paper history: Received 09 August 2016
Received in revised form 29 April 2017 Accepted 07 July 2017
Keywords: Supply Chain Reliability Social Responsibility Robustness
Stochastic Programming
A B S T R A C T
Social responsibility is a key factor that could result in success and achieving great benefits for supply chains. Responsiveness and reliability are important social responsibility measures for consumers and all stakeholders that strategists and company managers should be concerned about them in long-term planning horizon. Although, presence of uncertainties as an intrinsic part of supply chains could adversely affect the best set plans by field experts. Accordingly, uncertainty of parameters and uncertainties caused by disruptions should be regarded in planning process of networks to prevent unpredictable negative consequences of such uncertainties for all echelons of supply chain. Based on enumerated matters, the aim of this paper is to design a reliable multi-echelon closed loop supply chain network model that maximizes social responsibility while minimizing fixed establishing and variable processing costs of network design. To cope with uncertainty of parameters, stochastic programming is applied and an effective reliable modelling method is employed to appropriately control unpleasant economic impacts of disruptions. Notably, an efficient robust programming method is applied to give the decision makers the capability to control level of risk-averseness of decisions while modelling uncertain parameters. Finally, the proposed model is solved and its outputs are analyzed on the basis of generated test problems which shows correct performance and applicability of extended model in real world problems.
1. INTRODUCTION1
Supply chain networks consist of many different echelons that their performance is closely dependent on each other. Their coordinated operation could significantly help to improving service level and lowering the costs [1, 2]. Mission of supply chain managers is to locate facilities in different echelons of network and allocate flow of products between facilities in a way that the desired goals are achieved [3]. However, incidence of disruptions as a main source of uncertainty in supply chain networks could drastically disturb harmonic performance of supply chain members [4]. Disruptions are natural and manmade disasters such as earthquake, flood and terroristic attacks that are unpredictable events and out of human beings control [5]. Therefore, extending models that are capable
*Corresponding Author’s Email: [email protected] (A. Hamidieh)
of efficiently controlling disruptions effects could be regarded as a long term competitive advantage.
Numerous methods have been developed by researchers to control adverse effects of disruptions. Snyder and Daskin [6] extended a bi-objective, two echelon model minimizing total costs of network design aside while minimizing additional transportation costs caused by disruptions strike. Peng et al. [7] applied a scenario-based approach called p-robustness and bounded added disruption costs by a predefined percent. They applied genetic algorithm to solve proposed model owing to its complexity. Vahdani et al. [8] employed method extended by Snyder and Daskin [6] to model and cope with disruptions effects in a closed loop supply chain network. They proposed a hybrid multi-objective programming method by using robust optimization and fuzzy programming approaches to solve the presented bi-objective model. Hatefi et al. [9] extended a reliable model by application of p-robustness method. They applied fuzzy
programming method to model uncertainty of input parameters. Fereiduni and Hamzehee [10] presented a P-robust reliable programming model for humanitarian relief supply chain. They have assumed that the country affected by disruptions strike manages global aids and distributes global aids via internal distribution centers. They have extended a bi-objective programming model that minimizes unsatisfied demand of zones aside while minimizing total cost of distribution relief commodities. Notably, extended models have some deficiencies. Firstly, in most of researches it is assumed that disruptions ruin the whole processing capacity of facilities [6, 11]. However, partial disruption is probable. Also, capacity of facilities are disregarded in extended models in reliable supply chain design scope [6, 7, 12]. The other important point is that extending a general model that includes all forward and backward echelons is disregarded in literature [12].
Uncertainty of input parameters in such problems is another important issue that should be managed and planned carefully. Supply chain management includes a wide range of uncertain parameters such as demand, capacity of facilities and costs. Fluctuation of these parameters could significantly affect long term plan of companies and cause high economical risks for investors [13, 14]. Notable point is that stochastic-scenario based models applied to model disruptions have disregarded uncertainty of parameters that is a significant deficiency in extended models [5, 8]. Also, some researchers have employed fuzzy programming approach to cope with uncertainty of parameters in reliable network design scope. However, these methods are unable to control risk-averseness of decisions with regard to value of uncertain parameters [5, 15, 16]. It is useful to extend a robust reliable stochastic programming method that is capable of modelling uncertain parameters and controlling risk-aversion of outputs based on decision makers’ opinion.
Cost minimization or profit maximization are common objectives used in extended models in reliable supply chain design scope. Other applied objectives are minimization of additional costs made by disruptions [6, 17]. Although, caring about social responsibility or responsiveness aside with minimization of costs could help to improve social position of companies and profitability of organizations [18]. Social responsibility is related to activities of companies that affect people’s lives and natural environment. One of the most important aspects of social responsibility is responsiveness and reliability of network [19]. Modelling reliable supply chains could result in attraction of competitors’ market share and increasing customers’ loyalty.
Regarding enumerated matters, the aim of this paper is to design a reliable closed loop supply chain network that differs from other available researches is as follows:
Designing a reliable bi-objective model maximizing social responsibility aside with minimization of network design costs
Extending a general closed loop supply chain consisting of different echelons of forward and backward networks that is applicable in most of industrial cases
Presenting a model capable of modelling partial and complete disruption of facilities while considering capacity of facilities
Proposing a hybrid robust scenario-based
programming model that models uncertainty of parameters and is able to control risk-aversion level of output decisions by applying an efficient robust programming method
Remainder of this paper is organized as follows. Precise problem definition and main assumptions related to extended model and also Indices, parameters and decision variables required to model extended network are provided aside with model formulation and its comprehensive description in Section 2. Effective robust programming model that is capable of adjusting risk-averseness level of output decisions based on decision makers’ preferences is introduced in Section 3. Generated test problems and analysis of outputs of the proposed model are presented in Section 4. Section 5 isdevoted to future research guidelines, conclusions about proposed model and some managerial proposals.
2. PROBLEM DEFINITION AND MODEL
FORMULATION
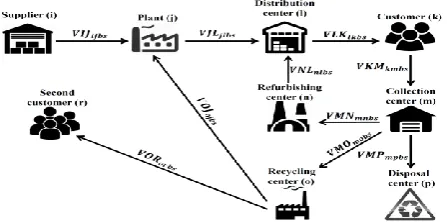
Our multi-echelon closed loop supply chain includes some different facilities in forward and backward directions of supply chain concurrently. As it is illustrated in Figure 1, raw materials are transported to manufacturing plants to produce final products in forward direction of network. Then, they are delivered to customer zones by storage or in other words distribution centers. In backward direction, end-of-life or damaged products are sent to collection/inspection centers. Some of the returned products are useless and harmful. Therefore, they should be safely disposed. In this regard, they are transferred to disposal centers. Also, some products are capable of refurbishment and they are transported to refurbishing centers. Refurbished products are sent to distribution centers for redistribution to customer zones as new final products. A part of returned products are not usable, but they are recoverable. This type of products is transferred to recycling centers to recover their raw materials. Gained raw materials are sent to plants and second customer zones. Noteworthy, recycling of raw materials has positive environmental impact beside positive economic gains. Also, it could improve customer loyalty owing to making better competitive position among competitors by considering environmental and natural resources issues.
Figure 1. Proposed closed loop supply chain network structure
main role players of supply chains are affected by disruptions. Some scenarios are defined that assign percent of disrupted capacity and determines probability of each scenario. Possible percent of lost capacity of facilities owing to disruptions strike would be determined based on opinion of field experts and company managers regarding different disruption scenarios. In other words, at each scenario, different disruption influences would be modelled based on prediction and experience of company decision makers. These scenarios help to design a closed loop supply chain that performs well in front of disruptions by lowest cost. In this method, plants should be opened in a way that cause less production and transportation costs and lowest lost capacity based on the total defined scenarios.
The other important point is that reliability of transportation modes is regarded and maximized to deliver and recover products in the fastest way and make a responsive supply chain to design a network that pays attention to social responsibility factors. In this regard, it is assumed that there are some transportation modes between consecutive echelons of supply chain network that more reliable ones need more investments or transportation costs. There are some reasons that reliability ratio between different echelons of supply chain network should be different. First of all, transportation modes that could be used among consecutive echelons of network are not the same. In this regard, using all transportation modes is not possible because of climate of different regions of countries. For example, in some regions owing to presence of mountains using train is more reliable and cheaper than other transportation modes and accordingly using big trucks for transferring products via mountainous roads is very hard or impossible. The other important point is that reliability of transportation modes in all regions is not the same. In other words, working stability and durability of using transportation modes would be different regarding climate of different regions of countries. It should be noted that all echelons of networks including forward and reverse echelons affect responsiveness of network. Therefore, reliability of transportation modes between all consecutive echelons of network should be maximized as
an objective of supply chain network design. With regard to the alluded matters, increasing reliability would be in conflict with cost objective that their output value should be balanced based on the opinion of field experts and company decision makers.
Based on the enumerated matters, the following assumptions are regarded to extend closed loop supply chain model:
Forward supply chain works in pull mechanism and backward performs in push mechanism.
Demand of customers and second hand product customer should be completely satisfied.
Number and location of customers, suppliers, refurbishing centers, disposal centers and second hand customer zones is predetermined.
All returned products should be collected and inspected by collection/inspection centers.
Some scenarios are defined to model uncertainty of parameters (i.e. demand) and percent of disrupted capacity caused by disruptions.
Extended network is single product and shortage is not allowed.
Notably, the main aim of extended network is to determine product flow and employed transportation mode between consecutive echelons of supply chain network. Also, it aims to locate plants, distribution and recycling centers and specify number of opened facilities and their corresponding assigned capacity level. These matters would be done based on thevbalance between cost minimization objective and reliability maximization.
The following nomenclatures should be rendered to formulate the model.
Indices:
I Index of suppliers (i=1,…,I) J Index of plants (j=1,…,J)
L Index of distribution centers (l=1,…,L) K Index of customer zones (k=1,…,K)
R Index of second hand customer zones (r=1,…,R) N Index of refurbishing centers (n=1,…,N)
M Index of collection/inspection centers (m=1,…,M) O Index of recycling centers (o=1,…,O)
P Index of disposal centers (p=1,…,P) Z Index of capacity levels of plants (z=1,…,Z)
T Index of capacity levels of distribution centers (t=1,…,T)
Q Index of capacity levels of recycling centers (q=1,…,Q)
B Index of transportation modes (b=1,…,B)
S Index of scenarios (s=1,…,S)
Parameters:
𝐹𝐽𝑗𝑧 Fixed cost of establishing a factory at potential location j with capacity level z
𝐹𝐿𝑙𝑡 Fixed cost of establishing a distribution center at potential location l with capacity level t
𝐹𝑂𝑜𝑞 Fixed cost of establishing a recycling center at potential location o with capacity level q
𝐶𝐼𝑖 Cost of purchasing each unit of raw material from supplier i
𝐶𝐿𝑙 Holding cost of each unit of product at distribution center l
𝐶𝑀𝑁𝑚 Processing and packaging cost of each unit of product for recovery at collection center m
𝐶𝑀𝑂𝑚 Processing and packaging cost of each unit of product for refurbishing at collection center m
𝐶𝑀𝑃𝑚
Processing and packaging cost of each unit of product for disposal at collection center m
𝐶𝑁𝐿𝑛
Refurbishment cost of each unit of product at refurbishing center n
𝐶𝑂𝑜
Recycling cost of each unit of product at recycling center o
𝐶𝑃𝑝 Disposal cost of each unit of product at disposal center p
𝑇𝐼𝐽𝑖𝑗𝑏 Transferring cost per unit of raw material from supplier i to factory j using transportation mode b
𝑇𝐽𝐿𝑗𝑙𝑏
Transferring cost per unit of final product from factory j to distribution center l using transportation mode b
𝑇𝐿𝐾𝑙𝑘𝑏
Transferring cost per unit of final product from distribution center l to customer zone k using transportation mode b
𝑇𝐾𝑀𝑘𝑚𝑏
Transferring cost per unit of final product from customer zone k to collection center m using transportation mode b
𝑇𝑀𝑁𝑚𝑛𝑏
Transferring cost per unit of final product from collection center m to refurbishing center n using transportation mode b
𝑇𝑀𝑂𝑚𝑜𝑏
Transferring cost per unit of final product from collection center m to recycling center o using transportation mode b
𝑇𝑀𝑃𝑚𝑝𝑏
Transferring cost per unit of final product from collection center m to disposal center p using transportation mode b
𝑇𝑁𝐿𝑛𝑙𝑏
Transferring cost per unit of final product from refurbishing center n to distribution center l using transportation mode b
𝑇𝑂𝐽𝑜𝑗𝑏
Transferring cost per unit of raw material from recycling center o to factory j using transportation mode b
𝑇𝑂𝑅𝑜𝑟𝑏
Transferring cost per unit of raw material from factory j to second customer zone r using transportation mode b
𝐷𝑅𝑟 Demand of second customer zone r
𝐷𝐸𝑘 Demand of customer zone k
𝜁𝑘
Percent of returned End-Of-Life products at customer zone k
𝛼1
Percent of returned products to each collection center that should be disposed
𝛼2
Percent of returned products to each collection center that should be recycled
𝛼3 Percent of returned products to each collection center that should be refurbished
𝐶𝑎𝑝𝑗𝑗𝑧 Maximum production capacity of factory j established with capacity level z
𝐶𝑎𝑝𝑙𝑙𝑡 Maximum storage capacity of distribution center l established with capacity level t
𝐶𝑎𝑝𝑜𝑜𝑞 Maximum product recycling capacity of recycling center o established with capacity level q
𝐶𝑎𝑝𝑖𝑖 Maximum capacity of supplier i for providing raw material for factories
𝐶𝑎𝑝𝑚𝑚 Maximum collection center m product processing capacity of
𝐶𝑎𝑝𝑛𝑛 Maximum refurbishing center n product recovery capacity of
𝐶𝑎𝑝𝑝𝑝 Maximum product safe disposal capacity of disposal center p
𝐷𝐼𝑆𝑗𝑠 Percentage of disrupted capacity of plant j at scenario s
𝐴𝑠 Probability of scenario s
𝑅𝐼𝐽𝑖𝑗𝑏
Reliability ratio of using transportation mode b for transferring each unit of raw material form supplier i to factory j
𝑅𝐽𝐿𝑗𝑙𝑏
Reliability ratio of using transportation mode b for transferring each unit of final product form factory j to distribution center l
𝑅𝐿𝐾𝑙𝑘𝑏
Reliability ratio of using transportation mode b for transferring each unit of final product form distribution center l to customer zone l
𝑅𝐾𝑀𝑘𝑚𝑏
Reliability ratio of using transportation mode b for transferring each unit of final returned product form customer zone k to collection center m
𝑅𝑀𝑃𝑚𝑝𝑏
Reliability ratio of using transportation mode b for transferring each unit of final returned product form collection center m to disposal center p
𝑅𝑀𝑁𝑚𝑛𝑏
Reliability ratio of using transportation mode b for transferring each unit of final returned product form collection center m to refurbishing center n
𝑅𝑁𝐿𝑛𝑙𝑏
Reliability ratio of using transportation mode b for transferring each unit of recovered final product form refurbishing center n to distribution center l
𝑅𝑀𝑂𝑚𝑜𝑏
Reliability ratio of using transportation mode b for transferring each unit of final returned product form collection center m to recycling center o
𝑅𝑂𝐽𝑜𝑗𝑏
Reliability ratio of using transportation mode b for transferring each unit of recycled raw material form recycling center o to factory j
𝑅𝑂𝑅𝑜𝑟𝑏
Reliability ratio of using transportation mode b for transferring each unit of recycled raw material form recycling center o to second customer zone r Decision variables:
𝑋𝐽𝑗𝑧 1: If a factory is established at potential location j with capacity level z; 0: otherwise
𝑋𝐿𝑙𝑡
1: If a distribution center is established at potential location l with capacity level t; 0: otherwise
𝑋𝑂𝑜𝑞 1: If a recycling center is established at potential location o with capacity level q; 0: otherwise
𝑉𝐼𝐽𝑖𝑗𝑏𝑠
Number of transferred raw material from supplier i to factory j using transportation mode b at scenario s
𝑉𝐽𝐿𝑗𝑙𝑏𝑠
Number of transferred final products from factory j to distribution center l using transportation mode b at scenario s
𝑉𝐿𝐾𝑙𝑘𝑏𝑠
Number of transferred final products from distribution center l to customer zone k using transportation mode b at scenario s
𝑉𝐾𝑀𝑘𝑚𝑏𝑠
Number of transferred final returned products from customer zone k to collection center m using transportation mode b at scenario s
𝑉𝑀𝑁𝑚𝑛𝑏𝑠
Number of transferred final returned products collection center m to refurbishing center n using transportation mode b at scenario s
𝑉𝑀𝑂𝑚𝑜𝑏𝑠
𝑉𝑀𝑃𝑚𝑝𝑏𝑠
Number of transferred final returned products from collection center m to disposal center p using transportation mode b at scenario s
𝑉𝑁𝐿𝑛𝑙𝑏𝑠
Number of transferred final recovered products from refurbishing center n to distribution center l using transportation mode b at scenario s
𝑉𝑂𝐽𝑜𝑗𝑏𝑠
Number of transferred final recycled raw material from recycling center o to factory j using transportation mode b at scenario s
𝑉𝑂𝑅𝑜𝑟𝑏𝑠
Number of transferred final recycled raw material from recycling center o to second customer zone r using transportation mode b at scenario s
Described closed loop supply chain regarding problem definition and nomenclatures is formulated as follows:
1 jz jz lt lt oq oq
j z l t o q
Min Z
FJ XJ
FL XL
FO XO
[
s i ijb ijbs p mpbs
s i j b m p b
A CI TIJ VIJ CP VMP
j jlb
jlbs
l lkb
lkbsj l b l k b
CJ TJL VJL CL TLK VLK
kmb kmbst m mnb mnbs
k m b m n b
TKM VKM CMN TMN VMN
m mpb
mpbs m p bCMP TMP VMP
n nlb
nlbs
o ojb
ojbsn l b o j b
CNL TNL VNL COJ TOJ VOJ
o orb
orbso r b
COR TOR VOR
m mob
mobs]m o b
CMO TMO VMO
(1)
2 s[ ijb ijbs jlb jlbs
s i j b j l b
Max Z
A RIJ VIJ
RJL VJLlkb lkbs kmb kmbs
l k b k m b
RLK VLK RKM VKM
mpb mpbs mnb mnbs
m p b m n b
RMP VMP RMN VMN
nlb nlbs mob mobs
n l b m o b
RNL VNL RMO VMO
]
ojb ojbs orb orbs
o j b o r b
ROJ VOJ ROR VOR
(2)
. . lkbs k , l b
VLK DE k s
s t (3)
,
orbs r
o b
VOR DR r s
(4),
kmbs k k
m b
VKM DE k s
(5),
ojbs ijbs jlbs
o b i b l b
VOJ VIJ VJL j s
(6),
jlbs nlbs lkbs
j b n b k
VJL VNL VLK l s
(7)1 kmbs mpbs ,
k b p b
VKM VMP m s
(8)2 kmbs mobs ,
k b p b
VKM VMO m s
(9)3 kmbs mnbs ,
k b n b
VKM VMN m s
(10),
mnbs nlbs
m b l b
VMN VNL n s
(11),
mobs ojbs orbs
m b j b r b
VMO VOJ VOR o s
(12)
1
jlbs jz js jz
l b z
VJL Capj DIS XJ
(13),
lkbs lt lt
k b t
VLK Capl XL l s
(14),
mobs oq oq
m b q
VMO Capo XO o s
(15),
ijbs i
j b
VIJ Capi i s
(16),
kmbs m
k b
VKM Capm m s
(17),
mnbs n
m b
VMN Capn n s
(18),
mpbs p
m b
VMP Capp p s
(19)1 jz
z
XJ j
(20)1 lt
t
XL l
(21)1 oq
t
XO o
(22)
, , 0,1 , , , , ,
jz lt oq
XJ XL XO j z l t o q (23)
, , , , , ,
ijbs jlbs lkbs kmbs mpbs mobs
VIJ VJL VLK VKM VMP VMO
, , , 0
mnbs nlbs ojbs orbs
VMN VNL VOJ VOR
, , , , , , , , , ,
i j b s l k m p o n r
(24)
different customer zones via collection centers. Constraints (6)-(12) guarantees flow balance at different echelons of supply chain regarding factories, distribution, collection, refurbishing and recycling centers, respectively. Notably, a predetermined percent of returned products would be sent to refurbishing, recycling and disposal centers that total amount of recycled, refurbished and disposed products would be equal to collected products from customer zones (i.e., 𝛼1+ 𝛼2+ 𝛼3= 1). Constraints (13)-(19) prohibit capacity violation related to factories, distribution, recycling, suppliers, collection, and disposal centers, respectively. At each predefined scenario, a percent or whole capacity of production factories could be disrupted. Constraints (20)-(22) assures that at most one capacity level could be opened for production factories, distribution and recycling centers, respectively. Constraints (23) and (24) present binary and positive decision variables, respectively.
3. EXTENDED REALISTIC ROBUST PROGRAMMING MODEL
Robust programming models seek to achieve risk-averse outcome decisions [20]. There some types of robust programming methods called hard case, semi worst-case and realistic robust programming [18, 21]. Hard worst case robust programming methods immune output decisions against all kinds of uncertainties including uncertainty of parameters in objective function and constraints. In other words, all uncertain parameters would be regarded with their worst possible value in extended model [22, 23]. Semi worst-case robust programming approach optimizes objective function based on worst value of uncertain parameters [24-26]. However, uncertain parameters of constraints have flexibility and their satisfaction level should be determined based on opinion of field experts [27-29]. Realistic robust programming methods are capable adjusting level of conservatism in objective function and constraints. Hard worst-case and semi worst-case robust programming methods are specific cases of realistic robust programming method that level of conservatism in objective function and constraints are set on their highest level. Regarding enumerated matters, extending a hybrid robust realistic programming method could be helpful because it could be converted into other
robust programming methods by some minor
justifications. To model uncertain parameters following compact model (25) is presented.
𝑀𝑖𝑛 𝑧 = 𝑐𝑥 + 𝑓𝑦, 𝒔. 𝒕. 𝐴𝑥 ≥ 𝑑 𝐵𝑥 = 𝑙 𝐸𝑥 ≤ ℎ
𝑥 ≥ 0 𝑦 ∈ {0,1}
(25)
Parameters c and f are uncertain parameters of objective function representing processing and fixed opening costs of facilities, respectively. Parameters d, l and h are uncertain parameters of constraints that correspond to demand, quantity of returned products and capacity of facilities, respectively. Parameters A, B and E are certain variable coefficients. Variables x and y are representative of positive flow variables and binary facility opening variables, respectively.
To extend realistic robust programming model by applying robust programming method proposed by Pishvaee et al. [30] and Ben-Tal and Nemirovski [31] it is assumed that value of all uncertain parameters could be fluctuated in a predefined interval called as uncertainty box. As an example, uncertainty box of parameter 𝜗 could be defined as follows.
|𝜗 − 𝜗̅| ≤ αθ (26)
where parameter 𝜗̅ is representative of nominal value of uncertain parameter (i.e., 𝜗). Parameter 𝜃 is representative of possible violation of uncertain parameter 𝜗 from its nominal value called uncertainty scale. Parameter α called as uncertainty level controls level of conservatism or risk-averseness of outcome decisions (i.e., 𝛼 ≥ 0). Increasing value of uncertainty level results in risk-averse performance of model and lowering it to its minimum value would increase level of optimistic decision making. In proposed model, worst case would happen whenever deviations of uncertain parameter 𝜗 from its nominal value is equal to 𝛼𝜃. Notably, uncertainty scale constrains maximum value of violation of uncertain parameters. Also, uncertainty level enables decision makers to control level of risk-aversion of output decisions based on their preference. Regarding introduced uncertainty box and by aid of robust programming method proposed by Pishvaee et al. [30], robust realistic model could be presented as follows.
𝑀𝑖𝑛 𝑧
𝒔. 𝒕. (𝑐𝑥 + 𝜃) + (𝑓𝑦 + 𝜌) ≤ 𝑧 ∆𝛾𝑥 ≤ 𝜃
∆𝛾𝑥 ≥ −𝜃 𝜔𝜕𝑦 ≤ 𝜌 𝜔𝜕𝑦 ≥ −𝜌 𝐴𝑥 ≥ 𝑑 + 𝜋𝜖 𝐵𝑥 ≥ 𝑙 − 𝜑𝜎 𝐵𝑥 ≤ 𝑙 + 𝜑𝜎 𝐸𝑥 ≤ ℎ − 𝛿𝛽
𝑥, 𝜃, 𝜌 ≥ 0 𝑦 ∈ {0,1}
(27)
4. IMPLEMENTATION AND EVALUATION
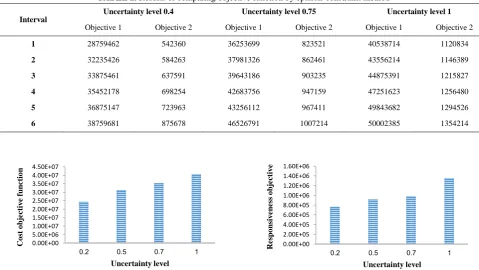
To evaluate the accuracy of extended bi-objective robust model, a test problem is randomly generated. The aim of generating one test problem is testing and analyzing accurate and effective performance of the extended model. Intervals employed for generating nominal value of model parameters are presented in Table 1. By considering these points, accurate performance of multi-objective robust model is analyzed via applying epsilon-constraint method. In this approach, each objective would be regarded as the main objective and model would be solved to find optimal value of each objective function considering all constraints. Then, optimal decision variables achieved by solving cost minimization objective would be put in responsiveness objective to find its worst value. Interval between best and worst value of responsiveness objective would be divided into some parts and objective would be added to constraints as epsilon-constraint. The right hand side of constraint would be changed between best and worst values. Increasing responsiveness would result in cost enhancement and vice versa. If noted matter appeared, it means that objectives are conflicting. The results of applying epsilon-constraint method are presented in Table 2.
As it is obviously understood from results presented in Table 2, objective functions are performing in conflicting manner.
Increasing responsiveness objective has led to cost maximization.
Increasing responsiveness level in epsilon-constraint has led to opening of more facilities and network decentralization. Network decentralization helps to using faster transportation modes aside with increasing total network costs. Noted matters approves correct performance of proposed robust realistic stochastic programming model.
To show risk-averse performance of extended reliable stochastic programming model, it is solved under nominal data regarding different uncertainty levels (i.e. 0.2, 0.5, 0.7, 1). Model is solved regarding cost minimization and responsiveness maximization objectives as main objective and results corresponding to each objective function is rendered in Figures 2 and 3, respectively.
TABLE 1. Data generation interval of uncertain parameters
Parameter Random parameter generation interval
𝐷𝐸𝑘 ~𝑈𝑛𝑖𝑓𝑜𝑟𝑚(400,700)
𝐷𝑅𝑟 ~𝑈𝑛𝑖𝑓𝑜𝑟𝑚(100,250)
𝐹𝐽𝑗𝑧 ~𝑈𝑛𝑖𝑓𝑜𝑟𝑚(2000000,5000000)
𝐹𝐿𝑙𝑡 ~𝑈𝑛𝑖𝑓𝑜𝑟𝑚(250000,400000)
𝐹𝑂𝑜𝑞 ~𝑈𝑛𝑖𝑓𝑜𝑟𝑚(1500000,2300000)
TABLE 2. Results of comparing objective function by epsilon-constraint method
Interval
Uncertainty level 0.4 Uncertainty level 0.75 Uncertainty level 1
Objective 1 Objective 2 Objective 1 Objective 2 Objective 1 Objective 2
1 28759462 542360 36253699 823521 40538714 1120834
2 32235426 584263 37981326 862461 43556214 1146389
3 33875461 637591 39643186 903235 44875391 1215827
4 35452178 698254 42683756 947159 47251623 1256480
5 36875147 723963 43256112 967411 49843682 1294526
6 38759681 875678 46526791 1007214 50002385 1354214
Figure 2. Graphical representation of cost objective function under different uncertainty levels
Figure 3. Graphical representation of responsiveness objective function under different uncertainty levels
0.00E+00 5.00E+06 1.00E+07 1.50E+07 2.00E+07 2.50E+07 3.00E+07 3.50E+07 4.00E+07 4.50E+07
0.2 0.5 0.7 1
C
o
st
o
b
je
ct
iv
e
fu
n
ct
io
n
Uncertainty level
0.00E+00 2.00E+05 4.00E+05 6.00E+05 8.00E+05 1.00E+06 1.20E+06 1.40E+06 1.60E+06
0.2 0.5 0.7 1
R
esp
o
n
si
v
en
ess
o
b
je
ct
iv
e
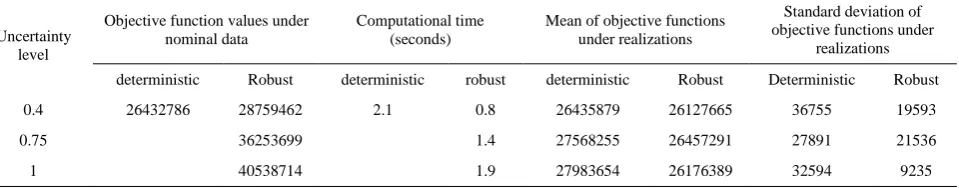
To compare the robust and deterministic models and showing better performance of robust model against deterministic one, they are solved in this section. The deterministic model is solved under nominal data and robust model is solved based on uncertainty levels 0.4, 0.75 and 1. Then, each uncertain parameter is realized based on extreme points of uncertain parameters. Extreme point of uncertain parameters are their lower and upper bound regarding nominal value of parameter. Realization of uncertain parameters includes generating uniform random numbers between extreme points of each
uncertain parameter (i.e., ~[nominal valu −
αθ, nominal valu + αθ]). Then, random generated value
of parameters are put in the deterministic model and optimal output decision variables of each solved model would be put in deterministic model. Notable point is that some of constraints would be violated and some auxiliary variables are defined for constraints including uncertain parameters. A predefined penalty would be regarded for each unit of constraint violation in objective function. Then, each model would be solved under five realizations. The results of deterministic model that include violations would be compared based on mean and standard deviation. The model with lower mean and standard deviation would be better preforming one in comparison to other model. As robustness of cost objective is important for most of the companies, robustness of responsiveness objective function is disregarded in this section. The result of realizations and solving models are presented in Table 3.
As it could be seen in Table 3, robust stochastic programming model performs better than deterministic model based on both measures (i.e. mean value and standard deviation). Increasing uncertainty level has led to better performance of robust model owing to its fully risk-averse adjustment. In other words, when model works in fully risk-averse manner, there is no chance of constraint violation and accordingly total violation penalties would be equal to zero. Therefore, mean and standard deviation of fully risk-averse robust model would be significantly better than deterministic model. It should be noted that extended model could be regarded as a reliable decision making tool because its outputs show that it outperforms deterministic model regarding mean and standard deviation measures.
The other important point is that prominence of robust stochastic model against deterministic model is its capability of adjusting uncertainty level of uncertain parameters. In other words, enhancement of uncertainty level would result in opening more facilities owing to enhancement of products flow in network. Notably, increasing risk-aversion level of output decisions would result in increasing demand of customer zones. In this regard, number of opened facilities should be more regarding higher uncertainty levels. Output results approve two important points. Firstly, increasing uncertainty levels has led to opening more facilities owing to risk-averse performance of model. Also, opened plants are less sensitive to disruptions owing to their low capacity disruption or less transportation cost enhancement. Alluded matters approve accurate performance of suggested model regarding choice of opening facilities and risk-averse performance of model via increasing uncertainty level of uncertain parameters.
Based on these points, it could be concluded that the proposed model works properly and could be applied in real world cases. Notably, extended model has capability to control risk-aversion of outcome results that makes it an applicable decision making tool for company managers.
5. CONCLUSION
Nowadays, customer satisfaction and high service level is a great competitive advantage for supply chains. In this regard, company managers tend to integrate planning of whole network echelons. However, there are some kinds of uncertainties that could destroy long term plan of networks and face companies with high level of risk and losses. In this paper, we have proposed a general bi-objective closed loop supply chain network that concurrently controls uncertainty of parameters and mitigates adverse effects of disruptions. To control uncertainty of parameters and adjust risk-aversion level of proposed model, a hybrid robust stochastic programming method is extended. Also, reliability of model against disruption occurrence is controlled via scenario-based programming. The extended model is capable of modelling partial and complete facilities’ capacity disruptions unlike available researches in this field.
TABLE 3. Comparison of robust and deterministic models
Uncertainty level
Objective function values under nominal data
Computational time (seconds)
Mean of objective functions under realizations
Standard deviation of objective functions under
realizations
deterministic Robust deterministic robust deterministic Robust Deterministic Robust
0.4 26432786 28759462 2.1 0.8 26435879 26127665 36755 19593
0.75 36253699 1.4 27568255 26457291 27891 21536
It is worth mentioning that our results show accurate performance of the model and its applicability in real world problems. Notably, application of such robust stochastic programming models could be suggested to company decision makers as an important and reliable decision making tool that helps them to make trustworthy decisions. Also, the results approve better performance of extended model in comparison to deterministic model that could be regarded as an important competitive advantage.
As future research guideline, it could be noted that other objectives such as quality maximization and environmental concerns could be modelled. Also, regarding global trade parameters in such models could near output results to real world problems and increases reliability of output decisions. Finally, it should be mentioned that the structure of extended model is general and it could be applied to agricultural supply chains such as mushroom production and recycling.
6. REFERENCES
1. Kannan, G., Sasikumar, P. and Devika, K., "A genetic algorithm approach for solving a closed loop supply chain model: A case of battery recycling", Applied Mathematical Modelling, Vol. 34, No. 3, (2010), 655-670.
2. Ozceylan, E. and Paksoy, T., "A mixed integer programming model for a closed-loop supply-chain network", International Journal of Production Research, Vol. 51, No. 3, (2013), 718-734.
3. Pishvaee, M.S. and Torabi, S.A., "A possibilistic programming approach for closed-loop supply chain network design under uncertainty", Fuzzy Sets and Systems, Vol. 161, No. 20, (2010), 2668-2683.
4. Vahdani, B., Tavakkoli-Moghaddam, R. and Jolai, F., "Reliable design of a logistics network under uncertainty: A fuzzy possibilistic-queuing model", Applied Mathematical Modelling, Vol. 37, No. 5, (2013), 3254-3268.
5. Torabi, S., Namdar, J., Hatefi, S. and Jolai, F., "An enhanced possibilistic programming approach for reliable closed-loop supply chain network design", International Journal of Production Research, Vol. 54, No. 5, (2016), 1358-1387. 6. Snyder, L.V. and Daskin, M.S., "Reliability models for facility
location: The expected failure cost case", Transportation Science, Vol. 39, No. 3, (2005), 400-416.
7. Peng, P., Snyder, L.V., Lim, A. and Liu, Z., "Reliable logistics networks design with facility disruptions", Transportation Research Part B: Methodological, Vol. 45, No. 8, (2011), 1190-1211.
8. Vahdani, B., Tavakkoli-Moghaddam, R., Modarres, M. and Baboli, A., "Reliable design of a forward/reverse logistics network under uncertainty: A robust-m/m/c queuing model", Transportation Research Part E: Logistics and Transportation Review, Vol. 48, No. 6, (2012), 1152-1168.
9. Hatefi, S., Jolai, F., Torabi, S. and Tavakkoli-Moghaddam, R., "Reliable design of an integrated forward-revere logistics network under uncertainty and facility disruptions: A fuzzy possibilistic programing model", KSCE Journal of Civil Engineering, Vol. 19, No. 4, (2015), 1117-1128.
10. Fereiduni, M. and Hamzehee, M., "A p-robust model in humanitarian logistics in a non-neutral political environment",
Uncertain Supply Chain Management, Vol. 4, No. 4, (2016), 249-262.
11. Drezner, Z., "Heuristic solution methods for two location problems with unreliable facilities", Journal of the Operational Research Society, (1987), 509-514.
12. Lim, M., Daskin, M.S., Bassamboo, A. and Chopra, S., "A facility reliability problem: Formulation, properties, and algorithm", Naval Research Logistics (NRL), Vol. 57, No. 1, (2010), 58-70.
13. Wang, J. and Shu, Y.-F., "A possibilistic decision model for new product supply chain design", European Journal of Operational Research, Vol. 177, No. 2, (2007), 1044-1061. 14. Qin, X.-S., Huang, G.H., Zeng, G.-M., Chakma, A. and Huang,
Y., "An interval-parameter fuzzy nonlinear optimization model for stream water quality management under uncertainty", European Journal of Operational Research, Vol. 180, No. 3, (2007), 1331-1357.
15. Fatrias, D. and Shimizu, Y., "Possibilistic programming model for fuzzy multi-objective periodic review inventory in two-stage supply chain", International Journal of Applied Decision Sciences, Vol. 7, No. 2, (2014), 168-189.
16. Vahdani, B., Tavakkoli-Moghaddam, R., Jolai, F. and Baboli, A., "Reliable design of a closed loop supply chain network under uncertainty: An interval fuzzy possibilistic chance-constrained model", Engineering Optimization, Vol. 45, No. 6, (2013), 745-765.
17. Hatefi, S.M., Jolai, F., Torabi, S.A. and Tavakkoli-Moghaddam, R., "A credibility-constrained programming for reliable forward–reverse logistics network design under uncertainty and facility disruptions", International Journal of Computer Integrated Manufacturing, Vol. 28, No. 6, (2015), 664-678. 18. Lee, D.-H., Dong, M. and Bian, W., "The design of sustainable
logistics network under uncertainty", International Journal of Production Economics, Vol. 128, No. 1, (2010), 159-166. 19. Pishvaee, M.S., Razmi, J. and Torabi, S.A., "Robust possibilistic
programming for socially responsible supply chain network design: A new approach", Fuzzy Sets and Systems, Vol. 206, (2012), 1-20.
20. Erol, I., Sencer, S. and Sari, R., "A new fuzzy multi-criteria framework for measuring sustainability performance of a supply chain", Ecological Economics, Vol. 70, No. 6, (2011), 1088-1100.
21. Kamali, H., Sadegheih, A., Vahdat-Zad, M. and Khademi-Zare, H., "Deterministic and metaheuristic solutions for closed-loop supply chains with continuous price decrease", International Journal of Engineering-Transactions C: Aspects, Vol. 27, No. 12, (2014), 1897-1904.
22. Pishvaee, M.S. and Khalaf, M.F., "Novel robust fuzzy mathematical programming methods", Applied Mathematical Modelling, Vol. 40, No. 1, (2016), 407-418.
23. Soyster, A.L., "Convex programming with set-inclusive constraints and applications to inexact linear programming", Operations Research, Vol. 21, No. 5, (1973), 1154-1157. 24. Ben-Tal, A. and Nemirovski, A., "Robust convex optimization",
Mathematics of Operations Research, Vol. 23, No. 4, (1998), 769-805.
25. El Ghaoui, L., Oustry, F. and Lebret, H., "Robust solutions to uncertain semidefinite programs", SIAM Journal on Optimization, Vol. 9, No. 1, (1998), 33-52.
26. Inuiguchi, M. and Sakawa, M., "Robust optimization under softness in a fuzzy linear programming problem", International Journal of Approximate Reasoning, Vol. 18, No. 1-2, (1998), 21-34.
28. Leung, S.C., Tsang, S.O., Ng, W.L. and Wu, Y., "A robust optimization model for multi-site production planning problem in an uncertain environment", European Journal of Operational Research, Vol. 181, No. 1, (2007), 224-238. 29. Pan , F. and Nagi, R., "Robust supply chain design under
uncertain demand in agile manufacturing", Computers & Operations Research, Vol. 37, No. 4, (2010), 668-683.
30. Pishvaee, M.S., Rabbani, M. and Torabi, S.A., "A robust optimization approach to closed-loop supply chain network design under uncertainty", Applied Mathematical Modelling, Vol. 35, No. 2, (2011), 637-649.
31. Ben-Tal, A. and Nemirovski, A., "Robust solutions of uncertain linear programs", Operations Research Letters, Vol. 25, No. 1, (1999), 1-13.
A Robust Reliable Forward-reverse Supply Chain Network Design Model under
Parameter and Disruption Uncertainties
M. Fazli-Khalafa, A. Hamidiehb
a Department of Industrial Engineering, Faculty of Engineering, Kharazmi University, Tehran, Iran
b Industrial Engineering group, Department of Engineering, Faculty member of Payamnoor University, Tehran, Iran
P A P E R I N F O
Paper history: Received 09 August 2016
Received in revised form 29 April 2017 Accepted 07 July 2017
Keywords: Supply Chain Reliability Social Responsibility Robustness Stochastic Programming ديكچ ه لوئسم ی ت عامتجا ی ی ک لک روتکاف ی د ی تسا تسد هب رجنم هک ی با ی هب قفوم ی ت و دوس ز ی دا ارب ی جنز ی هر اه ی مات ی ن م ی ددرگ . خساپ وگ یی و اپ یا یی ، هجنس اه ی مهم لوئسم ی ت عامتجا ی ارب ی مامت ی ماهس ناراد و رتشم ی نا م ی دنشاب هک ژتارتسا ی تس اه و دم ی نار اهنامزاس اب ی د رد دروم نآ اه رد همانرب ر ی ز ی دنلب تدم نارگن دنشاب . ،هچرگ دوجو مدع عطق ی ت اه هب ناونع ی ک ی زا ازجا ی ذپانادج ی ر جنز ی هر اه ی مات ی ن م ی دناوت هب تروص ،سوکعم رتهب ی ن همانرب اه ی ظنت ی م هدش طسوت هربخ اه ی ثات تحت ار هزوح ی
ر
عطق مدع ،دش هتفگ هچنآ قبط رب .دهد رارق ی
ت عطق مدع و اهرتماراپ ی
ت ا ی داج اب تلالاتخا طسوت هدش ی د رد ارف ی دن همانرب ر ی ز ی هکبش اه رظندم رارق گ ی در ات زا اتن ی ج فنم ی غ ی لباقر پ ی ش بی ن ی طوبرم هب مدع عطق ی ت اه ی رکذ ،هدش ارب ی مامت ی حوطس جنز ی هر -اه ی مات ی ن گولج ی ر ی ددرگ . رب ساسا دراوم رکذ ،هدش فده ا ی ن ،هلاقم حارط ی ی ک لدم هکبش جنز ی هر مات ی ن هقلح هتسب اپ یا ی دنچ حطس ی م ی دشاب هک لوئسم ی ت عامتجا ی ار رد رانک مک ی هن زاس ی زه ی هن اه ی تباث ثادحا و غتم ی ر لمع ی تا ی حارط ی ،هکبش بی ش ی هن م ی امن ی د . ارب ی ههجاوم اب مدع عطق ی ت ،اهرتماراپ همانرب ر ی ز ی لامتحا ی هب راک هتفرگ هدش تسا و زا ی ک ور ی درک اراک ی لدم زاس ی اپ یا هدافتسا هدش تسا ات ناوتب هب روط بسانم تارثا بولطمان تلالاتخا ار لرتنک دومن . مزلا هب رکذ تسا هک زا ی ک ور ی درک اراک ی همانرب ر ی ز ی لباق ناوتب ات تسا هدش هدافتسا راوتسا ی