A b s t r a c t. In the present study a machine vision system was developed for estimating the mass of eggs arranged in a single array. A grabber frame equipped with a mirror was developed for positioning the eggs. Therefore, two images could be captured from each egg. Images were then processed by Matlab software. Six algorithms were developed to extract eggs features such as minimum, maximum and effective radii, perimeter and the frontal area from each image. The eggs were also weighed by a sensitive digital scale. Seventy percent of data after discarding the outliers were used to establish some models, and the remaining was used to verify the final model. The results showed that egg mass estimation can be accurate by using two perpendicular views of each egg. Amongst the models, one with predictors of area and effective ra-dius was found to be the best. A high correlation coefficient was observed between eggs mass measured and predicted by the model, with an accuracy of about 95%.
K e y w o r d s: egg, fresh mass, machine vision INTRODUCTION
Today, egg is extremely distributed in international trade, and the egg industry is a vital portion of the world food industry. In the egg trade, this product is sold by its mass. Also, many investigations have shown that egg mass can be considered as an important parameter for prediction of features of egg shell, hatchability, and chick mass (Narushin et al., 2002). Poultry products, just as other food products, have several unique characteristics which set them apart from engineering materials. These properties determine the quality of the products, and identification of correlation among those properties makes quality control easier (Jannatizadeh et al., 2008). Egg mass measurement is an essential unit operation for controlling the egg production process in the poultry industry. Information regarding egg
mass is not only vital for grading systems based merely on mass, but it is also necessary for assessing quality indices such as yolk-albumen ratio, shell thickness and hatchability. Physically, weighing the individual items is very expen-sive and impractical. To overcome this problem, correlated mass with size is often used as a substitution for weighing each item of produce. For this purpose, machine vision is a desirable implement and can been used for size estimation. Machine vision is a non-destructive method that involves image analyses and image processing operations. Many re-searchers have used this method for size grading of agricul-tural products. Brosnan and Sun (2002), Esehaghbeygiet al. (2010), Guyer and Yang (2000), Khojastehnazhand et al. (2009) and have all found the image processing approach fast and reliable for automatic fruit sorting, defect detection and product grading.
Wang and Nguang (2007) designed a low-cost sensor for measuring the volume and surface area of agricultural products. They considered each product as a set of elemen-tary cylindrical objects of unit pixel height, and estimated the volume by summing the elementary volumes of each cylinder. Many other imaging algorithms were developed to measure the volume of products such as carrots, lemons, water-melon, peaches and tangerine (Bulent Koc, 2007; Eifertet al., 2006; Sabilovet al., 2002). Many researches have been conducted to estimate mass of various types of agricultural products by physical properties. Tabatabaeefaret al. (2000) in a study found 11 models for the prediction of orange mass based upon dimensions, volume and surface areas. In another study, Tabatabaeefar (2002) suggested a high correlation between mass and volume of common varieties of Iranian grown potatoes. Lorestani and Tabatabaeefar (2006) used the regression analysis to develop equations for predicting Int. Agrophys., 2012, 26, 229-234
doi: 10.2478/v10247-012-0034-6
Fresh egg mass estimation using machine vision technique
V. Asadi
1*, M. H. Raoufat
2, and S. M. Nassiri
21
Department of Mechanical Engineering, Majlesi Branch, Islamic Azad University, Isfahan, Iran 2
Department of Agricultural Engineering, Shiraz University, Shiraz, Iran Received September 4, 2011; accepted January 30, 2012
© 2012 Institute of Agrophysics, Polish Academy of Sciences
*Corresponding author’s e-mail: [email protected]
A
A
mass of kiwi based on physical attributes. They suggested that there is a very good relationship between mass and mea-sured volume for all varieties of kiwi. Khanaliet al. (2007) studied the physical properties of tangerine and found the best model of predicting fruit mass with R2=0.96. Khoshnam et al. (2007) used different regression models for predicting the mass of pomegranate fruit with some physical charac-teristics. The best model was suggested based on minor diameter by a nonlinear relation. Mirzaeeet al. (2008) pre-dicted the mass of tow apricot varieties through models that were based upon apricot physical properties.
Machine vision has been recently used in the poultry industry. Patelet al. (1998) combined a colour computer vision and neural network system for detecting eggs with a defect. The system was capable of dirt stain detection with 97.8% accuracy, 91.1% accuracy for blood spot, and 96.7% accuracy for crack detection. Ancel and Beaulieu (2009) have developed an equation for the estimation of fresh mass of penguin egg by its length and width.
This paper describes a machine vision system that has been used to extract size features of eggs. The outputs of this system have been then used for predicting the mass of eggs by multiple regression analysis.
MATERIALS AND METHODS
Eggs with different sizes and weights, from White Leg-horn Line hens, were selected for this study. The eggs were weighed using an electronic balance with 0.001 g accuracy (A and D, GF-600 Precision Scale, Japan). The machine vision system consisted of a frame grabber, an illumination system, a mirror and a colour CCD camera with 1200×1600 pixel resolution (Canon IXUS 960IS) was used for provid-ing eggs images. Egg samples were put in the grabber. By using a flat mirror which was installed at 45°to the camera,
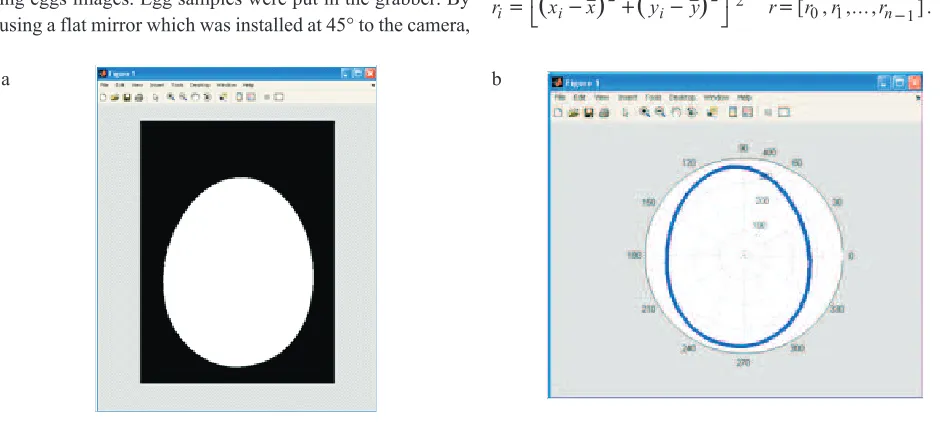
two perpendicular views of egg were observed. Some exter-nal feature information was extracted from captured frames to describe the images. Morphological features describe the shape of an object. Area, perimeter, major and minor axes lengths are some of the most commonly measured morpho-logical features. Segmentation is the first step to extract morphological features from an image, and consists in the division of the image into its constituent objects. With ap-plying a threshold value, each image was divided into two parts, and thereby the background was separated from the object. The resulting image after this process was a binary image (Fig. 1). Binary images were then labelled. All objects inside the image were counted. If their number was more than two, a morphological opening operator was used with a disk-shaped structuring element from Matlab (version 7.5.0.342, R2007b, the Mathworks Inc.) image processing toolbox to remove all of them. Finally, two items remained in a processed binary image, a white main object, and a black background. After segmentation, an edge algorithm was developed for detecting the corresponding edge pixel for each of two perpendicular views of an egg. Twelve physical features such as image area, maximum radius, minimum radius, effective radius, perimeter and roundness for both views were extracted. At first the centroid of both eggs views was calculated by using the Eq. (1):
x xj
j y
yj j
=å
å =
å
å , (1)
Where x y, – are horizontal and vertical coordinates of centre of gravity, respectively, and x, y are accordingly horizontal and vertical coordinates of each edge pixel. By using the Eq. (2), many radii can be calculated:
(
)
(
)
ri=ëé xi-x + yi-y ùû r= r r rn
-2 2
1 2
0 1 1
[ , ,... , ] . (2)
Fig. 1.Binary image: a – image from front view of an egg after segmentation, b – edge detection from extract features.
The maximum of these values is calledRmax, and the minimum one is calledRmin. The effective radius (Reffect) was calculated by using the Eq. (3):
re= r r rn n -( 0 1... , 1)
1
, (3)
where:reandriare effective andith radius, respectively, and nis the number of radii. Each radius makes an angleqwith the horizontal axis. This angle can be computed by the following equation:
q= -
-æ è ç
ç öø÷÷
tg y y
x x
i
i
. (4)
The diameter of the object can be then calculated by summing the radii which make angle with 180°difference. The radii which are positioned in opposite directions make cumulative angle of 180°with the horizontal axis. The Eq. (5) is suitable for calculating the roundness of an object:
roundness Min d Max d
= ( )
( ), (
5)
where:Min(d) andMax(d) are minimum and maximum dia-meters, respectively. The area and perimeter were calculated by counting the number of pixels inside and at the boundary of the egg image, respectively. All features corresponding to the first view of egg are named with 1, such as area1, round-ness1,Rmax1,Rmin 1,Reffect1, and features corresponding to the mirror image are named with 2, such as area2, round-ness2,Rmax 2,Rmin 2, andReffect
2. The units in which the features were expressed were pixels.
For establishing a model, the impact of different exter-nal and interexter-nal features on the egg mass was checked pair-wise by Minitab software (version 15, Minitab Inc.). To find the kind of relation, namely linear or nonlinear, the scatter diagram for the pairs of mass and each of the features were drawn. The tendency and strength of illustrated relation were used to prerefine the feature with low impact. The pre-refinement procedure showed that the linear relation was prominent amongst the variables. It is represented by the following statistical relation:
$
y a a xi i i
n
i
= + åé
ë ê ù û ú+ = 0 1
e ,
(6)
where:y$is predicted value (here, egg mass),a0is regression constant (intercept),aiis regression coefficient,xiis regres-sion predictor (here obtained feature),ei is error term, and subscriptirefers toith predictor. Selected features were then entered in the model as independent variables (Nassiri and Singh, 2007). The best subset regression method was used to classify the best model. Since this method is based on maximum coefficient of determination, established models were checked for other necessary post test, such as t value of regression coefficients,Ftest for whole model,VIFamong variables, and the residual diagnosis:
t a
SE
i i
i
= , (7)
F SSR df SSE df SSR k SSE n k y y k y y n i i i = = -= -å -å -1 1 2 2 ($ ) ( $ ) k , (8) R SSR SST SSE SST 2 1
= = - , and
R SSE n k SST n y y k y y n k adj i i i . ( $ ) ( ) 2 2 2 1 1 1 1 = - = -å -å -, (9)
where:SEiis standard error of regression coefficient, i refers to the ith predictor.SSR, SSEandSSTare regression sum of squares, error sum of squares and total sum of squares, respectively. yi,y$i, yi and are measured egg mass value, corresponding predicted value, and mean of measured egg mass values, respectively. The letternis the number of data, andkis the number of variables in the model including the dependent term (Montgomery, 2006).
The VIF pinpoints multi-colinearity among the inde-pendent variables. It can be measured by the following rela-tion (Hairet al., 2006):
VIF
R j n
j
j
=
- =
1
1 2 1 2, ... , , (10)
where:jis representative of thejth independent variable. R2j is the coefficient of determination for regression which is established betweenjth variable (independent) as depen-dent and other independepen-dents variables.MallowsCpthat de-termines the issue of model overfitting, was calculated by following equation (Siniksaran, 2008):
Cp=(SSE/S2)-N+2p (11)
where: SSE is error sum squares for model with p regressor, S2is the residual mean square after regression on the com-plete set of K regressors (K>p), N is the sample size andpis number of regressors in model. This statistic is used as a cri-terion for selecting appropriate model among many alter-native subset regressions. In practice, the best model is selected from the ordered list of subsets whenCpcloses top. All data were divided into two parts, seventy percent being used for establishing the model, and the rest kept for model validation.
RESULTS AND DISCUSSION
established twice; one for direct vision data and another for those data which were considered both direct and indirect visions (combined). For prescreening of the variables which could influence the mass of the egg, scatter plots of each variable versus the mass of egg were sketched and a kind of pair-wise relations were determined.
The graphs helped to discard the roundness feature from the independent variables because of low value of coeffi-cient of determination (R2=0.086) and a flat scatter plot. Models were then established by the Minitab software. The values of the coefficient of determination for the best models are given inTable 1.
As it is clear, 87.2% of egg mass can be explained by ef-fective radius. Hence, by keeping the high value of adjusted coefficient of determination in mind and considering the low value of standard error of estimation, andCpvalue, the best models were made by frontal area, Rmin,RmaxandReffect. Then, different models which had been established by direct vision features were analyzed by considering theVIFvalues as well as the residual diagnosis (Table 2).
It is obvious that models 1 and 2 had the lowerVIFvalues, and showed that these independent variables had less impact on each other. It meant that each variable estimated the mass independently. The residual diagnostic tests for these two models are illustrated inFigs 2 and 3.
Variable(s)
in model R2 Radj2 Cp SEE
Variable
Area Rmin Rmax Reffect
1 87.2 87.0 41.9 1.98 - - - Ö
-1 64.1 63.6 226.6 3.32 - - Ö -
-2 88.9 88.5 31.0 1.87 Ö - - Ö
-2 88.0 87.7 37.5 1.93 Ö Ö - -
-3 92.7 92.3 2.4 1.52 Ö - - Ö Ö
3 92.0 91.6 7.8 1.59 Ö Ö - Ö
-4 92.7 92.2 4.0 1.53 Ö Ö Ö Ö
-4 92.7 92.2 4.3 1.54 Ö - Ö Ö Ö
5 92.7 92.1 6.0 1.54 Ö Ö Ö Ö Ö
T a b l e 1.The best subsets of independent variables without screening the outlier
Model Constantstatistics Intercept Area Rmin Rmax Reffect
Single side vision Mass = - 116 +0.009Area+0.08Rmin-0.13Rmax+
0.46Reffect(Model 1)
tvalue -19.57 9.26 3.14 -4.69 7.90
VIF - 3.4 6.1 13.8 20.4
Mass = - 97.5 + 0.007Area + 0.15Rmin+ 0.23Reffect (Model 2)
tvalue -18.7 6.8 5.9 - 6.3
VIF - 2.8 4.2 - 5.8
Mass = - 94.6 + 0.003Area + 0.42Reffect
(Model 3)
tvalue -14.4 3 - - 18.6
VIF - 1.4 - - 1.4
Double side vision Mass = - 121 +0.011Area+0.04Rmin- 0.21Rmax+
0.69Reffect (Model 1)
tvalue -28.5 11.7 1.4 -6.6 12.2
VIF - 4 4 17.8 20.3
Mass = - 123 + 0.012Area - 0.23Rmax+ 0.76Reffect(Model 2)
tvalue -30.6 11.9 - -10.9 25.9
VIF - 4 - 9.2 5.3
Mass = - 102 + 0.004Area + 0.54Reffect
(Model 3)
tvalue -20.5 3.8 - - 19.7
VIF - 2.2 - - 2.2
Distribution of the residuals was more normal for model 2 than 3. On the other hand, the deviation of residuals was in the range of ±4 for model 2, whereas it was ±5 or even more for model 3. For better judgment about the final model, 30% of data that had been kept for model validation were put in the models. This emphasised that these models had insuffi-cient information for predicting the mass because both models had underestimated the data. The same procedure was followed for combined vision data. The best subsets are summarized in Table 2. By considering the VIF values, variables in model 3 estimated the mass independently. The highest multi-colinearity among the variables was observed in model 1. According to theFig. 4,model 3 estimated the mass of eggs in better manner than model 2.
Fig. 2.Residual diagnostic test for model 2.
Fig. 3.Residual diagnostic test for model 3.
50 55 60 65 70 75 80
50 55 60 65 70 75 80
M o d e lle d m a s s (g )
Measured mass (g)
Model 2
Model 3
Mo
d
e
lle
d
ma
ss
(g
)
It can be concluded that the combined features could provide better estimation of the mass of egg than direct vi-sion. Therefore, the final model can be proposed as: Mass = - 102 + 0.004 Area + 0.54ReffecRadj2 = 0.952. (12)
A correlation coefficient of 0.984 was obtained between measured mass and corresponding one which was modelled by the above relation.
CONCLUSIONS
1. The proposed model successfully estimated the mass of an egg by some physical quantities with possibility of online measurement.
2. The two dimensional frontal area and effective radius together could explain the mass with accuracy of about 95%. 3. It was observed that double side imaging gave an acceptable estimation of the real mass of the egg. However, it can be proposed that direct dual view or even triple imaging may give more explanatory power for eggs mass estimation.
REFERENCES
Ancel A. and Beaulieu M., 2009.Practical method of estimating
fresh mass of Adélie penguin eggs. Polar Biol., 32, 1091-1093.
Brosnan T. and Sun D.W., 2002. Inspection and grading of
agricultural and food products by computer vision systems – a review. Computers Electronics Agric., 36(2-3), 193-213.
Bulent Koc A., 2007.Determination of watermelon volume using
ellipsoid approximation and image processing. Postharvest Biol. Technol., 45, 366-371.
Eifert J.D., Sanglay G.C., Lee D.J., Sumner S.S., and Pierson
M.D., 2006.Prediction of raw produce surface area from
weight measurement. J. Food Eng., 74, 552-556.
Esehaghbeygi A., Ardforoushan M., Monajemi S.A.H., and
Masoum A.A., 2010.Digital image processing for quality
ranking of saffron peach. Int. Agrophysics, 24, 115-120.
Guyer D. and Yang X., 2000.Use of genetic artificial neural
networks and spectral imaging for defect detection on cherries. Computers Electronics Agric., 29(3), 179-194.
Hair J.F., Anderson R.E., Tatham R.L., and Black W.C., 2006.
Multivariate Data Analysis. Pearson Education Inc.
Jannatizadeh A., Naderi Boldaji M., Fatahi R., Ghasemi
Varnamkhasti M., and Tabatabaeefar A., 2008.Some
post harvest physical properties of Iranian apricot fruit. Int. Agrophysics, 22, 125-131.
Khanali M., Ghasemi Varnamkhasti M., Tabatabaeefar A.,
and Mobli H., 2007.Mass and volume modelling of
tan-gerine (Citrus reticulate) fruit with some physical attributes. Int. Agrophysics, 21, 329-334.
Khojastehnazhand M., Omid M., and Tabatabaeefar A., 2009.
Determination of orange volume and surface area using image processing technique. Int. Agrophysics, 23, 237-242.
Khoshnam F., Tabatabaeefar A., Ghasemi Varnamkhasti M.,
and Borghei A., 2007. Mass modeling of pomegranate
(Punica granatumL.) fruit with some physical characte-ristics. Scientia Horticulturae, 114, 21-26.
Lorestani A.N. and Tabatabaeefar A., 2006.Modelling the mass
of kiwi fruit by geometrical attributes. Int. Agrophysics, 20, 135-139.
Mirzaee E., Rafiee S., Keyhani A.R., Emam Djom-eh Z., and
Kheiralipour K., 2008.Mass modeling of two varieties of
apricot (Prunus armenaicaL.) with some physical characte-ristics. Plant Omics J., 1(1), 37-43.
Montgomery D.C., 2006.Design and Analysis of Experiments.
Wiley India Press, New Delhi, India.
Narushin V.G., Romanov M.N., and Bogatry V.P., 2002.
Relationship between preincubation egg parameters and chick weight after hatching in layer breeds. Biosys. Eng., 83(3), 73-381.
Nassiri S.M. and Singh S., 2007. Functional relation between
energy inputs and paddy yield using multiple regression analysis (MRA). Proc. 20th Nat. Conv. Agric. Eng., PAU, January 19-20, Ludhiana, India.
Patel V.C., McClendon R.W., and Goodrum J.W., 1998.
Development and evaluation of an expert system for egg sorting. Computer Electronics Agric., 20, 97-116.
Sabilov C.M., Boldor D., Keener K.M., and Farkas B.E., 2002.
Image processing method to determine surface area and volume of axisymmetric agricultural products. Int. J. Food Properties, 5(3), 641-653.
Siniksaran E., 2008.A geometric interpretation of Mallows’ Cp
statistic and an alternative plot in variable selection. Comp. Stat. Data Anal., 52, 3459-3467.
Tabatabaeefar A., Efagh-Nematolahee A., and Rajabipour A.,
2000.Modeling of orange mass based on dimensions. Agric.
Sci. Technol., 2, 299-305.
Tabatabaeefar A., 2002. Size and shape of potato tubers. Int.
Agrophysics, 16, 301-305.
Wang T.Y. and Nguang S.K., 2007.Low cost sensor for volume