A b s t r a c t. The aim of the study was to find the effect of water regimes on soil sorptivity and humic components of organic matter. Physicochemical parameters were also determined. Steady state cumulative infiltration was the highest (60-100 mm) in non-irrigated upland soil and the lowest (8-10 mm) in waterlogged soil. The highest sorptivity of 4.0-4.5 mm min-1/2was found in non-irrigated upland soil and the lowest in seasonally waterlogged soil (1.0-1.5 mm min-1/2). Organic carbon content of all soils was low (<1%), EC values were also low (< 4 dS m-1). Saturated moisture was high in waterlogged soil. The non-irrigated upland soils had a higher fraction of fulvic acid (0.15-0.2%), due to which they were more capable of infiltration, whereas waterlogged soils had a grea-ter fraction of insoluble humic acid (0.29-0.35%) and exhibited less cumulative infiltration. Sorptivity decreased as the clay con-tent, pH, EC, porosity and humic acid content of the soil increased.
K e y w o r d s: infiltration, soil sorptivity, humic acid, fulvic acid
INTRODUCTION
The ability of a soil to absorb water during infiltration is called sorptivity. Theoretically, it has established that, in the absence of gravity effect, the amount of water absorbed du-ring infiltration is proportional to the square root of time (t), when water is allowed to infiltrate into a horizontal column of porous material the surface of which is maintained at a constant moisture contentie I = St1/2whereSis a constant and is called sorptivity,Iis cumulative infiltration. Sorptivi-ty,S=(qo-qi D t)( / )1 2, whereDis weighted mean diffu-sivity,q
iis initial soil water content,qois saturated wetness
andtis time. Sorptivity is defined only in relation to a fixed
initial stateq
iand an imposed boundary conditionqo. This is
true fort>0 (Kirkham, 2005; Rehman, 2010; Youngs, 1968).
Typical values of the steady infiltration rate for sandy and silty soils, loams and clayey soils are 10-20, 5-10, and 1-5 mm h-1, respectively (Harden and Scruggs, 2003; Yanget al., 2004). The differences in wettability of soils are caused by differen-ces in organic matter composition rather than by the amount of organic carbon (Mandal and Jayaprakash, 2009). Soils containing a large amount of hydrophobic materials, such as plant litter, residue and microbial by-products, may become water repellent or less wettable (Bisdomet al., 1993; Doerr et al., 1996). These materials are generally thought to be pre-sent as a coating on soil particles or aggregates (Bisdomet al., 1993). The accumulation of hydrophobic waxes on soil particles, such as humic acid, as soil coatings and other long-chained organic compounds on or between soil particles are all accepted as factors contributing to this negative impact phenomenon (Francoet al., 2000; Karnoket al., 1993). Wet-tability of soil is also greatly influenced by nature of decom-posed organic materials (Singh and Das, 1992). For these reasons, soils under sal (Shorea robusta) forest, chryso-pogon grass (Chrysopogon aciculatus) and cropland have less water drop penetration time and therefore are classified as wettable. However, soils under eucalyptus plantation and panicum stand, containing a higher fraction of humic acid, show considerable hydrophobicity.
Topography and rainfall are the main factors which determine whether a soil would be waterlogged or not. But information on the influence of different fractions of organic material such as humic acid, fulvic acid and humin content on soil wettability/repellence and sorptivity, resulting in waterlogging particularly for Orissa (India) soils, is meagre. Int. Agrophys., 2012, 26, 53-59
doi: 10.2478/v10247-012-0008-8
Effect of water regimes on sorptivity and organic matter humic components of soil
S. Raut*, N. Sahoo, and H.Chakraborty
Directorate of Water Management, Bhubaneswar, Orissa-751023, India
Received March 19, 2011; accepted May 19, 2011
© 2012 Institute of Agrophysics, Polish Academy of Sciences *Corresponding author’s e-mail: shi_wtcer@yahoo.com
The present investigation was carried out to study the effect of the different fractions of soil organic matter on water repellence/soil wettability and sorptivity and water-logging in relation to different water regimes.
MATERIALS AND METHODS
Soil samples were collected from three different depths (0-15, 15-30, 30-45 cm), from Raghunathpur village (20° 30’-20°33’ N; 86°30’-86°-32’ E), Jagatsinghpur district of Orissa, India, in three different seasons coming under three different moisture regimes, namely, irrigated cultivated, seasonally waterlogged and non irrigated upland. The soils were classified as Typic Haplaquepts (Fig. 1). The study area was approximately 4 km2. The seasons for soil collections were June - July, 2007 (before rice cultivation) and January - February, 2008 (after rice cultivation), and November - December, 2008 (after rice cultivation). The area is mostly mono-cropped (rice cultivation). Soil samples were collected from three different points (three replica-tions) of each moisture regime, for a total of 81 samples, and processed. The horizontal infiltration and sorptivity were studied in a plexiglass column in the laboratory. The column was prepared placing plexiglass segments (0.01 m height and 32 in number) one over another. This was filled sepa-rately, as uniformly as possible, with different soil samples at bulk density of 1.3 Mg m-3. The column was placed hori-zontally on a wooden stand and water was introduced to the inlet end from marriotte tube at a constant pressure of 0.2 kPa. Water entering the column was measured volumetrically and the distance from the water source to the wetting front was visually observed. After completion of the infiltration, the column was sectioned into 1 cm segments and water con-tent was determined gravimetrically. From these, soil water diffusivity, D(q), was calculated by using the following
formula:
D( )q =-1 2/ t dx d xd. / q q, (1)
where:xis distance, the definite integral is solved between initial wetness (qi) and final wetness (q).
The weighted mean diffusivity was calculated accord-ing to Crank formula (Baiet al., 2007):
D=1.66/ (qo-qi)5 3D( )(q qo-qi)2 3dq, (2)
where:Dis weighted mean diffusivity.
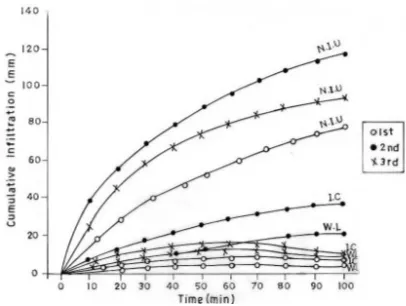
Physicochemical characteristics of soils were determi-ned by using standard procedures (Black, 1965; Jackson, 1973). Saturated water content of the soils was measured according to Rashid (2011). Cumulative infiltration was plotted as a function of time (Fig. 2). The humic acid and fulvic acid fractions of organic matter were separated according to Kononova (Swift, 2011). The relationships between sorptivity and other soil parameters, correlation between clay and organic carbon as well as clay + silt and organic carbon were also determined.
Fig. 1.The study area and sample locations.
RESULTS AND DISCUSSION
The highest steady state cumulative infiltration was observed in non-irrigated upland soil (55- 100 mm), followed by irrigated cultivated soil (10-20 mm) and seasonally water-logged soil (6-18 mm) (Fig. 2). This result can be verified from the slope of the cumulative infiltration and time curves. In 50 min time only 5-13 mm water infiltrated in the
water-logged soil. Whereas, for the same period, 40-90 mm water infiltrated in the non-irrigated upland soil. Infiltration in the irrigated cultivated soil was medium (12-23 mm). Irrigated cultivated and waterlogged soils were clay, with a clay content of 69-83% in the surface layer (Table 1).Clay con-tent in the non-irrigated upland soil varied from 21 to 35%, and the soil was sandy clay loam. Clay content did not differ much in the 15-30 and 30-45 cm soil layer for irrigated
Soil Depth
(cm)
Particle size distribution (%)
Corg.(%) pH EC
(dS m-1)
qs (vol.)
Sand Silt Clay
1st season NIU*
IC
WL 0-15
69 10 21 0.31 5.2 0.05 0.46
13 18 69 1.10 5.4 0.07 0.64
9 8 83 1.00 5.6 0.08 0.69
NIU IC
WL 15-30
51 12 37 0.33 5.6 0.06 0.49
1 22 77 1.00 5.9 0.08 0.64
1 20 79 0.96 6.0 0.09 0.69
NIU
30-45
71 8 21 0.36 5.7 0.05 0.47
IC 27 4 69 0.98 6.0 0.08 0.57
WL 21 6 73 0.95 6.5 0.09 0.63
2nd season NIU
0-15
63 2 32 0.68 5.0 0.05 0.37
IC 27 2 71 1.33 5.8 0.07 0.57
WL 21 4 75 0.95 6.0 0.08 0.60
NIU
15-30
71 8 21 0.54 6.5 0.04 0.38
IC 27 4 69 0.95 6.6 0.07 0.59
WL 29 2 69 0.96 6.7 0.07 0.61
NIU
30-45
79 2 9 0.40 5.9 0.05 0.47
IC 27 4 69 0.90 6.0 0.08 0.57
WL 21 6 73 0.90 6.7 0.11 0.59
3rd season NIU
0-15
65 15 20 0.40 5.0 0.07 0.40
IC 28 2 70 1.00 5.8 0.09 0.51
WL 10 15 75 0.95 6.2 0.11 0.55
NIU
15-30
55 12 23 0.30 6.2 0.06 0.39
IC 26 4 70 0.95 5.4 0.10 0.50
WL 5 19 76 0.98 6.5 0.12 0.52
NIU
30-45
52 14 34 0.29 6.0 0.05 0.42
IC 27 5 68 0.90 6.2 0.12 0.53
WL 6 20 74 0.95 6.6 0.12 0.54
cultivated and waterlogged soils (60-75%, clayey). All three soils were low in organic matter content (<1%), except for the surface layer of the irrigated cultivated soil which con-tained 1-1.33% organic matter. The highest porosity or satu-ration water content was found in the waterlogged soil (0.52-0.69 cm3cm-3) and the lowest was in the non-irrigated upland soil (0.37-0.47 cm3cm-3). The non-irrigated upland and waterlogged surface soils were slightly acidic to neutral (pH 5.6 to 6.8). The EC values of all the soils were low for all depths (0.04 to 0.12 dS m-1, Table 1).
Water content of air dried soil before initiation of in-filtration (qi), final water content (q0) and water gain during infiltration (q0-i) are presented in Table 2. Average water content in soils after infiltration varied within the range of 0.41-0.60 cm3cm-3 in the irrigated cultivated soil and 0.47-0.60 cm3cm-3in the waterlogged soil, whereas the va-lues were 0.28-0.35 cm3cm-3 in the non-irrigated upland soil. The gains were higher in the irrigated cultivated and wa-terlogged soils. The highest sorptivity (3.9-4.5 mm min-1/2) was observed in the non-irrigated upland soil, followed by 1.7-2.5 mm min-1/2 in the irrigated cultivated soil and 1.0-1.6 mm min-1/2in the waterlogged soil. Sorptivity va-lues differ significantly (Ftab (2,6)> Fcal) for the three diffe-rent moisture regimes for diffediffe-rent depths. These results can also be verified from the slope of the cumulative infiltration vs. t½relationship curves (Fig. 3). The slope of the non-irri-gated upland soil in the present study was higher than those of the irrigated cultivated and waterlogged soils. The seaso-nal variation of cumulative infiltration may be attributed to the cultivation practicesieroot activity, apart from the varia-tions due to soil texture (Zhenget al., 2001). In the present study the seasonal variation of cumulative infiltration in the different soils was low (Figs 2, 3). This may be because of low variation of soil pH, EC, and organic carbon content of the soils in different seasons (Table 1), in addition to low textural variation. However, soil samples collected from the Soil Depth
(cm)
qi q0 q0-qi
Sorptivity (mm min-1/2) (vol.)
1st season NIU
0-15
0.01 0.29 0.28 4.0
IC 0.04 0.47 0.43 2.5
WL 0.05 0.47 0.42 1.6
NIU
15-30
0.01 0.31 0.30 4.0
IC 0.03 0.53 0.50 2.3
WL 0.04 0.49 0.45 1.3
NIU
30-45
0.01 0.35 0.34 3.9
IC 0.04 0.60 0.56 2.2
WL 0.04 0.60 0.56 1.2
2nd season NIU
0-15
0.01 0.29 0.28 4.5
IC 0.04 0.45 0.41 2.2
WL 0.05 0.49 0.43 1.5
NIU
15-30
0.02 0.28 0.26 4.0
IC 0.03 0.53 0.50 2.0
WL 0.07 0.57 0.50 1.0
NIU
30-45
0.01 0.32 0.31 3.9
IC 0.06 0.55 0.49 2.0
WL 0.07 0.60 0.53 1.0
3rd season NIU
0-15
0.02 0.30 0.28 4.4
IC 0.03 0.41 0.38 2.3
WL 0.06 0.50 0.44 1.6
NIU
15-30
0.02 0.29 0.27 4.2
IC 0.05 0.45 0.40 2.0
WL 0.07 0.55 0.48 1.2
NIU
30-45
0.01 0.32 0.31 4.0
IC 0.07 0.42 0.35 1.7
WL 0.07 0.58 0.51 1.1
F2, 6> Ftab(1%), C.D. =2.7, T1= 11.9, T2= 7.0, T3= 4.0. Explanations as in Table 1.
T a b l e 2.Water content and sorptivity of soil samples (1st, 2nd, and 3rd seasons)
2nd season showed the highest cumulative infiltration com-pared to those collected in the 1st and 3rd seasons. During rice cultivation all these soils were puddled. High clay con-tent facilitates puddling, resulting in a decrease in non-capil-lary pore spaces, which in turn decreases infiltration. The irrigated cultivated and waterlogged soils in the present stu-dy contained more clays, resulting in low infiltration (Fig. 2). In our study the cumulative infiltration of the non-irrigated upland soil was about 5 times higher than that of the water-logged soils. This result is agreed to the results of Singh and Bhargava (1993) for soils of India.
Organic carbon content of coarse soils is usually lower than that of clayey soils (Zinnet al., 2005) for all depths. In the present study organic carbon percentages decreased with soil depths for all water regimes and organic carbon content of the non-irrigated upland soil (0.29-0.68%) was less than that of the irrigated cultivated (0.9-1.1%) and waterlogged (0.95-1.0%) soils (Table 1). The relatively high porosity value of the 15-30 cm layer of non-irrigated upland soil, as compared to the surface soil horizon, was associated with greater clay content (Table 1). Similarly, the high porosity of the waterlogged and irrigated cultivated soils was associated with high % of clay for all the three layers. This may be due to the fact that with an increase in the content of smaller-sized particles in the soil layers there is a decrease in bulk density of the soil. EC values for all three soils were low, and increased slightly with soil depth. This might be attributed to higher compaction at greater soil depth. The sorptivity values studied in the soils of Gujarat (India) were 6.9, 3.3 and 1.9 mm min-1/2for sandy loam soil, clay loam and clay soils, respectively (Singh and Bhargava, 1993). The vertical sorptivity studied in India was 2.2 cm min-1/2in eucalyptus stand and 3.2 cm min-1/2 under crop-land (Mandal and Jayprakash, 2009). Sorptivity values in the present study differ significantly (Ftab (2,6)> Fcal) for the three different moisture regimes at different depths (Table 2). Sorptivity in the present study might be affected by tillage intensity and applied irrigation water. Sorptivity in the fields with higher levels of irrigation (irrigated cultivated fields) was 14-53% higher than in the less intensively irrigated plots (water-logged fields). Irrigation increases total porosity and pore continuity. For this reason, sorptivity of irrigated cultivated fields in the present study might have been higher than that of the waterlogged fields, though the textural classes of both types of fields were similar (Bhattacharyaet al., 2008).
The humic acid (HA) and fulvic acid (FA) fractions of soil organic matter are given in Table 3. Fractionation of organic matter showed that the percentage content of HA was the highest (0.35%) in the waterlogged soil, and that of FA was the lowest (0.1%) in the surface layer of the same soil. On the other hand, the FA fraction was the highest in the non-irrigated upland soil (0.2%). The irrigated cultivated soil showed intermediate values (0.12%). In the deeper layers also HA percentage content was higher in the waterlogged
soil (0.30-00.29%). The HA/FA ratio decreased with depth (0.35-0.33 for non-irrigated upland soils and 3.5 to 3.2 for waterlogged soils).
The relationships between sorptivity and clay, pH, EC, porosity and humic acid were significant (at 1% probability level) (R = -0.86, -0.70, -0.94, -0.87 and -0.85, respectively), exponential and negative (Table 4). Percentage share of fulvic acid was positively correlated (R = 0.90, significant at 1% level) with sorptivity. Table 5 shows that both the per-centage of clay content and clay + silt content were signi-ficantly (+ve) correlated to Corg.(R2= 0.75 and 0.72, respec-tively). Humus is the major soil organic matter component, making up 75-80% of the total (Osat and Heidari, 2010). The humus content in alluvial soil is 1.5 -6% (Swift, 2011). The humic acid fulvic acid ratio in the present study was 0.35, 2.5 and 3.5 in the surface layers of the non-irrigated upland soil,
Soil Depth
(cm)
Corg. HA FA HA/FA
ratio (%)
NIU
0-15
0.68 0.07 0.20 0.35
IC 1.93 0.30 0.12 2.50
WL 1.68 0.35 0.10 3.50
NIU
15-30
0.61 0.06 0.18 0.33
IC 1.24 0.30 0.11 2.70
WL 1.26 0.30 0.09 3.30
NIU
30-45
0.59 0.06 0.18 0.33
IC 0.92 0.25 0.09 2.70
WL 0.96 0.29 0.09 3.20
Explanations as in Table 1.
T a b l e 3. Humic acid and fulvic acid content of soils (pooled data for three seasons)
Soil parameter Correlation coefficient (r)
Regression equation Clay (%) -0.86 ** S= 6.0 e-0.02-x
pH -0.70 * S= 359.5 e-0.87-x
EC (dS m-1) -0.94 ** S= 18.2 e -28.5-x Porosity (vol.) -0.87 ** S= 31.9 e-4.5-x Humic acid (%) -0.85 ** S= 4.3 e-1.7-x Fulvic acid (%) 0.90 ** S= 0.45 e12.3-x *significant at 5% probability level, **significant at 1% probability level,Sis sorptivity (mm min-1/2).
irrigated cultivated and waterlogged soils, and slightly decreased with soil depth (0.33, 2.7 and 3.2, respectively, in 30-45 cm layer) (Osat and Heidari, 2010; Weil, 1993). The presence of humic acid in soil generally decreases the volumetric water content of soil. Decline in water repellence of soil is due to the presence of watersoluble fulvic acid. The non-irrigated upland soils in the present study had a higher fraction of fulvic acid (0.15-0.2%), due to which they were more capable of infiltration, whereas waterlogged soils had a greater fraction of insoluble humic acid (0.29-0.35% ) and exhibited less cumulative infiltration (Dyke et al., 2009; Singh and Das, 1992) (Table 3). The sorptivity decreased as the clay content, pH, EC, porosity and humic acid content of the soil increased (R= -0.86, -0.70, -0.94, -0.87, and -0.85, respectively) (Table 4). Similar results were found by Singh and Kundu (2001 ) for Orissa (India) soils.
The clay content was found to be the best predictor of organic carbon. Table 5 shows that both the percentage of clay content and percentage of clay plus silt were signifi-cantly (+ve) correlated with the percentage of organic carbon (R2= 0.75 and 0.72, respectively). This may be attributed to the decrease in C mineralization with increase in finer-sized particles. Or, in other words, pores of smaller sizes protect organic substrates against microbial decomposition in soils (Mtambanengweet al., 2008).
CONCLUSIONS
1. Cumulative infiltration and sorptivity showed that in general the values were high in non-irrigated upland soils and low in waterlogged soils, and intermediate in irrigated cultivated soils.
2. The non-irrigated upland soils had a higher fraction of fulvic acid, due to which they were more capable of infil-tration, whereas the waterlogged soils had a greater fraction of insoluble humic acid and exhibited less cumulative infil-tration, which might be partially contributing towards water congestion on the surface.
3. The humic acid fulvic acid ratio decreased with soil depth.
4. In soils where the cumulative infiltration and sorp-tivity are low to intermediate (waterlogged and irrigated cul-tivated soils), adoption of suitable management practices
such as deep ploughing, addition of sand and vertical drai-nage for in situ conservation of water is necessary to im-prove water use efficiency and productivity of the soils. Addition of organic matter in the non-irrigated upland soils is needed to improve organic carbon status and to improve water holding capacity of soil.
5. Physicochemical parameters like organic carbon, po-rosity, EC, pHetc. and sorptivities, studied in three different seasons, did not differ much indicating the influence of sea-sons on soil sorptivity was low. However, the correction of soil pH and EC, and modification of soil texture with adop-tion of appropriate amendments will help in improving the sorptivity of the soils.
REFERENCES
Bai J., Deng W., Cui B., and Ouyang H., 2007. Water diffusion coefficients of a horizontal soil columns from natural saline-alkaline wetlands in a semi arid area. Eurasian Soil Sci., 40, 660-664.
Bhattacharya R., Kundu S., Pandey S.C., Singh K.P., and Gupta H.S., 2008. Tillage and irrigation effects on crop yields and soil properties under the rice-wheat system in the Indian Himalayas. Agric. Water Manag., 95, 9-18. Bisdom E.B.A., Dekker L.W., and Schoute J.F., 1993. Water
re-pellency of sieve fractions from sandy soils and relationships with organic material and soil structure. Geoderma, 56, 105-118.
Black C.A., 1965. Methods of Soil Analysis. Part I, Agronomy Monograph, No. 9. ASA Press, Madison, WI, USA. Doerr S.H., Shakesby R.A., and Walsh R.P.D., 1996. Soil
hydro-phobicity variations with depth and particle size fraction in burned and unburnedEucalyptus globulesandPinus Pinaster forest terrain in Agueda basin, Portugal. Catena, 27, 25-47. Dyke A.V., Johnson P.G., and Grossl P.R., 2009. Humic
sub-stances effect on moisture retention, nutrition, and colour of Intermountain West Putting Greens. USGA Turfgrass Environ. Res., 8, 1-9.
Franco C.M.M., Clarke P.J., Tate M.E, and Oades J.M., 2000. Hydrophobic properties and chemical characterizartion of na-tural water repellent materials in Australian sands. J. Hydrol., 231, 47-58.
Harden C.P. and Scruggs P.D., 2003. Infiltration on mountain slopes: a comparison of three environments. Geomorph.,55, 5-24.
Jackson M.L., 1973. Soil Chemical Analysis. Prentice Hall Press, New Delhi, India.
Karnok K.A., Rowland E.J., and Tan K.H., 1993. High pH treatments and the alleviation of soil hydrophobicity on golf greens. Agron. J., 85, 983-986.
Kirkham M.B., 2005. Infiltration. Principles of Soil and Plant Water Relations. Elsevier Press, Amsterdam-New York. Mandal D. and Jayaprakash J., 2009. Water repellency of soils
in the lower Himalayan regions of India: impact of land use. Curr. Sci.,96, 148-150.
Mtambanengwe F., Mapfumo P., and Kirchmann H., 2008. Decomposition of organic matter in soil as influenced by texture and pore size distribution. World J. Microbiol., 20, 673-677.
Soil separates (x)
Square of correlation coefficient (R2)
Regression equation
Clay (%) 0.75* Corg.= 0.29 + 0.01 x
Clay + silt (%) 0.72* Corg.= 0.25 + 0.01 x *significant at 5% probability level.
Osat M. and Heidari A., 2010. Soil organic matter fractionation. Geophys. Res. Abstracts, 12.
Rashid A., 2011. Soil and Plant Analysis. Laboratory Manual. National Agric. Res. Centre Press, Islamabad, Pakistan. Rehman G.A., 2010. A study of infiltration rate in South West
Region of Burkina Faso. Australian J. Basic Appl. Sci., 4, 1349-1357.
Singh R. and Bhargava G.P., 1993. Infiltration characteristics of some inceptisols. J. Ind. Soc. Soil Sci., 41, 218-223. Singh R. and Das D.K., 1992. Wettability of soil under different
plant covers. J. Ind. Soc. Soil Sci., 40, 39-43.
Singh R. and Kundu D.K., 2001. Sorptivity of some soils in relation to their physicochemical properties. J. Ind. Soc. Soil Sci., 49, 233-238.
Swift R.S., 2011.Organic matter characterization. In: Methods of Soil Analysis (Ed. J. Sparks). SSSA Press, Madison, WI, USA.
Weil R.R., 1993. Humic/fulvic acid ratios of some surface soils. Am. J. Alter. Agric.,8, 5-14.
Yang H., Rahardjo H., Leong E.C., and Fredlland D.G., 2004. A study of infiltration on three sand capillary barriers. Can. Geotech. J., 41, 629-643.
Zheng X., Van Liew M.W., and Flerchinger G.N., 2001. Experi-mental study of infiltration into a bean stubble field during seasonal freeze-thaw period. Soil Sci., 166, 3-10.