A b s t r a c t. Dehydrogenase activity of an Orthic Luvisol developed from loess (Ap horizon) was observed in a greenhouse pot experiment with triticale cv. Jago vegetation under different aeration conditions. Soil aeration conditions were modified through the use of the combination of three degrees of soil compaction (1.20, 1.35 and 1.50 Mg m-3) and three levels of water condition (control level of 15-80 kPa; 2-5 kPa and water satu-ration). Triticale plants were planted into the soil at three density levels and water conditions were maintained at the control level, except at three physiological stages of tillering, shooting, and the beginning of plant flowering when 14-days oxygen stresses (I, II and III, respectively) were applied. During the stresses the water regime of the soil was elevated to the level of 2-5 kPa or flooded, except for the control pots. Four replications of each combination of compaction and water status were prepared. Soil aeration parameters such as oxygen diffusion rate ODR, redox potential -Eh, concentration of Fe+2and soil dehydrogenase activity were measured four times during each stress period. The changes of the dehydrogenase activity at particular water content levels during the stresses are presented. Significant correlations between dehydro-genase activity and soil aeration indicators (Eg, ODR, Eh, Fe+2) are reported.
K e y w o r d s: soil aeration status, dehydrogenase activity, triticale, redox potential, oxygen diffusion rate
INTRODUCTION
Soil enzyme activity plays an important role in the maintenance of soil fertility [6,16]. Dehydrogenases are enzymes of respiration pathways of aerobic as well as of anaerobic microorganisms [4,23]. Soil management tech-niques influence microbial communities in soil and, indi-rectly, change the activity levels of many enzymes. The soil oxygenation status results from the equilibrium between the
physical processes of gas transport between the atmosphere and the soil pores, and the biological processes of O2uptake
and CO2production. Important factors modifying the
diffu-sion of gases in the soil, and influencing the growth of plants, are water and compaction conditions [11,12,14,21].
The aim of the present study was to determine the relation of the dehydrogenase activity to soil aeration status, modified due to the regulation of the water status and the degree of soil compaction in a pot experiment with Orthic Luvisol planted with triticale cv. Jago.
MATERIAL AND METHODS
The soil was an Orthic Luvisol developed from loess (Ap horizon), containing 1.54% Corg., 25% of 1-0.05 mm fraction, 70% of 0.05-0.002 mm fraction and 5% of <0.002 mm fraction with a particle density of 2.58 Mg m-3and pH in H2O of 6.5. Fresh soil material was sieved through a 0.5 cm sieve. Then 108 plastic pots (6 dm3volume, 20 cm high) were filled with the soil at three levels of bulk density: 1.20, 1.35 and 1.50 Mg m-3(36 pots of each density). Before triti-cale was sown, the soil was fertilised with 0.1 g N, 0.125 g K and 0.066 g P kg dry soil-1in the form of NH4NO3, K2SO4 and KCl, and CaHPO4×2H2O, respectively. The triticale (cv. Jago) seeds were planted at 2 cm depth into the soil at three degrees of compaction. After emerging, 25 plants per pot were left to grow at the start of the experiment. The soil water status was maintained at the control level of 15-80 kPa in all the pots, except during periods of oxygen deficiency. The water content was elevated during the stresses from the control level (15-80 kPa) to 2-5 kPa or to 0 kPa (5-10 mm water layer on the soil surface) at each bulk density.
Effect of oxygen deficiency on soil dehydrogenase activity in a pot experiment
with triticale cv. Jago vegetation
M. Brzeziñska
1, W. Stêpniewski
1,2, Z. Stêpniewska
1,3, G. Przywara
1, and T. W³odarczyk
11
Institute of Agrophysics, Polish Academy of Sciences, Doœwiadczalna 4, P.O. Box 201, 20-290 Lublin 27, Poland
2
Department of Environmental Protection Engineering, Technical University of Lublin, Nadbystrzycka 40, 20-618 Lublin, Poland
3
Faculty of Biochemistry and Environmental Chemistry, Catholic University of Lublin, Kraœnicka 102, 20-950 Lublin, Poland
Received October 9, 2000; accepted December 1, 2000
© 2001 Institute of Agrophysics, Polish Academy of Sciences
*Corresponding author’s e-mail: mbrzez.demeter.ipan.lublin.pl
A
A
Agggrrroooppphhyhyysssiiicccsss
w w
Simultaneously, an appropriate number of pots remained at the water regime of 15-80 kPa as a control. Four pots for each combination of water level and compaction were prepared as replications. 14-day oxygen stresses were applied at the three plant physiological stages: at tillering (stress I), at shooting (stress II) and at the beginning of flowering (stress III). A complete set of 36 pots was pre-pared for each successive stress. The experiment was conducted in a greenhouse.
Measurements were taken four times during each stress period. Before soil sampling, the oxygen diffusion rate (ODR), the redox potential (Eh) and the pH in situ were measured. The ODR was determined by the use of a device described by Malicki and Walczak [15]. Four Pt wire elec-trodes (0.5 x 4 mm) were placed at a depth of 2 cm and polarised to –650 mV vs saturated calomel electrode for 4 min. The Eh was measured with a pH-Meter (Orion Re-search Ionanalyzer) using five Pt electrodes (0.5 x 4 mm) placed at a 2 cm depth of vs saturated calomel electrode. The pH in situ was assayed by the use of a combined glass electrode [8,11].
Soil was sampled at three places in each pot (0-5 cm) and mixed carefully. Measurements of Fe+2content were made in 0.05 M sulphuric acid extracts with the use ofa,a’ -dipyridyl in an acetate buffer, pH 4.5 [1]. Dehydrogenase activity was determined with triphenyl tetrazolium chloride (TTC) after 20 h incubation at 30oC [5] and expressed as nmol triphenyl formazan (TPF) g-1oven dry soil min-1. The Fe+2content and enzyme activity were calculated on the basis of the oven-dry (105oC) soil mass. The soil water con-tent was determined gravimetrically.
RESULTS AND DISCUSSION
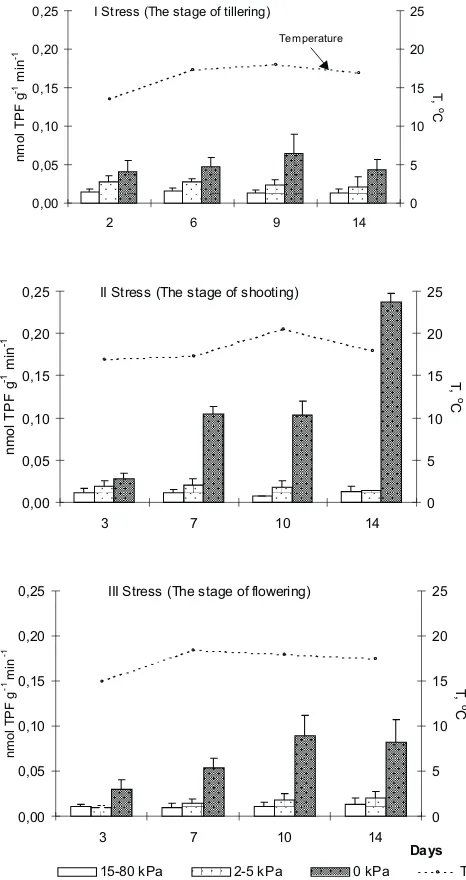
Figure 1presents the dynamic of the enzyme activity during the three vegetation stages. The natural changes in soil temperatures of day-night cycles are shown. The bars indicate enzyme activity as the average values of three com-paction levels for each water status. Dehydrogenase activity was the lowest in the control soil (at 15-80 kPa water con-ditions). The activity increased with an increased water supply, and especially strongly in flooded soil (0 kPa). The most dynamic changes were observed with stress II at plant shooting. The average temperature of that period (18.5oC) was somewhat higher than with stresses I and III (16.5 and 17.1oC, respectively), and this stimulated an increase of enzyme activity. It has been found in model experiments that temperature significantly affects dehydrogenase activity in water-saturated soil [3].
Figure 2presents dehydrogenase activity of the Orthic Luvisol at particular levels of water status and bulk density, calculated as the average values over the entire experiment. The water regime significantly influenced enzyme activity (P<0.001). The average values at 2-5 kPa were 1.5-fold higher, whereas those at 0 kPa - as much as 5.6-fold higher than those of the control soil. The lowest dehydrogenase
activity (in average 0.012 nmol TPF g-1min-1) was shown by the soil of the low bulk density (1.2 Mg m-3) at control water level (15-80 kPa), and the highest (on average 0.083 nmol TPF g-1 min-1) - by the flooded soil at the highest compaction. Increase in bulk density had no statistically-significant effect on soil dehydrogenase activity in this experiment.
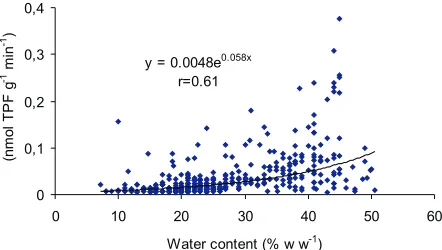
Results of the entire experiment allow us to see some interesting effects. Figure 3 shows enzyme activity versus soil water content. The wide range of water content (8-50 % w/w) was a strong physical determinant of the dehydro-genase activity.
III Stress (The stage of flowering)
0,00 0,05 0,10 0,15 0,20 0,25
3 7 10 14
Days
nm
ol
T
P
F
g
-1mi
n
-1
0 5 10 15 20 25
T,
o
C
15-80 kPa 2-5 kPa 0 kPa T
Fig. 1.The dynamic of dehydrogenase activity of the Orthic Luvisol developed from loess during oxygen stresses at three physiological stages of triticale vegetation (average values of three degrees of soil compaction). Errors bars are standard deviations of the means.
I Stress (The stage of tillering)
0,00 0,05 0,10 0,15 0,20 0,25
2 6 9 14
nm
ol
T
P
F
g
-1
min
-1
0 5 10 15 20 25
T,
o
C
II Stress (The stage of shooting)
0,00 0,05 0,10 0,15 0,20 0,25
3 7 10 14
nm
ol
T
P
F
g
-1
min
-1
0 5 10 15 20 25
T,
o
C
Air-filled porosity, affected by the water supply and the degree of compaction, ranged from 0 to 0.44 m3m-3(Fig. 4). Dehydrogenase activity increased with the decrease in the pore space available for air, expressed by Eg.
The changes in the proportion of the soil gas phase and soil solution implicate several physico-chemical-biological transformations [11,12,24]. Soil reduction after flooding is gradual and most of these processes are mediated by the action of microorganisms [18]. After O2exhaustion,
aero-bes are replaced by anaeroaero-bes, which use inorganic and organic compounds as terminal acceptors of electrons du-ring respiration. As a result, a decrease in redox potential and increased concentrations of NH4+, Fe+2 and Mn+2 are
observed [13,18]. A shift in activity from aerobic to ana-erobic microorganisms, following the depletion of O2after
soil flooding, is accompanied by stimulation in the activity of soil dehydrogenases [3,17,19,20,22].
Figure 5presents the results for dehydrogenase activity for the entire experiment in relation to the micro-diffusion index (ODR), a direct measure of the availability of soil oxygen. The ODR values ranged from 1 to 127 µg m-2s-1. Dehydrogenase activity was negatively related to this parameter (r=-0.63***). Well-aerated Orthic Luvisol sho-wed low levels of dehydrogenase activity and its sharp increase was observed at ODR values below 30 µg m-2s-1. The modification of soil aeration during the stresses, resulted in changes in the concentration of reduced Fe from 0 to 370 mg kg-1(Fig. 6). A significant correlation between dehydrogenase activity and Fe+2content (r=0.71) is shown. Iron reduction is a parallel process to the stimulation of soil dehydrogenase under soil O2deficit. Additionally, a special
role of some dehydrogenases in microbiological Fe+3 reduc-tion has been suggested [2,7].
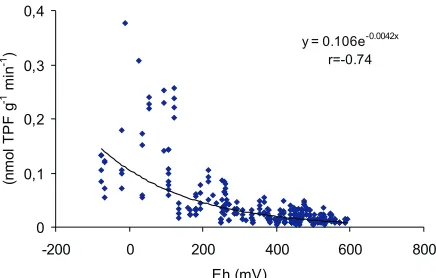
Redox potential is a parameter which integrates all bio-chemical transformations in the soil and reflects the electron activity of the soil solution. The Eh values of the Orthic Luvisol in the pot experiment (Fig. 7) ranged from 600 mV (observed in less-watered and less-compacted soil) down to
1.20 1.35 1.50 (Mg m-3)
0,00 0,03 0,05 0,08 0,11
15-80 2-5 0 15-80 2-5 0 15-80 2-5 0 kPa
(n
mo
lT
PF
g
-1mi
n
-1)
Fig. 2.Dehydrogenase activity of the Orthic Luvisol at particular combinations of water status and bulk density (average values of the entire experiment with 95% confidence intervals of Tukey).
y = 0.0048e0.058x r=0.61
0 0,1 0,2 0,3 0,4
0 10 20 30 40 50 60
Water content (% w w-1)
(n
m
ol
T
P
F
g
-1
min
-1)
Fig. 3.Dehydrogenase activity as a function of soil water content (results of entire experiment included).
y = 0.047e-5.1x r=-0.62
0 0,1 0,2 0,3 0,4
0 0,1 0,2 0,3 0,4 0,5
(n
m
ol
T
P
F
g
-1
min
-1)
Fig. 4.Relation between soil dehydrogenase activity and air-filled porosity (results of the entire experiment included).
Eg (m3m-3)
y = 0.241x-0.713 r=-0.63
0 0,1 0,2 0,3 0,4
0 50 100 150
ODR (µg m-2s-1)
(n
m
ol
T
P
F
g
-1
min
-1)
-75 mV (in flooded soil of high density). Dehydrogenase activity is strongly correlated with Eh (r=-0.74). The pot experiment with triticale vegetation is consistent with the results of laboratory experiments that Eh better describes the relationship between dehydrogenase activity and soil aera-tion status than ODR [3].
The experiment has shown that modification of soil conditions from well-aerated to water-saturated soil with triticale vegetation implies many biochemical transforma-tions. The soil aeration status evidently influences dehydro-genase activity. The efficiency of the anaerobic metabolism is lower than that of aerobic respiration. Such a situation pro-motes increased levels of the dehydrogenase activity [3,9, 10]. The lowest activity, observed in the tested soil, was 0.0036 nmol TPF g-1min-1and the highest was 0.378 nmol TPF g-1min-1. Minimum dehydrogenase activity was ob-served in the aerated soil system (characterised by Eg, ODR, Fe+2, and Eh values equal to 0.35 m3m-3, 93 µg m-2s-1, 14 mg kg-1 and 250 mV, respectively). Maximum dehydro-genase activity occurred in the soil at the end of the14-days
of the flooding period (characterised by Eg, ODR, Fe+2, and Eh values equal to 0.0001 m3m-3, 15 µg m-2s-1, 360 mg kg-1, and -10 mV, respectively). Therefore, the modification of the water status and the degree of compaction (at the natural temperature fluctuations) may alter the dehydro-genase activity of the soil tested up to 105-fold. Such a strong influence of the physical factors suggests the neces-sity of standardising soil conditions before biochemical indexes are assayed.
CONCLUSIONS
It has been shown that in Ap horizon of an Orthic Luvisol developed from loess:
1. Dehydrogenase activity was the highest in water-saturated soil at the stage of shooting (stress II).
2. Soil flooding resulted in a significant increase of soil dehydrogenase activity (on average a 5.6-fold increase, P<0.001).
3. Dehydrogenase activity showed a significant corre-lation with soil aeration parameters (r=-0.62, r=-0.63, r=0.71 and r=-0.74 for Eg, ODR, Fe+2 content and Eh, respectively).
REFERENCES
1.Aleksandrova L.J. and Naidenova O.A., 1967.Laboratory Measurements in soil Science (in Russian). Kolos, Leningrad. 2.Bromfield S.M., 1954.Reduction of ferric compounds by soil
bacteria. J. Gen. Microbiol., 11, 1-6.
3.Brzeziñska M., Stêpniewska Z., and Stêpniewski W., 1998.
Soil oxygen status and dehydrogenase activity. Soil Biol. Biochem., 30, 1783-1790.
4.Burns R.G., 1978.Enzyme activity in soil: some theoretical and practical considerations. In: Soil Enzymes (Ed. R.G. Burns), Academic Press Inc., London, LTD, 295-326. 5.Casida L.E., Klein D.A., and Santoro T., 1964.Soil
dehy-drogenase activity. Soil Sci., 98, 371-376.
6.Dkhar M.S. and Mishra R.R., 1983. Dehydrogenase and urease activities of maize (Zea maysL.) field soils. Plant Soil 70, 327-333.
7.Galstian A.S. and Awundjan Z.S., 1974.The role of enzymes in reduction of Fe2O3and MnO2in soil. Trans. 10th Intern.
Congr. Soil Sci. III Nauka, Publishing House, Moscow, 130-135.
8.Gliñski J. and Konstankiewicz K., 1991.Methods and in-struments for agrophysical research (in Polish). Problemy Agrofizyki, 64.
9.Gliñski J., Stêpniewska Z., and Brzeziñska M., 1986. Cha-racterisation of the dehydrogenase and catalase activity of the soils of two natural sites with respect to the soil oxygenation status. Polish J. Soil Sci., 19, 47-52.
10.Gliñski J., Stêpniewska Z., and Kasiak A., 1983.Changes of soil enzyme activity at different water and oxygen contents (in Polish). Rocz. Glebozn., 34, 53-59.
11.Gliñski J. and Stêpniewski W., 1985.Soil Aeration and Its Role for Plants. CRC Press, Boca Raton, Florida.
12.Gliñski J., Stêpniewski W., Stêpniewska Z., W³odarczyk T., and Brzeziñska M., 2000.Characteristics of the aeration
y = 0.0007x + 0.018 r=0.71
0 0,1 0,2 0,3 0,4
0 100 200 300 400
Fe+2(mg kg-1)
(n
m
ol
T
P
F
g
-1
min
-1)
Fig. 6. Relation between soil dehydrogenase activity and Fe+2
concentration (results of all experimental combinations included).
y = 0.106e-0.0042x
r=-0.74
0 0,1 0,2 0,3 0,4
-200 0 200 400 600 800
Eh (mV)
(n
m
ol
T
P
F
g
-1
min
-1)
properties of selected soil profiles from Central Europe. Int. Agrophysics, 14, 17-31.
13.Gunnison D., Engler R.M., and Patrick W.H.Jr., 1985.
Chemistry and microbiology of newly flooded soils: relation-ship to reservoir - water quality. In: Microbial Processes in Reservoirs (Ed. D. Gunnison). W. Junk Publishers, Dordrecht, Boston, Lancaster, 39-57.
14.Lipiec J. and Stêpniewski W., 1995.Effects of soil com-paction and the tillage system on the uptake and loss of nu-trients. Soil Tillage Res., 35, 37-52.
15.Malicki M. and Walczak R., 1983.A gauge for redox poten-tial and the oxygen diffusion rate in soils with an automatic regulation of cathode potential. Zesz. Probl. Post. Nauk Roln., 220, II, 447-452.
16.Metting F.B., 1983.Structure and physiological ecology of soil microbial communities. In: Soil Microbial Ecology (Ed. F.B. Metting). Marcel Dekker Inc. New York, 3-25. 17.Okazaki M., Hirata E., and Tensho K., 1983.TTC reduction
in submerged soils. Soil Sci. Plant Nutr., 29, 489-497. 18.Ottow J.C.G., 1980.Mechanisms of bacterial iron-reduction
in flooded soils. Proc. Symp. Paddy Soil, Nanjing, China, 330-344.
19.Pedrazzini F.R. and McKee K.L., 1984.Effect of flooding on activities of soil dehydrogenases and alcohol dehydrogena-se in rice (Oryza sativaL.) roots. Soil Sci. Plant Nutr., 30, 359-366.
20.Stêpniewska Z., Gliñski J., W³odarczyk T., Brzeziñska M., Blum W.E.H., Rampazzo N., and Wimmer B., 1997.The soil aeration status of some Austrian soils. Int. Agrophysics, 11, 199-206.
21.Stêpniewski W., Gliñski J., and Ball B.C., 1994.Effect of compaction on soil aeration properties. In: Soil Compaction in Crop Production (Eds B.D. Soane and C. van Ouwerkerk). Elsevier Science B.V., Chapter 8, 167-189.
22.Stêpniewski W., Stêpniewska Z., W³odarczyk T., D¹bek-Szreniawska M., Brzeziñska M., S³owiñska-Jurkiewicz A., and Przywara G., 1993.Aeration related properties and their influence on soil biological parameters. Int. Agrophysics, 7, 163-173.
23.Stevenson I.L., 1959.Dehydrogenase activity in soils. Can. J. Microbiol., 5, 229, 235.