VOLUME NO. 5 (2015), ISSUE NO. 07 (JULY) ISSN 2231-5756
VOLUME NO. 5 (2015), ISSUE NO. 07 (JULY) ISSN 2231-5756
INTERNATIONAL JOURNAL OF RESEARCH IN COMMERCE, IT & MANAGEMENT
CONTENTS
Sr.
No.
TITLE & NAME OF THE AUTHOR (S)
Page
No.
1
.
A STUDY ON CUSTOMER’S APPREHENSION TOWARDS MOBILE BANKING TECHNOLOGY
PADMAAVATHY.PA. & DR. B. ADALARASU
1
2
.
TURNOVER ANALYSIS: A CASE STUDY OF AUTOMOBILE INDUSTRY IN INDIA
DR. M. VENKATA RAO & DR. K. KANAKA RAJU
5
3
.
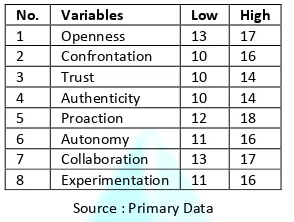
UNDERSTANDING ORGANISATIONAL CULTURE THROUGH OCTAPACE PROFILE: AN EMPIRICAL STUDY OF
THE UNIVERSITY
DR. PRAVEEN CHOUGALE & SOMNATH D. PAWAR
13
4
.
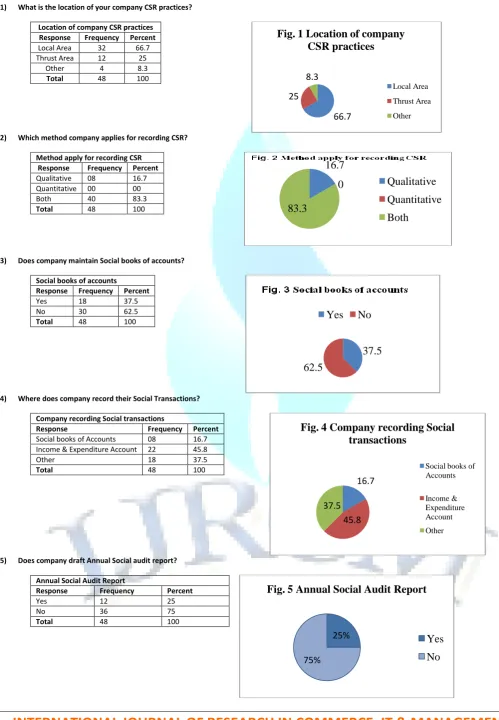
A COMPARATIVE STUDY OF SOCIAL ACCOUNTING, AUDITING AND DISCLOSURE PRACTICES APPLIED BY
INDIAN CORPORATE SECTOR
SHARDHA G. THAKUR & DR. MAHESHCHANDRA P. JOSHI
18
5
.
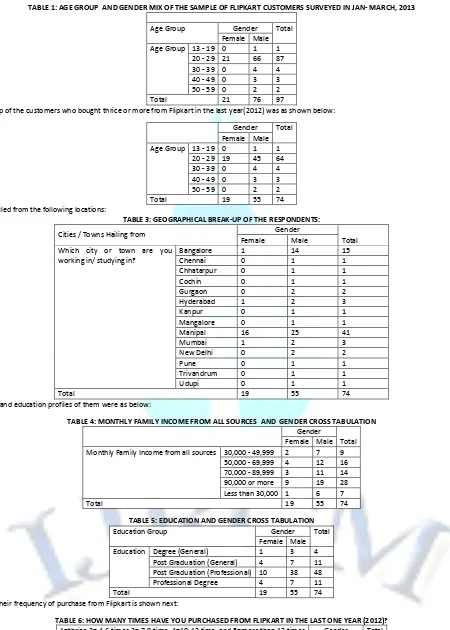
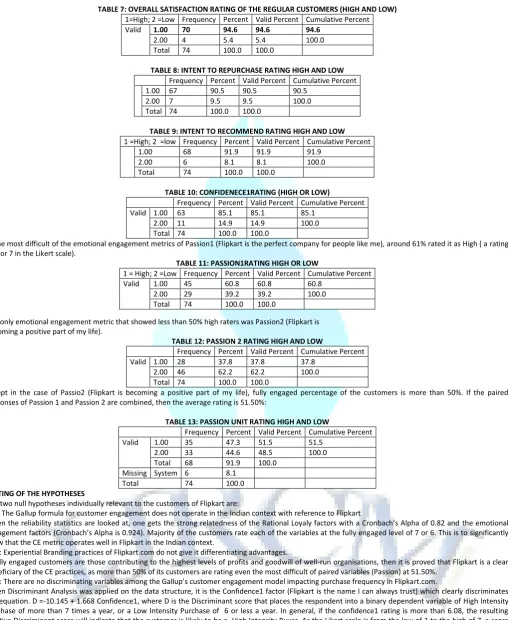
CRITICAL FACTORS FOR THE SUCCESS OF EXPERIENTIAL BRANDING IN FLIPKART.COM
K.J. JAIMS & BELAGAVI BAKKAPPA
23
6
.
DETERMINANTS OF JORDANIAN BANKING SYSTEM ACTIVITIES
GHAZI A. ALRGAIBAT & TORKI M. AL-FAWWAZ
29
7
.
ASSESSING THE MEDIATING ROLE OF SOCIAL IDENTITY ON THE RELATIONSHIP BETWEEN SOCIAL
NETWORKING SITE USAGE AND BRIDGING SOCIAL CAPITAL
SANGEETHA K L & DR. D. MAVOOTHU
36
8
.
IMPACT OF THE REFORM OF LIBERALIZATION ON EMPLOYEES' PRODUCTIVITY OF ETHIOPIAN LEATHER
INDUSTRY
DR. BREHANU BORJI
41
9
.
INTEGRATED MARKETING COMMUNICATION IN POLITICAL CAMPAIGNING: A SUCCESS STORY OF BJP IN
2014 LOK SABHA ELECTION
MOHD DANISH CHISHTI, DR. RESHMA NASREEN, NAZIA HASAN KHAN, PRIYANKA INDORIA & MIR SHAHID
SATAR
49
10
.
DIMENSIONS OF OPERATIONAL EFFICIENCY OF INDIAN PAINT INDUSTRY: AN EMPIRICAL STUDY
S. KAMALADEVI & DR. A. VIJAYAKUMAR
53
11
.
ATTITUDE OF CUSTOMERS TOWARDS INTERNET BANKING: A CASE OF NAMAKKAL TOWN, TAMIL NADU
M.MATHIYARASAN & DR.G.VADIVALAGAN
59
12
.
ADVERTISING ON SOCIAL MEDIA: THE INDIAN SCENARIO
PRAMA VISHNOI & NAMITA PADHY
63
13
.
THE PROMOTIONAL STRATEGY IN COMPETITIVE SMARTPHONE MARKET: A CASE STUDY OF INDIAN AND
CHINESE MOBILE HANDSETS COMPANIES
SHWETA
66
14
.
YOUNG SHOPPERS’ PERCEPTIONS ON LEADING ONLINE RETAILERS - WITH SPECIFIC REFERENCE TO
E-SERVICE QUALITY AND E-RECOVERY DIMENSIONS
DR. ANDAL AMMISETTI
70
15
.
AWARENESS ABOUT AVAILABILITY OF EDUCATIONAL LOANS FOR HIGHER EDUCATIONAL PROGRAMMES
AMONG THE PU STUDENTS OF BANGALORE CITY
ASHA RANI.K
73
16
.
FACTORS THAT MAKE THE DIFFERENTIATION IN THE SERVICE SECTOR
AASHISH.C.I
80
17
.
ADAPTABILITY OF QUALITY MANAGEMENT IN HUMAN RESOURCES OF PUBLIC TRANSPORT SYSTEM
SARIN RAJU & SINI V.PILLAI
83
18
.
EFFECTIVENESS OF TRAINING FOR HUMAN RESOURCE DEVELOPMENT: A CASE STUDY OF A PUBLIC
SECTOR BANK IN ODISHA
LOPAMUDRA PATTNAIK & NAMEIRAKPAM CHETANA
88
19
.
EMPLOYER BRANDING:
EMPLOYER OF CHOICE
ANURADHA DHANKAR
94
20
.
HUMAN RIGHTS OF AN ACCUSED PERSON UNDER CRIMINAL JUSTICE SYSTEM IN INDIA
SANSAR SINGH
96
VOLUME NO. 5 (2015), ISSUE NO. 07 (JULY) ISSN 2231-5756
CHIEF PATRON
PROF. K. K. AGGARWAL
Chairman, Malaviya National Institute of Technology, Jaipur
(An institute of National Importance & fully funded by Ministry of Human Resource Development, Government of India)
Chancellor, K. R. Mangalam University, Gurgaon
Chancellor, Lingaya’s University, Faridabad
Founder Vice-Chancellor (1998-2008), Guru Gobind Singh Indraprastha University, Delhi
Ex. Pro Vice-Chancellor, Guru Jambheshwar University, Hisar
FOUNDER PATRON
LATE SH. RAM BHAJAN AGGARWAL
Former State Minister for Home & Tourism, Government of Haryana
Former Vice-President, Dadri Education Society, Charkhi Dadri
Former President, Chinar Syntex Ltd. (Textile Mills), Bhiwani
FORMER CO-ORDINATOR
DR. S. GARG
Faculty, Shree Ram Institute of Business & Management, Urjani
ADVISORS
PROF. M. S. SENAM RAJU
Director A. C. D., School of Management Studies, I.G.N.O.U., New Delhi
PROF. M. N. SHARMA
Chairman, M.B.A., Haryana College of Technology & Management, Kaithal
PROF. S. L. MAHANDRU
Principal (Retd.), Maharaja Agrasen College, Jagadhri
EDITOR
PROF. R. K. SHARMA
Professor, Bharti Vidyapeeth University Institute of Management & Research, New Delhi
CO-EDITOR
DR. BHAVET
Faculty, Shree Ram Institute of Engineering & Technology, Urjani
EDITORIAL ADVISORY BOARD
DR. RAJESH MODI
Faculty, Yanbu Industrial College, Kingdom of Saudi Arabia
PROF. SANJIV MITTAL
University School of Management Studies, Guru Gobind Singh I. P. University, Delhi
PROF. ANIL K. SAINI
VOLUME NO. 5 (2015), ISSUE NO. 07 (JULY) ISSN 2231-5756
INTERNATIONAL JOURNAL OF RESEARCH IN COMMERCE, IT & MANAGEMENT
DR. MOHENDER KUMAR GUPTA
Associate Professor, P. J. L. N. Government College, Faridabad
DR. SHIVAKUMAR DEENE
Asst. Professor, Dept. of Commerce, School of Business Studies, Central University of Karnataka, Gulbarga
ASSOCIATE EDITORS
PROF. NAWAB ALI KHAN
Department of Commerce, Aligarh Muslim University, Aligarh, U.P.
PROF. ABHAY BANSAL
Head, Department of Information Technology, Amity School of Engineering & Technology, Amity
University, Noida
PROF. A. SURYANARAYANA
Department of Business Management, Osmania University, Hyderabad
PROF. V. SELVAM
SSL, VIT University, Vellore
DR. PARDEEP AHLAWAT
Associate Professor, Institute of Management Studies & Research, Maharshi Dayanand University, Rohtak
DR. S. TABASSUM SULTANA
Associate Professor, Department of Business Management, Matrusri Institute of P.G. Studies, Hyderabad
SURJEET SINGH
Asst. Professor, Department of Computer Science, G. M. N. (P.G.) College, Ambala Cantt.
FORMER TECHNICAL ADVISOR
AMITA
Faculty, Government M. S., Mohali
FINANCIAL ADVISORS
DICKIN GOYAL
Advocate & Tax Adviser, Panchkula
NEENA
Investment Consultant, Chambaghat, Solan, Himachal Pradesh
LEGAL ADVISORS
JITENDER S. CHAHAL
Advocate, Punjab & Haryana High Court, Chandigarh U.T.
CHANDER BHUSHAN SHARMA
Advocate & Consultant, District Courts, Yamunanagar at Jagadhri
SUPERINTENDENT
VOLUME NO. 5 (2015), ISSUE NO. 07 (JULY) ISSN 2231-5756
CALL FOR MANUSCRIPTS
We invite unpublished novel, original, empirical and high quality research work pertaining to recent developments & practices in the areas of Computer Science & Applications; Commerce; Business; Finance; Marketing; Human Resource Management; General Management; Banking; Economics; Tourism Administration & Management; Education; Law; Library & Information Science; Defence & Strategic Studies; Electronic Science; Corporate Governance; Industrial Relations; and emerging paradigms in allied subjects like Accounting; Accounting Information Systems; Accounting Theory & Practice; Auditing; Behavioral Accounting; Behavioral Economics; Corporate Finance; Cost Accounting; Econometrics; Economic Development; Economic History; Financial Institutions & Markets; Financial Services; Fiscal Policy; Government & Non Profit Accounting; Industrial Organization; International Economics & Trade; International Finance; Macro Economics; Micro Economics; Rural Economics; Co-operation; Demography: Development Planning; Development Studies; Applied Economics; Development Economics; Business Economics; Monetary Policy; Public Policy Economics; Real Estate; Regional Economics; Political Science; Continuing Education; Labour Welfare; Philosophy; Psychology; Sociology; Tax Accounting; Advertising & Promotion Management; Management Information Systems (MIS); Business Law; Public Responsibility & Ethics; Communication; Direct Marketing; E-Commerce; Global Business; Health Care Administration; Labour Relations & Human Resource Management; Marketing Research; Marketing Theory & Applications; Non-Profit Organizations; Office Administration/Management; Operations Research/Statistics; Organizational Behavior & Theory; Organizational Development; Production/Operations; International Relations; Human Rights & Duties; Public Administration; Population Studies; Purchasing/Materials Management; Retailing; Sales/Selling; Services; Small Business Entrepreneurship; Strategic Management Policy; Technology/Innovation; Tourism & Hospitality; Transportation Distribution; Algorithms; Artificial Intelligence; Compilers & Translation; Computer Aided Design (CAD); Computer Aided Manufacturing; Computer Graphics; Computer Organization & Architecture; Database Structures & Systems; Discrete Structures; Internet; Management Information Systems; Modeling & Simulation; Neural Systems/Neural Networks; Numerical Analysis/Scientific Computing; Object Oriented Programming; Operating Systems; Programming Languages; Robotics; Symbolic & Formal Logic; Web Design and emerging paradigms in allied subjects.
Anybody can submit the soft copy of unpublished novel; original; empirical and high quality research work/manuscriptanytime in M.S. Word format
after preparing the same as per our GUIDELINES FOR SUBMISSION; at our email address i.e. [email protected] or online by clicking the link online
submission as given on our website (FOR ONLINE SUBMISSION, CLICK HERE).
GUIDELINES FOR SUBMISSION OF MANUSCRIPT
1. COVERING LETTER FOR SUBMISSION:
DATED: _____________
THE EDITOR
IJRCM
Subject: SUBMISSION OF MANUSCRIPT IN THE AREA OF .
(e.g. Finance/Mkt./HRM/General Mgt./Engineering/Economics/Computer/IT/ Education/Psychology/Law/Math/other, please specify)
DEAR SIR/MADAM
Please find my submission of manuscript entitled ‘___________________________________________’ for possible publication in one of your journals.
I hereby affirm that the contents of this manuscript are original. Furthermore, it has neither been published elsewhere in any language fully or partly, nor is it under review for publication elsewhere.
I affirm that all the co-authors of this manuscript have seen the submitted version of the manuscript and have agreed to their inclusion of names as co-authors.
Also, if my/our manuscript is accepted, I agree to comply with the formalities as given on the website of the journal. The Journal has discretion to publish our contribution in any of its journals.
NAME OF CORRESPONDING AUTHOR :
Designation :
Institution/College/University with full address & Pin Code :
Residential address with Pin Code :
Mobile Number (s) with country ISD code :
Is WhatsApp or Viber active on your above noted Mobile Number (Yes/No) :
Landline Number (s) with country ISD code :
E-mail Address :
VOLUME NO. 5 (2015), ISSUE NO. 07 (JULY) ISSN 2231-5756
INTERNATIONAL JOURNAL OF RESEARCH IN COMMERCE, IT & MANAGEMENT
NOTES:
a) The whole manuscript has to be in ONE MS WORD FILE only, which will start from the covering letter, inside the manuscript. pdf. version is liable to be rejected without any consideration.
b) The sender is required to mention the following in the SUBJECT COLUMNof the mail:
New Manuscript for Review in the area of (e.g. Finance/Marketing/HRM/General Mgt./Engineering/Economics/Computer/IT/ Education/Psychology/Law/Math/other, please specify)
c) There is no need to give any text in the body of mail, except the cases where the author wishes to give any specific message w.r.t. to the manuscript.
d) The total size of the file containing the manuscript is expected to be below 1000 KB.
e) Abstract alone will not be considered for review and the author is required to submit the complete manuscript in the first instance.
f) The journal gives acknowledgement w.r.t. the receipt of every email within twenty four hours and in case of non-receipt of
acknowledgment from the journal, w.r.t. the submission of manuscript, within two days of submission, the corresponding author is required to demand for the same by sending a separate mail to the journal.
g) The author (s) name or details should not appear anywhere on the body of the manuscript, except the covering letter and the cover page of the manuscript, in the manner as mentioned in the guidelines.
2. MANUSCRIPT TITLE: The title of the paper should be bold typed, centered and fully capitalised.
3. AUTHOR NAME (S) & AFFILIATIONS: Author (s) name, designation, affiliation (s), address, mobile/landline number (s), and email/alternate email address should be given underneath the title.
4. ACKNOWLEDGMENTS: Acknowledgements can be given to reviewers, guides, funding institutions, etc., if any.
5. ABSTRACT: Abstract should be in fully italicized text, ranging between 150 to 300 words. The abstract must be informative and explain the background, aims, methods, results & conclusion in a SINGLE PARA. Abbreviations must be mentioned in full.
6. KEYWORDS: Abstract must be followed by a list of keywords, subject to the maximum of five. These should be arranged in alphabetic order separated by commas and full stop at the end. All words of the keywords, including the first one should be in small letters, except special words e.g. name of the Countries, abbreviations.
7. JEL CODE: Provide the appropriate Journal of Economic Literature Classification System code (s). JEL codes are available at www.aeaweb.org/econlit/jelCodes.php, however, mentioning JEL Code is not mandatory.
8. MANUSCRIPT: Manuscript must be in BRITISH ENGLISH prepared on a standard A4 size PORTRAIT SETTING PAPER. It should be free from any errors i.e. grammatical, spelling or punctuation. It must be thoroughly edited at your end.
9. HEADINGS: All the headings must be bold-faced, aligned left and fully capitalised. Leave a blank line before each heading. 10. SUB-HEADINGS: All the sub-headings must be bold-faced, aligned left and fully capitalised.
11. MAIN TEXT:
THE MAIN TEXT SHOULD FOLLOW THE FOLLOWING SEQUENCE: INTRODUCTION
REVIEW OF LITERATURE
NEED/IMPORTANCE OF THE STUDY
STATEMENT OF THE PROBLEM OBJECTIVES
HYPOTHESIS (ES)
RESEARCH METHODOLOGY
RESULTS & DISCUSSION FINDINGS
RECOMMENDATIONS/SUGGESTIONS
CONCLUSIONS LIMITATIONS
SCOPE FOR FURTHER RESEARCH REFERENCES
APPENDIX/ANNEXURE
VOLUME NO. 5 (2015), ISSUE NO. 07 (JULY) ISSN 2231-5756
12. FIGURES & TABLES: These should be simple, crystal CLEAR, centered, separately numbered & self explained, and titles must be above the table/figure. Sources of data should be mentioned below the table/figure. It should be ensured that the tables/figures are referred to from the main text.
13. EQUATIONS/FORMULAE: These should be consecutively numbered in parenthesis, horizontally centered with equation/formulae number placed at the right. The equation editor provided with standard versions of Microsoft Word should be utilised. If any other equation editor is utilised, author must confirm that these equations may be viewed and edited in versions of Microsoft Office that does not have the editor.
14. ACRONYMS: These should not be used in the abstract. The use of acronyms is elsewhere is acceptable. Acronyms should be defined on its first use in each section: Reserve Bank of India (RBI). Acronyms should be redefined on first use in subsequent sections.
15. REFERENCES: The list of all references should be alphabetically arranged. The author (s) should mention only the actually utilised
references in the preparation of manuscript and they are supposed to follow Harvard Style of Referencing. Also check to make sure
that everything that you are including in the reference section is duly cited in the paper. The author (s) are supposed to follow the references as per the following:
All works cited in the text (including sources for tables and figures) should be listed alphabetically.
Use (ed.) for one editor, and (ed.s) for multiple editors.
When listing two or more works by one author, use --- (20xx), such as after Kohl (1997), use --- (2001), etc, in chronologically ascending order.
Indicate (opening and closing) page numbers for articles in journals and for chapters in books.
The title of books and journals should be in italics. Double quotation marks are used for titles of journal articles, book chapters, dissertations, reports, working papers, unpublished material, etc.
For titles in a language other than English, provide an English translation in parenthesis.
Headers, footers, endnotes and footnotes should not be used in the document. However, you can mention short notes to elucidate
some specific point, which may be placed in number orders after the references.
PLEASE USE THE FOLLOWING FOR STYLE AND PUNCTUATION IN REFERENCES:
BOOKS
Bowersox, Donald J., Closs, David J., (1996), "Logistical Management." Tata McGraw, Hill, New Delhi.
Hunker, H.L. and A.J. Wright (1963), "Factors of Industrial Location in Ohio" Ohio State University, Nigeria.
CONTRIBUTIONS TO BOOKS
Sharma T., Kwatra, G. (2008) Effectiveness of Social Advertising: A Study of Selected Campaigns, Corporate Social Responsibility, Edited by David Crowther & Nicholas Capaldi, Ashgate Research Companion to Corporate Social Responsibility, Chapter 15, pp 287-303.
JOURNAL AND OTHER ARTICLES
Schemenner, R.W., Huber, J.C. and Cook, R.L. (1987), "Geographic Differences and the Location of New Manufacturing Facilities," Journal of Urban Economics, Vol. 21, No. 1, pp. 83-104.
CONFERENCE PAPERS
Garg, Sambhav (2011): "Business Ethics" Paper presented at the Annual International Conference for the All India Management Association, New Delhi, India, 19–23
UNPUBLISHED DISSERTATIONS
Kumar S. (2011): "Customer Value: A Comparative Study of Rural and Urban Customers," Thesis, Kurukshetra University, Kurukshetra.
ONLINE RESOURCES
Always indicate the date that the source was accessed, as online resources are frequently updated or removed. WEBSITES
VOLUME NO. 5 (2015), ISSUE NO. 07 (JULY) ISSN 2231-5756
INTERNATIONAL JOURNAL OF RESEARCH IN COMMERCE, IT & MANAGEMENT
A STUDY ON CUSTOMER’S APPREHENSION TOWARDS MOBILE BANKING TECHNOLOGY
PADMAAVATHY.PA.
RESEARCH SCHOLAR
BHARATHIAR UNIVERSITY
COIMBATORE
DR. B. ADALARASU
DEAN
RVS FACULTY OF MANAGEMENT
KUMARANKOTTAM
ABSTRACT
Unlike traditional form of banking, mobile banking has emerged as more convenient and user friendly form of banking. Technology plays an important role in banking sector. Mobile phone is the common technology that becomes part of every individual in this information era. As India is the second largest telecom market in the world and have high potential for expanding banking services using mobile. Mobile banking focuses on customer requirement of anytime, anywhere banking concept into reality. Yet there are number of issues and threats in mobile banking system and the major problem is the non-adoption by the customers. For the research both primary and secondary data were used. The data was collected from 180 respondents from Coimbatore city in the month of November and December 2014. RBI guidelines for mobile banking in India, advantages of adopting this new technology both for the banking sector as well as the consumer and issues which needs to be addressed relating to this new form of banking. The paper also looks at various factors which explain why consumers are not using mobile banking and other technologies in banking. It would also try to how to overcome this problem and increase the acceptance levels. This paper examines consumer adoption of a new electronic payment service as mobile banking and the factors influencing the adoption of mobile banking in India.
KEYWORDS
Mobile Banking, Mobile Payments.
INTRODUCTION TO MOBILE BANKING
obile Banking can be described as a mechanism which allows customer of a financial institution to carry out various financial transactions with the help of their mobile phones. With the increasing use of smartphone Mobile Banking is catching up with the common customer. Mobile connectivity is vast and this makes Mobile Banking very successful.
Mobile Banking Service includes:- Mini statement, Monitoring of Term deposits., Ordering Cheque books, Balance checking in the account., Change of Pin., Blocking the lost ATM card., Fund Transfer, Mobile, DTH recharging, Purchasing ticket for a movie or travelling etc.
ADVANTAGES OF MOBILE BANKING
Mobile Banking uses the network of service provider and it doesn't need internet connection. In a developing countries like India where there is no internet
connection in the interiors, there is the presence of mobile connectivity.
Mobile Banking is available round the clock 24/7/365 and is easy and convenient mode for many mobile users in the rural areas.
Mobile Banking is said to be more secured and risk free than online/internet Banking.
With the help of Mobile Banking you can pay your bills, transfer funds, check account balance, review your recent transaction, block your ATM card etc.
Mobile Banking is cost effective and Banks offer this service at very low cost to the customers.
DISADVANTAGES OF MOBILE BANKING
Though the security threat is less than Internet Banking, One of the great threat to Mobile Banking is "Smishing" which is similar to "phishing". In "Smishing" users receives fake message asking for their Bank details. Many users have fallen into this trap.
Mobile Banking is not available on all mobile phones. Some time it requires you to install apps on your phone to use the Mobile Banking feature which is available on high end smartphone. If you don't have a smartphone than the use of Mobile Banking becomes limited. Transaction like transfer of funds is only available on high end phones.
Regular use of Mobile Banking may lead to extra charges levied by the bank for providing the services.
Mobile phones are limited in processing speeds, screen size and battery life. This acts as a barrier in mobile Banking.
INTRODUCTION TO THE STUDY
This study plans to plug the gap of research in the acceptance of mobile banking among the consumers. The primary objective of this study is to focus on the adoption of mobile banking services by consumers, identify factors influencing the adoption and usage of mobile banking in India.
The personal characteristics of mobile banking users were found to be important determinants of their adoption decisions. This finding provides the financial services industry with a better understanding of customer perceptions of mobile banking services and helps them plan their marketing strategies and promotion approaches for mobile banking services in the future.
OBJECTIVES OF THE STUDY
To study the pattern of how customers utilize the mobile banking services.
To analyze whether mobile banking is even more secure than online/internet banking.
To find out how mobile banking users are overcoming the risk of receiving fake SMS/ messages and scams or even loss of a person’s mobile.
LIMITATIONS OF THE STUDY
The study was restricted to private banks only.
As the study was restricted to Coimbatore District, generalization cannot be made.
This study pertains only to the time period of study.
VOLUME NO. 5 (2015), ISSUE NO. 07 (JULY) ISSN 2231-5756
SCOPE OF THE STUDY
The study is much relevant to today’s context. The study will be much useful for the researcher in gaining practical knowhow about the scenario that is prevalent among bankers and resources they offer. It also helps the researcher to understand the rudiments of a project of this nature and familiarize with a real time atmosphere.
RESEARCH METHODOLOGY
Research is the investigation of the underlying process operative in the lives of persons who are in association. The process used to collect information and data
for the purpose of making business decisions is said to be Research Methodology.
RESEARCH DESIGN
In this research, the researcher has chosen the research design to be descriptive in nature. Descriptive research is a study designed to depict the participants in an accurate way. Descriptive research is all about describing people who take part in the study.
SAMPLING TECHNIQUE
The sampling methodology used in this research is Simple Random sampling which is one of the Probability sampling methods. A subset of a statistical population in which each member of the subset has an equal probability of being chosen. A simple random sample is meant to be an unbiased representation of a group.
SAMPLE SIZE
There are 18 private sector banks in Coimbatore and the researcher has chosen 30% of 18 private sector banks i.e. 6 banks. Out of the 6 banks, 30 samples from each bank were surveyed, considering 30 as a large sample size. Hence, the sample size is 180 i.e (6 banks * 30samples = 180 sample size).
DATA COLLECTION METHOD
Data collection is a systematic approach to gather information from a variety of sources to get a complete and accurate picture of an area of interest. There are two types of data- Primary data and Secondary data. In this study, the researcher has used both types of data.
PRIMARY DATA
Primary data is the data collected by the investigator himself / herself for a specific purpose. It is the first hand information. In this research, the researcher framed a structured questionnaire to collect the data from the respondents.
SECONDARY DATA
Secondary data is the data collected by someone else for some other purpose. The researcher collected secondary data from various websites, journals, magazines and reports.
DATA ANALYSIS AND INTERPRETATION
TABLE NO. 1: AGE OF RESPONDENTS
AGE GROUP (in years) No. of Respondents Percentage ( %)
26-33 84 47
34-41 86 48
42-49 10 5
TOTAL 180 100
Inference
It is observed from the above table that, 48% of the respondents falls under the age group 34-41yrs, 47% of the respondents are in the age group 26-33yrs and the remaining 5% comes under 42-49 years as their age group.
Most of the mobile banking services are utilized by young and middle aged customers. This is because of their urge in using technology. It’s no surprise that the younger generations are keen users of mobile banking, considering the benefits it offers and the prevalence of smartphones among the age group.
TABLE NO. 2: OCCUPATION OF THE RESPONDENTS
OCCUPATION No.of Respondents Percentage(%)
EMPLOYED 83 46
PROFESSIONAL 90 50
BUSINESS 7 4
TOTAL 180 100
Inference
It is evident from the above data that 50% of the respondents are qualified professionals, followed by 46% are employed and rest 4% are having their occupation as business.
This means that usage of mobile is unavoidable irrespective of their occupation. When it comes to mobile banking, the range of services it offers is important. Customers are using their banking applications for a variety of tasks– from applying for loans, viewing their balance to making domestic transfers and paying bills. So, the usage is widespread in all occupations.
TABLE NO. 3: EDUCATIONAL BACKGROUND OF THE RESPONDENTS
EDUCATIONAL BACKGROUND No. of Respondents Percentage(%)
GRADUATE 145 81
POST GRADUATION 35 19
TOTAL 180 100
Inference
It is understandable from the above data that 81% of respondents are graduates and 19% are well educated as they are post graduates.
There appears to be a number of issues which prevent low-income, low-literate populations from meaningfully adopting and using existing m-banking services. Digital natives are most aware of how to protect themselves, but the high percentage of young people that would happily use mobile banking services over unprotected public Wi-Fi shows that might not be the case. Education and awareness around these issues will help protect them and keep them loyal
TABLE NO. 4: PATTERN OF CUSTOMERS’ UTILIZATION OF MOBILE BANKING SERVICES
Age group (in years) No of respondents Mean F- value p- value
26-33 84 60 7.708647 0.000258 *
34-41 86
42-49 10
VOLUME NO. 5 (2015), ISSUE NO. 07 (JULY) ISSN 2231-5756
INTERNATIONAL JOURNAL OF RESEARCH IN COMMERCE, IT & MANAGEMENT
H0- There is no significance difference between age group of the respondents and their pattern of using mobile banking services.
H1- There is significance difference between age group of the respondents and their pattern of using mobile banking services.
ANOVA: SINGLE FACTOR ANALYSIS
SUMMARY
Groups Count Sum Average Variance
Age group 3 473 157.666667 184.3333333
Pattern of usage 3 67 22.3333333 184.3333333
ANOVA
Source of Variation SS df MS F p-value F crit
Between Groups 27472.67 1 27472.6667 149.0379747 0.000258 7.708647
Within Groups 737.3333 4 184.333333
Total 28210 5
Inference
From the above analysis, we could infer that p-value (0.0002) is less than 0.05, which means that null hypothesis can be rejected at 5% level of significance. And it is concluded that there is significant difference in the age group of the respondents using the mobile banking services.
We found that people who use mobile banking tend to be younger, earn more and be more on top of their financial matters than non-mobile bankers. Our mobile bankers are more likely to read money blogs but also more prone to regularly buy something on impulse.
People who have been using mobile banking for longer are more likely than newer users to say the technology improved the way they manage money. It seems the positive change from mobile banking is better and better the longer it is used. As people use their mobiles, they have started using mobile banking services as well.
TABLE NO. 5: SECURITY ASPECT IN MOBILE BANKING SERVICES
Income ( in Rs) No of respondents Mean F- value p- value
>Rs10000 6 36 5.31765507 0.002017*
10001-20000 3
20001-30000 144
30001-40000 24
> Rs40000 3
Total 180
*p- value – 0.05 indicates level of significance
H0- There is no significance difference between income of the respondents and their attitude towards the security in using mobile banking services.
H1- There is significance difference between income of the respondents and their attitude towards the security in using mobile banking services.
ANOVA: SINGLE FACTOR ANALYSIS
SUMMARY
Groups Count Sum Average Variance
Income level 5 645 129 751
Security aspect 5 252 50.4 778.3
ANOVA
Source of Variation SS df MS F P-value F crit
Between Groups 15444.9 1 15444.9 20.198653 0.002017 5.31765507
Within Groups 6117.2 8 764.65
Total 21562.1 9
Inference
From the above analysis, we could infer that p-value (0.002) is less than 0.05, which means that null hypothesis can be rejected at 5% level of significance. And it is concluded that there is significant difference between income of the respondents and their attitude towards the security in using the mobile banking services. Security and cost of service have positive impact on the attitude. They are taking mobile banking service as they make secured financial transaction with low cost. Social influence also has influence on attitude towards usage. At often consumers get started to take mobile banking service because there family members or friends are using mobile banking service. Demographic factors age and socioeconomic class group of populations are found significantly different according to the attitude.
TABLE NO. 6: RISK ASPECT IN MOBILE BANKING SERVICES
Education No of respondents Mean F- value p- value
HIGH SCHOOL 1 36 7.7086474 0.00023064*
UNDERGRADUATE 6
GRADUATE 145
POST GRADUATION 28
ABOVE POST GRADUATION 0
Total 180
*p- value – 0.05 indicates level of significance
H0- There is no significance difference between educational background of the respondents and their ability in overcoming risks towards using mobile banking
services.
H1- There is significance difference between educational background of the respondents and their ability in overcoming risks towards using mobile banking
VOLUME NO. 5 (2015), ISSUE NO. 07 (JULY) ISSN 2231-5756
ANOVA: SINGLE FACTOR ANALYSIS
SUMMARY
Groups Count Sum Average Variance
Column 1 3 381 127 52
Column 2 3 159 53 52
ANOVA
Source of Variation SS df MS F p-value F crit
Between Groups 8214 1 8214 157.9615385 0.00023064 7.7086474
Within Groups 208 4 52
Total 8422 5
Inference
From the above analysis, we could infer that p-value (0.0002) is less than 0.05, which means that null hypothesis can be rejected at 5% level of significance. And it is concluded that there is significance difference between educational background of the respondents and their ability in overcoming risks towards using mobile banking services.
The concerns about reliability and security of mobile banking are considered to be the important issues. Banks need to produce advertisements and promotional materials that inform the users of the accuracy and reliability of mobile banking as a means to minimize the perceived risks.
Various factors which contribute to the customers’ perception such as convenience, flexible virtual banking system, reliability, time factor, real time access to information, saving transaction cost, on-line bill payments, digital signature for security, faster transfer, easy to use, user friendly, low transaction fees, anytime and anywhere banking facility are taken for this study.
FINDINGS
From the data, it is clear that 56% of the males are using mobile banking services to a large extent when compared to females which is only 44%. Financial
Services are generally complex and need a lot of trust for the consumer to use technology. Banks have changed from paper-based banking solutions provider to the latest of the technologies like online-banking, mobile-banking, etc.
From the data it is very clear that 80% of the respondents using mobile banking are in income level between Rs20001 - Rs.30000 and rest 20% are having
their income as between Rs.30001- Rs40000. As the Internet banking is still in its growing stage, mobile banking has emerged as the next advance way of doing banking.
96% of the Savings bank customers are using Mobile Banking services, because of the long queues in branches, customers have started using various
alternate channels. Since the pace of technology advancement is not matching with the adoption rate, problems will arise if this widened gap is not going to be filled up with suitable measures.
Technology-based electronic delivery medium does not constitute service offering and creates value alone, but service content has to function properly
and the way of usage has to be known. 85% of the respondents are not updating anti- virus software in their mobile, when using mobile banking,
From the data, we find that the percentage of respondents who change password are very less. The fact is that the risk and security are the most
considerable significant factors for banking service adoption, and particularly in relation to `new' electronic environment.
The majority of consumers who had a mobile phone but didn't use mobile banking said they had no need for such services or expressed security concerns.
Nonusers also were more likely to say that they believed mobile banking wasn't secure or they didn't know how secure the technology was.
The findings of our study identified the factors having significant contribution on the attitude towards user's usage of mobile banking. Availability of service
points has the greatest influence on usage of mobile banking. Nowadays consumers often prefer next-door mobile banking service points as traditional banks remain far away from their location.
A mobile banking app needs to be more than just checking a balance. Young people increasingly don’t want to visit branches in person, so banks need to
offer them the same services via their smartphone or tablet.
SUGGESTIONS TO IMPROVE MOBILE BANKING
Mobile banking services must be made simple so that download and authentication of mobile banking apps is easy to increase more usability.
Demo link for using mobile banking can be uploaded in the bank’s website, so that customers can have a look and try on the same.
Self-service counters such as e-lobby can be installed in branch premises and customers can try using the various alternate channels.
Social media such as facebook can be used to drive awareness and adoption of mobile banking services.
Emails as well as mobile alerts can be sent as remainders to customers regarding various offers/discounts, new product/ service launch in the bank.
In the Branch & ATM - on their flat screen TVs and posters inside local branches, the mobile banking services can be shown to create awareness. Branch
staff can also offer to show customers how to use mobile services on a phone or a tablet.
CONCLUSION
The study identified significant factors such as availability of service points, cost of service, social influence and security of service having positive influence on attitude toward the usage of mobile banking. Demographic factors viz age and socioeconomic class of user's are also found to impact significantly on attitude. Though middle, rich socioeconomic class and educated peoples are getting involved nowadays. More studies in developing countries may provide us knowledge how different factors influencing user’s attitude towards the usage of mobile is banking service.
The banking industry today is in the industry of its revolution. Information technology has basically been used under two different avenues in banking. One is communication and connectivity and other is business process. Banks have welcomed wireless and mobile technology into their boardroom to offer their customers the freedom to pay bills, planning payments while stuck in traffic jams, to receive updates on the various marketing efforts while present at a party to provide more personal and intimate relationships.
REFERENCES
1. Amir Herzberg. Payments And Banking With Mobile Personal Devices, Communications of the ACM, Vol. 46, No. 5, May 2003.
2. Banzal.S,MobileBanking & M–Commerce and Related issues,www. public.webfoundation.org / 25, Mobile_banking_M-commerce_15.03.pdf, 2010.
3. Barnes,S.J., and Corbitt, B. Mobile Banking: Concepts and Potential, International Journal of Mobile Communications, 1 (3), pp. 273-288, 2003.
4. Brown, Z. Cajee, D. Davies, and S. Stroebel. Cell phone banking: predictors of adoption in South Africa--an exploratory study, International Journal of
Information Management,Vol.23, pp. 381-394, Oct.2003.
5. C. Narendiran, S. Albert Rabara, and N. Rajendran., Public key infrastructure for mobile banking security, Global Mobile Congress 2009, pp. 1-6,2009.
6. Darlington, Richard B., Sharon Weinberg, and Herbert Walberg (1973). Canonical variate analysis and related techniques. Review of Educational Research,
VOLUME NO. 5 (2015), ISSUE NO. 07 (JULY) ISSN 2231-5756
INTERNATIONAL JOURNAL OF RESEARCH IN COMMERCE, IT & MANAGEMENT
TURNOVER ANALYSIS: A CASE STUDY OF AUTOMOBILE INDUSTRY IN INDIA
DR. M. VENKATA RAO
PRINCIPAL
RAJIV GANDHI INSTITUTE OF MANAGEMENT AND SCIENCE
THIMMA PURAM VILLEGE, KAKINADA,EASTGODAVARI –DT.
DR. K. KANAKA RAJU
ASST. PROFESSOR
DEPARTMENT OF MANAGEMENT STUDIES
ANDHRA UNIVERSITY CAMPUS
TADEPALLIGUDEM
ABSTRACT
The main objective of this paper is to test whether there is any significant difference from one automobile firm to another automobile firm regarding the various turnover ratios and offer a suitable suggestions to strengthen performance of automobile industry in India. The data obtained from the annual reports of the automobile firms from the year 2002-03 to 2011-12. The paired samples statistics applied to derive the required results. The study found that there was no significant difference from inventory ratio of TVS Motor Company to the inventory ratio of Tata Motors and also came to knew that there was no significant difference from realizing of cash from debtors from the Maruthi Suzuki to the Tata Motors Company. This study also identified from Mahindra & Mahindra to Maruthi Suzuki and from TVS Motor to Mahindra & Mahindra. And also total assets turnover ratio was not remarked significant difference from Ashok Layland to Tata Motors and from Ashok Layland to Maruthi Suzuki.
KEYWORDS
Inventory Turnover Ratio, Debtors Turnover Ratio, Fixed Assets, Turnover Ratio and Total Assets Turnover.
INTRODUCTION
lanning, Organizing and control of issues of inventory is called as the inventory management. Inventory consists of raw material, work-in-process and finished goods. The basic inputs are the raw materials, semi manufactured products are the work-in-process and completely manufactured products equilent to the finished goods. The basic motives of holding inventories are transaction motive, precautionary motive and speculative motive. Transaction motive implies the smooth production and sales operation. The precautionary motive refers to the safeguard against the risk of unforeseen changes in demand and supply forces. The speculative motive indicates to take benefit of price fluctuations. The main objective of inventory management is to maintain the optimum level of inventory. The management of inventory helps in forecasting quantity of inventory is required, enables to offer the right product at the right time which leads to customer satisfaction, increases the employees efficiency by impart a knowledge on them with the help of inventory management software and other tools. It also useful to place an optimum order through this estimating, controlling and management of inventory reduces the costs and increases the productivity and sales resulting in greater profitability. The techniques of inventory management is VED Analysis (Very Essential and Dormant),E.O.Q (Economic Order Quantity),ABC Analysis (Always Better Control) , JIT (Just in Time) and FSN (Fast moving, Slow moving and Non moving). in addition to the above ratios the following inventory control techniques were available, i.e., Activity – Based costing (ABC) is the process of costing system which focuses on activities performed to produce the product. In activity based costing classifies various inventory items into three different categories basing on the relationship with the different stages or parts of the production process. The most important items are classified as class A, intermediate classified as class B and remaining items classified as C. It measures the cost and performance of activities, resources and cost of objects which help to generate accurate information for management reporting and decision making. The economic order quantity helps in how much to order and when to place an order. The quantity for which order is placed when the stock reaches to the re-order level. It is called as economic order quantity when it is the quantity which is considered as the most economical to order. At which the total of ordering costs and carrying costs minimum, it is considered as an economic order quantity. At EOQ the ordering costs are equal to carrying costs the main objective of economic order quantity is to decide the “Order Size” which is considered most economical to order. The EOQ provides the information regarding how much inventory must be ordered at a specific point of time. The economic order quantity refers to determine the order size that will minimize the total of an order and carrying costs for an item of inventory. The re-order level is the level of inventory at which the new order for an item must be placed to acquire new supply. The lead time, usage rate of an item influence the reorder level. Safety stock is the minimum level of inventory which must be maintained by a firm to protect the firm from stock outs due to unexpected demand and lead time for the item. JIT is a modern approach and a firm keeps only enough inventories on hand to meet immediate production requirements. It reduces inventory carrying costs by acquiring that raw material that is to be used just in time to be placed in to production. Inventory management involves trade-off between risk and return. The risk means if the level of inventory is too low, there is a possibility of interrupted production process and various functions don’t operate independently. As the size of inventory rises, the costs of storage, carrying costs and other costs also increase, but the risk of running out of inventory decreases. The financial manager must evaluate inventory in terms of money value and the number of physical units.
HISTORY OF AUTOMOBILE IN THE WORLD
The automobile industry began in 1890’s and finally came of age with Henry Ford in 1914 for bulk production of cars. Initially it was dominated by the US automobile markets up to the second world war, because of it produced about 75 percent of world’s auto production. In 1980 the US was overtaken by Japan and became world’s leader again in 1994 and held this rank until 2009, when China took the top spot with 13.8 million units with 19.3 million units manufactured in 2012. The china occupied the first place, followed by the USA and Japan. Initially Indian auto industry concentrated on servicing, dealership, financing and maintenance of vehicles later only after a decade from independence manufacturing started in Indian. It contributes 22 percent of the country’s manufacturing gross domestic product and it is one of the biggest job creators and world’s third largest exporter of two wheelers.
The industry started grow from the year 1970 and the Government of India started the Delhi Auto Expo in 1986 to promote the auto industry. After the new industrial resolution policy 1991, foreign investors were invited in 12 large automotive companies, Maruti Udyog Ltd., General Motors India, Ford India Ltd., Eicher Motors, Bajaj Auto, Daewoo Motors India, Hero Motors, Hindustan Motors, Hyundai Motors India Ltd., Royal Enfield Motors, Telco, TVS Motors , Tata Motors, DCD Designs, Swaraj Mazda Ltd. The first automobile was launched in India in the year 1897 in Bombay. The industry is expected to grow to US $40billion by 2015, and it contribute 10 percent of the nations GDP by 2016 and expected to top in the world in car segment with approximately 611 million vehicles on the nations road by 2050.
VOLUME NO. 5 (2015), ISSUE NO. 07 (JULY) ISSN 2231-5756
HERO MOTO CORP
Hero cycles were founded in Ludhiana in the year 1956 and it became the largest bicycle manufacturer in India by 1975. It introduced motorcycles in 1980 with a slogan of “Fill it, shut it and forget it”. In the year 2012-13 the company captured 46 percent market share in two wheeler category with a revenue of 241.66 Rupees (US $3.9 billion). In August 2011, the company was renamed Hero Moto Corp with a new corporate identity. It made a rich contribution in the fields of sport and education as sense of corporate social responsibility.
TVS MOTORS
Launch a seven new bikes in a single day and third largest two wheeler manufacturer in India was established by T.V. Sundaram Iyengar, collaborated with Layton Dewande Holdings, United Kingdom in 1962 and received the Deming prize for Total Quality Management, as a first company in the world. The TVS Apache, TVS Victor, TVS Scooty, TVS Centra and TVS Fiero are the popular brand of bikes in the Indian Market. It started SST (Srinivasan Services Trust) in 1996 meant for the economic development, education, infrastructure, environment and healthcare of villagers and helps to make villages self reliant.
ASHOK LEYLAND
Leader in the Indian bus market, prominent manufactures, suppliers and exporters of wide collection of diesel generator sets started in the year 1948 in Madras
(Chennai). It is the second largest manufacturer of commercial vehicles in India, 4th Largest manufacturer of buses in the world and 16th largest manufacturers of
trucks globally and it received National Energy Conservation Awards (2012). LCV Cargo Carrier of the year award for Dorset (2012), Excellence in Technology Award for the Optare Versa EV”, and improve a quality of life of their employees through the medication, blood donation camps, broadly it focus on livelihood enhancement, health, education and environment.
TATA MOTORS
World’s 17th largest motor vehicle manufacturing company, the world first corporate sustainability label by C11 and best publicity traded companies in Asia –
Pacific, founded by Jahangir Ratanji Dadabhai Tata in 1945 as a leading Indian multinational automotive manufacturing company in Mumbai, Maharastra. It accredited with sustainable plus marque (Gold category), Star Performer award by EEPC (Indian Engineering Export Promotion Council).
MAHINDRA AND MAHINDRA
Enjoys a strong corporate brand image, customer centricity started on 2nd October 1945 consists of segments of automotive, farm equipment, infrastructure,
information technology, hospitality and financial services. It adopted the supply chain management to reducing carbon foot prints and focused on education, health, sports and culture.
MARUTI SUZUKI
It is not only one of the oldest but also as one of the biggest game players in the automotive industry. It was backs to 1981 and known as Maruti Udyog Limited (MUL) and 18.28 percent of its shares were under the ownership of the Indian Government, and its headquarters located in New Delhi. It started production in the year 1983 by producing of iconic Maruti 800 considered as the people’s car of India. It consists of Maruti Omni, Maruti Alto 800, Maruti Suzuki Eeco, Maruti Alto k10, Maruti Suzuki Wagon R. It bagged the best business standard company of the year 2010-11 and best value for money car of the year at auto car India Awards 2013, sustainability award by the CII, IITC. As a part of its corporate social responsibility initiatives Maruti Suzuki has taken significant steps in the area of road safety, skill development, community development and employee engagement programs through to being pioneers in the Indian automobile industry.
REVIEW OF LITERATURE
Niresh (2012) disclosed that, there was a negative relationship between Cash Conversion Cycle and performance measures and the current assets to total assets
ratio shows a weak positive relationship with the performance measures of return on assets and return on equity. The researchers mentioned that
manufacturing firms adopted conservative working capital management policy in Sri Lanka. Darabi & Toomari,( 2012) examined that there was a significant
positive relationship between cash conversion cycle and the competitiveness of the company; which means that a decrease in the cash conversion cycle results in a reduction in competitiveness due to decrease in number of days of accounting receivables, decrease of inventories days and increasing in number of days
of accounts payables. Afza & Nazir, (2011) used utilization index, performance index and total efficiency index to measure efficiency of working capital
management. They also tested the speed of achieving the target level of efficiency by an individual firm by using industry norms as the target level of efficiency.
Charitou etal, (2010) was also revealed there were significant relationship between the cash conversion cycle and days in inventory, days sales outstanding and
creditor payment period with the firm’s profitability. Bellouma (2009) concluded that a negative relationship identified between gross operating profitability
and the days of sales outstanding, the days of payable outstanding, the days of inventory outstanding and the cash conversion cycle. Mian Sajid Nazir & Talat
Afza (2009). Their result indicated that there is a negative relationship between the profitability measures of firms and degree of aggressiveness of working
capital investment and financing policies, but they found investors giving more value to those firms that are more aggressive in managing their current
liabilities.Ganesan (2007) found that the working capital management efficiency was negatively related to the liquidity and profitability. He suggested that the
manager can improve working capital efficiency by reducing days of working capital. In addition, he said that the management of days sales outstanding showed no significant effect on the return on assets and profit margin because of the heavy fixed asset requirements in telecommunication industry. It also had poor
management of accounts payable and accounts receivable. N.K. Agrawal (1983) concluded that although the working capital per rupee of sales showed a
declining trend over the years, but still a sufficient scope for reduction in investment appeared in almost all the segments of working capital.Misra (1975)
showed that the overstocking of inventory in regard to it’s each component, more cash as operational requirements and very low receivables turnover. The
result indicated that there is mismanagement of working capital in public sector in India.Swamy & V.G. Rao (1974) concluded that inventory and fixed
investment were found to be sensitive to variations in the availability of external funds. Borty (1973) highlighted the utility of Operating Cycle concept in the
determination of future cash requirements on the basis of estimated sales and costs of internal staff of the firm.
OBJECTIVES OF THE STUDY
The study carried with the following objectives:
1. To test whether there is any significant difference from one automobile firm to another automobile firm regarding inventory turnover ratio, debtors
turnover ratio, fixed assets turnover ratio and total assets turnover ratio.
2. To offer a suitable suggestions to strengthen the financial performance of automobile industry in India.
METHODOLOGY OF THE STUDY
VOLUME NO. 5 (2015), ISSUE NO. 07 (JULY) ISSN 2231-5756
INTERNATIONAL JOURNAL OF RESEARCH IN COMMERCE, IT & MANAGEMENT
INPUT TABLE 1: INVENTORY TURN OVER RATIO OF DIFFERENT FIRMS OF AUTO-MOBILE INDUSTRY FROM THE YEAR 2002-03 TO 2011-12
Year Hero MotoCorp TVS Motor Ashok Leyland Tata Motors Mahindra & Mahindra Maruti Suzuki
2002-03 25.51 12.73 6.85 10.20 8.39 15.52
2003-04 31.30 13.22 6.92 14.91 10.14 21.94
2004-05 36.57 12.69 7.59 14.06 8.92 16.90
2005-06 38.74 11.06 5.99 12.63 9.48 14.15
2006-07 36.25 11.86 6.93 13.26 11.75 21.27
2007-08 42.82 9.61 7.90 14.44 12.49 22.93
2008-09 47.53 13.31 5.36 13.47 14.56 30.46
2009-10 42.80 17.12 5.11 13.50 17.91 30.47
2010-11 43.88 13.27 5.86 13.86 15.64 33.33
2011-12 40.84 13.19 6.63 13.37 14.99 22.80
Source: Compiled from the Annual Reports
Input Table-1 : This table narrates the inventory turnover ratio of different firms of Automobile Industry. The higher ratio (47.53) represented from the year 2008-09 and lowest ratio (25.51)witnessed during 2002-03 regarding Hero Motor Corporation, Highest (17.12) and lowest (9.61) with reference to TVS Motor, lowest (5.11) and highest (7.90) regarding Ashok Layland, Highest (14.91) and lowest (10.20) from Tata Motors, highest (33.33) and lowest (15.52) from Maruthi Suzuki.
OUT PUT TABLE 1: PAIRED SAMPLES STATISTICS OF VARIOUS FIRMS OF AUTO MOBILE INDUSTRY
Mean N Std. Deviation Std. Error Mean
Pair 1 Hero Motor Corp 38.6240 10 6.51822 2.06124
Tvs Motor(Inventory Turnover Ratio) 12.8060 10 1.93149 .61079
Pair 2 Ashok Leyland 6.5140 10 .91580 .28960
Tata Motors 13.3700 10 1.28531 .40645
Pair 3 Mahindra & Mahindra 12.4270 10 3.24001 1.02458
Maruti Suzuki 22.9770 10 6.61480 2.09178
Pair 4 Mahindra & Mahindra 12.4270 10 3.24001 1.02458
Hero Motor Corp 38.6240 10 6.51822 2.06124
Pair 5 Hero Motor Corp 38.6240 10 6.51822 2.06124
Maruti Suzuki 22.9770 10 6.61480 2.09178
Pair 6 Tvs Motor(Inventory Turnover Ratio) 12.8060 10 1.93149 .61079
Tata Motors 13.3700 10 1.28531 .40645
Pair 7 Mahindra & Mahindra 12.4270 10 3.24001 1.02458
Ashok Leyland 6.5140 10 .91580 .28960
Pair 8 Maruti Suzuki 22.9770 10 6.61480 2.09178
Hero Motor Corp 38.6240 10 6.51822 2.06124
Source: SPSS
Output Table-1 : The above table furnishes the information regarding paired samples statistics of different firms of automobile industry. The higher value of mean implies the higher inventory turnover ratio, the lower value of mean implies the lower inventory turnover ratio. The Hero Motor Corp turnover ratio was higher than TVS Motor, Tata Motors exceeds Ashok Layland, Maruthi Suzuki exceeds the Mahindra & Mahindra, Hero Motor Corp exceeds the Mahindra & Mahindra as well as Maruthi Suzuki, and Mahindra & Mahindra exceeds Ashok Layland. Finally it can be concluded that the higher inventory ratio was holding by the Hero Motor Corporation, followed by the Maruthi Suzuki and least ratio represented from Ashok Layland.
OUT PUT TABLE 2: PAIRED SAMPLES TEST OF VARIOUS FIRMS OF AUTO MOBILE INDUSTRY
Paired Differences t df Sig.
(2-tailed)
Mean Std. Deviation Std. Error Mean 95% Confidence Interval of the
Difference
Lower Upper
Pair 1 Hero Motor Corp - Tvs Motor(Inventory Turnover Ratio)
2.58180E1 6.58873 2.08354 21.10471 30.53129 12.391 9 .000
Pair 2 Ashok Leyland - Tata Motors -6.85600 1.46811 .46426 -7.90622 -5.80578 -14.768 9 .000
Pair 3 Mahindra & Mahindra - Maruti Suzuki -1.05500E1 4.03679 1.27654 -13.43774 -7.66226 -8.264 9 .000
Pair 4 Mahindra & Mahindra - Hero Motor Corp -2.61970E1 4.60789 1.45714 -29.49329 -22.90071 -17.978 9 .000
Pair 5 Hero Motor Corp - Maruti Suzuki 1.56470E1 5.06481 1.60163 12.02385 19.27015 9.769 9 .000
Pair 6 Tvs Motor(Inventory Turnover Ratio) - Tata Motors
-.56400 2.33850 .73950 -2.23686 1.10886 -.763 9 .465
Pair 7 Mahindra & Mahindra - Ashok Leyland 5.91300 3.87831 1.22643 3.13862 8.68738 4.821 9 .001
Pair 8 Maruti Suzuki - Hero Motor Corp -1.56470E1 5.06481 1.60163 -19.27015 -12.02385 -9.769 9 .000
Source: SPSS
Output Table-2 : This table shows the paired samples test of different firms of Automobile Industry regarding turnover ratio.
Null Hypothesis (H01) : There is no significant difference from inventory ratio of Hero Motor Corporation to inventory ratio of Hero Motor Corporation to
inventory ratio of TVS Motor.
Alternative Hypothesis (Ha1) : There is a significant difference from inventory ratio of Hero Motor Corporation to inventory ratio of TVS Motor.
VOLUME NO. 5 (2015), ISSUE NO. 07 (JULY) ISSN 2231-5756
Null Hypothesis (H02) : There is no significant difference from inventory ratio of Ashok Layland to inventory ratio of Tata Motors.
Alternative Hypothesis (Ha2) : There is a significant difference from inventory ratio of Ashok Layland to inventory ratio of Tata Motors.
Analysis : The value of mean was -6.856 and value of t was -14.768 at df was 9, significant value was 0.000, hence it can be concluded that proposed null hypothesis was rejected and alternative hypothesis was accepted and confirmed that there was a significant difference between inventory ratio of Ashok Layland to Tata Motors.
Null Hypothesis (Ho3) : There is no significant difference from inventory ratio of Mahindra & Mahindra to inventory ratio of Maruthi Suzuki.
Alternative Hypothesis (Ha3) : There is a significant difference from inventory ratio of Mahindra & Mahindra to inventory ratio of Maruthi Suzuki.
Analysis : The value of mean was -1.055 at t value was -8.264 at df was 9 significant value was 0.000, hence it was witnessed that proposed null hypothesis was not accepted and inferred that there was a significant difference between inventory ratio of Mahindra & Mahindra and inventory ratio of Maruthi Suzuki.
Null Hypothesis (H04) : There is no significant difference between inventory ratio of Mahindra & Mahindra to Hero Motor Corporation.
Alternative Hypothesis (Ha4) : There is a significant difference between inventory ratio of Mahindra & Mahindra to Hero Motor Corporation.
Analysis : The value of t was -17.978 at df was 9, P value was 0.000, hence it was observed that proposed null hypothesis was rejected and alternative hypothesis was accepted and confirmed that there was a significant difference from the inventory ratio of Mahindra & Mahindra to the inventory ratio of Hero Motor Corporation.
Null Hypothesis (H05) : There is no significant difference between inventory turnover ratio of Hero Motor Corporation to inventory turnover ratio of Marthi
Suzuki.
Alternative Hypothesis (Ha5) : There is a significant difference between inventory turnover ratio of Hero Motor Corporation to inventory turnover ratio of Marthi
Suzuki.
Analysis: The value of mean was 1.564 and value of t was 9.769 at df was 9, P value was 0.000, hence it confirmed that the proposed null hypothesis was rejected and alternative hypothesis was accepted and concluded that there was a significant difference from the inventory ratio of Hero Motor Corporation to inventory ratio of Maruthi Suzuki.
Null Hypothesis (H06) : There is no significant difference from inventory ratio of TVS Motor to the inventory turnover ratio of Tata Motors.
Alternative Hypothesis (Ha6) : There is a significant difference from inventory ratio of TVS Motor to the inventory ratio of Tata Motors.
Analysis : The value of mean was -0.564 and with t value was -0.763 at df was 9, P value was 0.465, hence it can be concluded that the proposed null hypothesis was accepted and came to knew that there was no significant difference from inventory ratio of TVS Motor Company to the inventory ratio of Tata Motors Company.
Null Hypothesis (H07) : There is no significant difference from the inventory ratio of Mahindra & Mahindra to the inventory ratio of Ashok Layland.
Alternative Hypothesis (Ha7) : There is a significant difference from the inventory ratio of Mahindra & Mahindra to the inventory ratio of Ashok Layland.
Analysis : The value of mean was 5.91 and t value was 4.821 at df was 9, P value was 0.001, and confirmed that the proposed null hypothesis was rejected and alternative hypothesis was accepted and came to knew that there was a significant difference from the inventory ratio of Mahindra & Mahindra to the inventory ratio of Ashok Layland.
Null Hypothesis (H08) : There is no significant difference from the inventory ratio of Maruthi Suzuki to the inventory ratio of Hero Motor Corporation.
Alternative Hypothesis (Ha8) : There is a significant difference from inventory ratio of Maruthi Suzuki to the inventory ratio of Hero Motor Corporation.
Analysis : The value of mean was -1.564 and t value was -9.769 at df was 9 with a significant value was 0.000, hence it was confirmed that the proposed null hypothesis was rejected and alternative hypothesis was accepted and concluded that there was a significant difference from the inventory ratio of Maruthi Suzuki to the inventory ratio of Hero Motor Corporation.
INPUT TABLE 2: DEBTORS TURN OVER RATIO OF DIFFERENT FIRMS OF AUTO-MOBILE INDUSTRY FROM THE YEAR 2002-03 TO 2011-12
Year Hero MotoCorp TVS Motor Ashok Leyland Tata Motors Mahindra & Mahindra Maruti Suzuki
2002-03 42.32 38.99 5.47 10.23 6.38 9.79
2003-04 63.02 54.18 7.49 16.69 10.75 13.89
2004-05 111.41 66.53 9.88 24.12 14.46 17.14
2005-06 70.26 69.76 12.14 26.31 14.16 19.45
2006-07 40.11 45.46 15.54 35.60 14.82 21.12
2007-08 32.70 32.31 17.74 30.08 13.26 25.76
2008-09 55.10 27.25 9.25 19.11 12.77 26.33
2009-10 122.63 21.71 7.51 17.92 16.09 33.92
2010-11 162.08 25.17 10.34 19.20 17.97 42.93
2011-12 117.09 28.24 11.02 20.42 19.05 38.84
Source: Compiled from the Annual Reports
VOLUME NO. 5 (2015), ISSUE NO. 07 (JULY) ISSN 2231-5756
INTERNATIONAL JOURNAL OF RESEARCH IN COMMERCE, IT & MANAGEMENT
OUT PUT TABLE 3: PAIRED SAMPLES STATISTICS OF VARIOUS FIRMS OF AUTO MOBILE INDUSTRY
Mean N Std. Deviation Std. Error Mean
Pair 1 Hero Motor Corp 81.6720 10 43.64023 13.80025
Tvs Motor(Inventory Turnover Ratio) 40.9600 10 17.40573 5.50418
Pair 2 Ashok Leyland 10.6380 10 3.73961 1.18257
Tata Motors 21.9680 10 7.26766 2.29824
Pair 3 Mahindra & Mahindra 13.9710 10 3.60894 1.14125
Maruti Suzuki 24.9170 10 10.83865 3.42748
Pair 4 Ashok Leyland 10.6380 10 3.73961 1.18257
Hero Motor Corp 81.6720 10 43.64023 13.80025
Pair 5 Mahindra & Mahindra 13.9710 10 3.60894 1.14125
Tvs Motor(Inventory Turnover Ratio) 40.9600 10 17.40573 5.50418
Pair 6 Maruti Suzuki 24.9170 10 10.83865 3.42748
Ashok Leyland 10.6380 10 3.73961 1.18257
Pair 7 Maruti Suzuki 24.9170 10 10.83865 3.42748
Tata Motors 21.9680 10 7.26766 2.29824
Source: SPSS
Output Table-3 : This table reflects the paired samples statistics of various firms of automobile industry regarding debtors turnover ratio. The more number of days required to recover the cash from debtors of the Hero Motor Corporation than the TVS Motor as well as Ashok Layland. Ashok layland realized cash earlier than the Tata Motors, Mahindra & Mahindra than Maruthi Suzuki, Ashok Layland than Hero Motor Corporation, Mahindra & Mahindra than TVS Motor, Ashok Layland than Maruthi Suzuki, Tata Motors than Maruthi Suzuki. Finally it can be concluded the least number of days required to recover the cash from debtors regarding Ashok Layland followed by TVS Motor, Tata Motors, Maruthi Suzuki and Hero Motor Corporation.
OUT PUT TABLE 4: PAIRED SAMPLES TEST OF VARIOUS FIRMS OF AUTO MOBILE INDUSTRY
Paired Differences t df Sig.
(2-tailed)
Mean Std.
Deviation
Std. Error Mean
95% Confidence Interval of the Difference
Lower Upper
Pair 1 Hero Motor Corp - Tvs Motor(Inventory Turnover Ratio) 4.07120E1 50.72469 16.04055 4.42575 76.99825 2.538 9 .032
Pair 2 Ashok Leyland - Tata Motors -1.13300E1 4.14061 1.30937 -14.29201 -8.36799 -8.653 9 .000
Pair 3 Mahindra & Mahindra - Maruti Suzuki -1.09460E1 7.96432 2.51854 -16.64333 -5.24867 -4.346 9 .002
Pair 4 Ashok Leyland - Hero Motor Corp -7.10340E1 44.87969 14.19221 -103.13900 -38.92900 -5.005 9 .001
Pair 5 Mahindra & Mahindra - Tvs Motor(Inventory Turnover Ratio) -2.69890E1 18.70063 5.91366 -40.36663 -13.61137 -4.564 9 .001
Pair 6 Maruti Suzuki - Ashok Leyland 1.42790E1 10.78888 3.41174 6.56110 21.99690 4.185 9 .002
Pair 7 Maruti Suzuki - Tata Motors 2.94900 12.71796 4.02177 -6.14888 12.04688 .733 9 .482
Source: SPSS
Output Table-4 : This table reveals that paired samples test of various firms of automobile industry regarding debtors turnover ratio. This table reflects that there was significant difference from one firm to another firm regarding the debtors turnover ratio except the firms Maruthi Suzuki and Tata Motors regarding these firms there was no significant difference between each other with reference to the debtors turnover ratio.
INPUT TABLE 3: FIXED ASSETS TURN OVER RATIO OF DIFFERENT (FIRMS OF AUTO-MOBILE INDUSTRY FROM THE YEAR 2002-03 TO 2011-12)
Year Hero MotoCorp TVS Motor Ashok Leyland Tata Motors Mahindra & Mahindra Maruti Suzuki
2002-03 10.41 5.57 2.94 1.53 2.50 3.10
2003-04 11.23 4.58 3.93 2.18 3.49 4.53
2004-05 12.32 3.91 4.80 2.62 4.66 5.78
2005-06 11.41 2.35 5.40 2.55 5.44 6.59
2006-07 9.54 2.60 5.43 3.08 5.88 6.32
2007-08 5.89 1.80 2.77 2.69 3.22 2.48
2008-09 5.34 1.97 1.26 1.88 2.84 2.38
2009-10 6.29 2.29 1.25 1.95 3.85 2.82
2010-11 3.70 3.13 1.73 2.22 4.08 3.13
2011-12 4.05 3.34 1.98 2.65 4.32 2.46
Source: Compiled from the Annual Reports
VOLUME NO. 5 (2015), ISSUE NO. 07 (JULY) ISSN 2231-5756
OUT PUT TABLE -5: PAIRED SAMPLES STATISTICS OF VARIOUS FIRMS OF AUTO MOBILE INDUSTRY
Mean N Std. Deviation Std. Error Mean
Pair 1 Hero Motor Corp(Fixed Assets Turnover) 8.0180 10 3.29046 1.04053
Tvs Motor 3.1540 10 1.22076 .38604
Pair 2 Ashok Leyland 3.1490 10 1.64478 .52012
Tata Motors 2.3350 10 .46527 .14713
Pair 3 Mahindra & Mahindra 4.0280 10 1.08685 .34369
Maruti Suzuki 3.9590 10 1.69275 .53530
Pair 4 Maruti Suzuki 3.9590 10 1.69275 .53530
Hero Motor Corp(Fixed Assets Turnover) 8.0180 10 3.29046 1.04053
Pair 5 Mahindra & Mahind