A b s t r a c t.Cetane number is an important parameter in evaluating the quality of biodiesel fuel. Its determination is usually arduous and expensive, and the results obtained are not always accurate due to experimental error. This work is aimed at deve-loping a relationship between the fatty acid methyl ester (FAME) composition and the cetane number (CN).
Data were collected from the literature on the cetane number of various biodiesel fuels and their FAME composition. A regres-sion analysis was performed on pure FAME to establish a rela-tionship between the cetane number and FAME composition.
An equation was developed relating the cetane number with the % composition by weight of FAME of biodiesel fuel. The pre-dicted cetane number values compare well with the average measured cetane number values. This work establishes the general dependence of cetane number on FAME composition of biodiesels. K e y w o r d s: cetane number, biodiesel, FAME composition, regression analysis, prediction
INTRODUCTION
Emissions of hazardous gases from the exhausts of heavy duty vehicles have increased tremendously over the years. This has resulted in intense air pollution, identified to be one of the reasons for climatic changes that result in frequent heavy rains, hurricanes and floods threatening lives and properties. There is a need to reduce carbon-dioxide and other hazardous emissions to the atmosphere in internal combustion engines to decrease air pollution. Added to this is the questto reduce dependence on petroleum products as a result of the fast depletion of crude oil resources and instability in its price. This has shifted the focus on sourcing for an alternative energy from other materials than petro-leum products.
Pure vegetable oils have been considered as alternatives for diesel fuel, but the high viscosity at room temperature made them unsuitable for diesel engines. However, fatty acid methyl ester (FAME) have lower viscosity than the pure oils, and as such are promising alternatives. While the focus has been mostly on oils like soybean, rapeseed, and sunflower (Langet al., 2001), which are essentially edible in nature, biodiesel has also been produced from non-edible sources such as used frying oil and greases (Alcantaraet al., 2000; Canakci and Gerpen, 2001; Mittelbachet al., 1992).
Attempts have been made by various researchers to determine the best composition of biodiesel that would enhance the combustion process. It was observed that the fuel properties of biodiesel play a significant role in the combustion process. One of such properties is the influence of the Cetane Number (CN) on the combustion process and on engine performance. The CN is a commonly used indica-tor for the determination of diesel fuel quality, especially the ignition quality. It measures the readiness of the fuel to auto-ignite when injected into the engine. Ignition quality is one of the properties of biodiesel that is determined by the structure of the FAME component (Knothe, 2005).
The nature of the fuel components determines the fuel properties. One of those in this case is the structure of the FAME comprised in biodiesel. The CN of biodiesel depends on the distribution of fatty acids in the original oil or fat from which it was produced. The major factor affecting FAME profiles is the plant itself and variation will occur, depending on climate and processing methods (Michael and Robert, 1998; Fangrui and Milford, 1999). However, under proper conditions, the fatty acid profile should remain largely unchanged during processing. Van Gerpen (1996) in his
Prediction of cetane number of biodiesel fuel from the fatty acid methyl ester
(FAME) composition
A.I. Bamgboye
1* and A.C. Hansen
21
Department of Agricultural and Environmental Engineering, University of Ibadan, Nigeria 2
Department of Agricultural and Biological Engineering, University of Illinois, Urbana-Champaign, USA Received December 6, 2007; accepted January 31, 2008
© 2008 Institute of Agrophysics, Polish Academy of Sciences *Corresponding author’s e-mail: isaac.bamgboye@mail.ui.edu.ng
A A
Agggrrroooppphhyhyysssiiicccsss
work on CN testing of biodiesels observed that CN of va-rious level of FAME composition of soybean depends on the distribution of fatty acids in the original oil or fat. The longer the fatty acid carbon chains and the more saturated the molecules, the higher the CN (Geller and Goodrum, 2004). A high value of CN was observed in saturated FAME such as palmitate and stearate, while the CN is in the medium range in mono-unsaturated FAME. This is due to increasing number of double bonds, and the branching in the chain, causing lower CN values. The CN decreases with increasing unsaturation and increases with increasing chain length.
A wide variation in the values of the CN for biodiesel has been reported (Table 1). The values of CN of soybean oil-derived biodiesel ranged from 45 to 60, while those of rapeseed oil-derived biofuel ranged from 48 to 61.2. The CN value varies from feedstock to feedstock, depending gene-rally on the chemical composition of the fuel, and can affect the engine ability to start, the noise level, and the exhaust emissions. It has been observed that feedstock of the same type of oil do vary in CN, though much less than the diffe-rence between oil sources (Van Gerpen, 1996). A consi-derable variation in the CN values from different labora-tories was observed, and even between duplicate samples of the same laboratory.
The test procedure of CN has been subjected to criticism based on the differences between the cetane test engine con-figuration and operating conditions, and the concon-figurations
and operating conditions of modern engines. The CN test procedure is complex and inherently involves considerable uncertainty due to experimental error. It is not always easy conducting engine tests to determine CN due to the cost of the reference fuels and the effort required.
Cetane number is measured using blends of two refe-rence fuels, namelyn-cetane (100 CN) and hepta methylno-nane (15 CN). Cetane number of the test fuel is the percen-tage by volume ofn-cetane in a blend ofn-cetane (100 CN) and hepta methylnonane (15 CN) having the same ignition quality when tested in the same engine under the same test conditions (ASTM, 2004).
One of the ways of solving the problem of CN deter-mination is to develop models to predict the CN when some parameters are known. Since it has been established that the composition of FAME affects CN, models can be developed relating CN to the composition of FAME. Ramadhaset al. (2006) used artificial neural network (ANN) models to predict the CN of some fuels based on their FAME composi-tion. The FAME composition of biodiesel and the experi-mental CN values were used to train the networks. The fatty acid composition, in percentage of various esters in pure form as well as mixtures of esters (biodiesel) and their experimental CN, are taken into account for developing the present model (Ramadhas et al., 2006). A computer code was developed in MATLAB to implement the present ANN models. Four types of networks have been chosen to predict
SME* RME SUNME CME PME POME LME TME CAME
45.0 [1]** 46.2 [2] 54.7 [3] 45.0 [4] 54.8 [5] 60.0 [6] 51.9 [7] 48.6 [7] 45.0 [8] 51.0 [9] 47.2 [10] 52.0 [11] 56.4 [12] 47.3 [13] 59.0 [13]
51.9 [14] 54.4 [15] 49.9 [16] 54.5 [17] 54-65 [18]
53.0 [9] 51-59 [19]
51.0 [20] 59.7 [21] 44-48 [22]
53.3 [28]
-61.2 [19] 50.0 [9] 58.0 [23] 58.0 [24] 49.0 [8]
-52.0 [9] 45-55 [25]
-54.0 [4] 54.0 [8]
-59-70 [28] 62.0 [8] 62.4 [26] 58.3 [27] 62.0 [28]
-63.6 [10]
-58.0 [37] 62.9 [13] 64.8 [13]
-53.9 [13] 55.0 [13]
-*SME – soybean methyl ester, RME – rapeseed methyl ester, SUNME – sunflower methyl ester, CME – cottonseed methyl ester, PME – pea-nut methyl ester, POME – palm oil methyl ester, LME – lard methyl ester, TME – tallow methyl ester, CAME – canola methyl ester. **The numbers in the parenthesis represent the different authors from which the cetane numbers were sourced from literatures for this work: 1. Reed, 1993; 2. Wagneret al., 1984; 3. McDonaldet al.,1995; 4.Pischingeret al.,1982; 5. Petersonet al.,1994; 6. Sharp, 1994; 7. Midwest Biofuels, 1993; 8. Marchettiet al., (in press); 9. Rakopouloset al.,2006; 10. McCormick, 2001; 11. Van Gerpenet al.,2004; 12. Wanget al., 2000; 13. Kinast, 2003; 14. Gragg, 1994; 15. Petersonet al.,1993; 16. Mittlebachet al.,1985; 17. Reece and Peterson, 1993; 18. Vellguth, 1983; 19. Takesawa, 1993; 20. Labeckas and Slavinskas, 2006a; 21. Khan, 2002; 22. Labeckas and Slavinskas, 2006b, 23. Arkoudeaset al.,2003; 24. Kalligeroset. al., 2003; 25. Altinet al., 2001; 26. Lianget al., 2006; 27. Schwabet al., 2000, and 28. Knothe, 2005.
the CN of biodiesel. These are the multi-layer feed forward (MLFFN), radial base function (RBFN), generalized regression (GRNN) and recurrent network (RNN). The predicted CN of biodiesel is comparable to that of actual CN of the biodiesel, and it has been concluded that the CN of biodiesel can be predic-ted based on FAME composition. However, there is no empiri-cal equation for predicting the CN. There is, therefore, a need for an empirical equation for estimating the CN.
The focus of this work was to developthe regression equations for predicting the CN of biodiesel based on the FAME chain compositions, and to verify the applicability of the developed equations for predicting the CN based on the FAME composition of the vegetable oil used for biodiesel production.
MATERIALS AND METHODS
Selection of fuel data
FAME compositions of vegetable oil and CN of pure methyl esters were obtained from different reports from testing laboratories using ASTM D 613 as shown in Tables 2 and 3. Average values of the data collected for CN of pure methyl esters (Table 3) were used in this work.
Regression analysis
A nine by eight matrix was formed with CN as the dependent variable and the pure FAME composition as the independent variables as shown in Table 4.A linear regres-sion analysis was performed on the average values of cetane number data of the pure FAME (Tables 2 and 4).
The regression equation used was as follows:
CN= K + ax1+ bx2+ cx3+ dx4+ ex5+ fx6+gx7+ hx8 ,(1)
where: CN – cetane number; K, a, b, c, d, e, f, g, h are constants to be determined in the regression analysis; x1……x8are % compositions of FAME.
RESULTS AND DISCUSSION
Substituting the values of K, a – h in Eq. (1) for the coefficients obtained during regression analysis we obtain:
CN = 61.1 + 0.088x2+ 0.133x3+ 0.152x4– 0.101x5
– 0.039x6– 0.243x7– 0.395x8. (2)
Equation (2) shows the relationship between the CN and the FAME composition. From the equation, it is observed that the coefficient for the saturated FAME is positive and increases with an increase in the carbon number from C12:0 to C16:0. This suggests an increase in the CN number with an increase in the composition of the saturated FAME. How-ever, the coefficient of the unsaturated FAME is negative, showing a reduction in the overall CN with unsaturation and
further reduces with increase in the number of carbon and unsaturation. This equation is in agreement with the findings of other authors that saturated compounds have higher CN than the unsaturated compounds (Gragg, 1994; Van Gerpen, 1996). The same trend is observed in Table 2 for pure methyl esters. This indicates that FAME composition will play a do-minant role in establishing the CN.
The results of the prediction of CN values on the basis of the test data as shown in Fig. 3indicated that the equation developed was able to predict the CN accurately. The equation developed was applied to other results obtained by different researchers. The results obtained gave an indica-tion of variaindica-tion of the CN depending on the % composiindica-tion
Fuel numberCetane Reference
Caprylic acid methyl ester
18.0 Freedman and Bagby, 1990 33.6 Knothe, 2005
47.9 Freedman and Bagby, 1990 47.2 Knothe, 2005
Lauric acid methyl ester
60.8 Freedman and Bagby, 1990 61.4 Knothe, 2005
61.4 McCormicket al., 2001 Myristic acid
methyl ester
73.5 Freedman and Bagby, 1990 66.2 Knothe, 2005
Palmitic acid methyl ester
74.3 Freedman and Bagby, 1990 74.5 Knothe, 2005
Stearic acid methyl ester
75.6 Freedman and Bagby, 1990 86.9 Knothe, 2005
Palmitoleic acid methyl ester
51.0 McCormicket al., 2001
Oleic acid methyl ester
55.0 Knotheet al., 1997 59.3 McCormicket al., 2001 56.0 McCormicket al., 2001
Linoleic acid methyl ester
41.7 McCormicket al., 2001 42.2 Knotheet al., 1997 38.0 McCormicket al., 2001 22.7 Knotheet al., 1997 20.4 Knotheet al., 1997 45.9 McCormicket al., 2001
Ref.** Lauric Myristic Palmitic Stearic Palmitoleic Oleic Linoleic Linolenic SME* [1] [2] [3] [4] [5] [6] [7] [8] [9] [10] [11] 0.1 0 0 0 0 0 0 0 0 0 0 0.1 0 0 0 0.56 0 0 0 0 0.1 0.9 10.2 12.9 10.76 10.5 14.17 10.7 3.86 11.75 10.4 10.3 10.54 3.7 3.7 4.37 3.9 5.19 3.2 3.9 3.15 4.7 4.7 3.75 0 0.1 0 0 1.27 0 0 0 0.35 0 1.3 22.8 22.2 24.13 23.3 48.2 25 77.9 23.26 24.8 22.6 23.18 53.7 52.9 51.83 53 22.19 53.3 13.31 55.53 52.5 54.1 48.92 8.6 7.9 6.81 7.6 1.45 5.4 0 6.31 6.5 0.6 1.16 CAME
[12] 0 0 6.8 3.26 0 16.93 73.73 0
SUME [8] [4] [9] [12] [16] [6] 0 0 0 0 0 0 0 0 0 0 0 0 5.79 6.1 6.06 6.38 8.6 6.1 5.68 4.1 4.8 4.09 1.93 4.2 0 0 0 0 0 0 20.43 18.6 20.5 23.68 11.58 24 66.02 69 67.7 63.29 77.89 63.5 0 0.3 0.4 0.36 0 0.4 POME [16] [13] [4] [17] [17] [9] [14] [10] [6] 0.1 0 0.3 0.26 0.38 0.2 0.46 0.9 0 1 0 1.1 1.09 0.98 1.11 1.22 1.3 0 42.8 42.6 42.7 44.81 43.32 40.2 47.9 43.9 39.5 4.5 4.4 4.3 4.09 3.81 4.5 4.23 4.9 4.1 0 0.3 0 0.2 0.2 0.42 0.04 0 0 40.5 40.5 40.9 39.99 40.57 43.3 37 39 43.2 10.1 10.1 9.2 8.94 10.25 9 9.07 9.5 10.6 0.2 0.2 0.2 0.27 0.25 1 0.26 0.3 0.2 TME [16] [10] [4] [4] [11] 0.1 0.1 0.1 0 0.6 2.8 0.1 2.3 0 2.91 23.3 25.2 23.1 23.9 24.34 19.4 19.2 15.4 17.5 19.1 0 0 0 0 3.44 42.4 48.9 45.8 43.9 40.23 2.9 2.7 3.5 2.3 2.58 0.9 0.5 0.6 0.1 3.3 CME [16] [13] [8] [16] [9] [10] 0.1 0 0 0 0 0 0.7 0 0 0 1.2 0 20.1 28.7 11.67 28.33 20.6 22.9 2.6 0.9 0.89 0.9 4.6 3.1 0 0 0 0 0.8 0 19.2 13 13.27 13.27 19.54 18.5 55.2 57.4 57.51 57.51 52.5 54.2 0.6 0 0 0 0.4 0.5
of FAME. However, the range of reported values for CN of different types of biodiesel as shown in Table 1 varies consi-derably. The numbers in brackets are the references from where the CN values were taken. It is seen that the CN varies from 45.0 to 60.0 in SME, 48-59.7 in RMEetc. The diffe-rence has been attributed partially to experimental error, and the probability of oxidation of the biodiesel before use which has been found to increase CN (Van Gerpen, 1996). Table 5shows average FAME compositions of different feedstock for biodiesel fuel as extracted from past works (Table 2). From Table 3, the distribution of FAME com-pounds was not the same for all the feedstocks, though a pat-tern was noticed from one feedstock to another. For
exam-ple, linoleic acid and oleic acids are prevalent in sun-flower, cottonseed, rapeseed, peanut and soybean methyl esters. However, palmitic acid and oleic acid are predominant in palm oil and lard, while tallow is a combination of palmitic, stearic and oleic acids. These variations will certainly affect the CN of the various feedstocks.
A graphical representation of the variation of FAME composition of eight different feedstocks is shown in Fig. 1; it is seen that soybean biodiesel consists mainly of linoleic acid and oleic acid. The CN of pure linoleic acid is 36.8, while that of oleic acid is 57.2. The average CN obtained from the literature was 50.7, while the predicted value was 50.3. This is very close and represents the range of the CN of
Ref.* Lauric Myristic Palmitic Stearic Palmitoleic Oleic Linoleic Linolenic
PME [16] [13] [4] [10]
0 0 0 0
0 0 0 0
11.38 11.4 11.2 10.4
2.39 2.4 3.2 8.9
0 0 0 0
48.28 48.3 45.5 47.1
31.95 32 31.7 32.9
0.93 0.9 0.4 0.5 LME
[16] [10] [11]
0.1 0.1 1.2
1.4 0.1 1.86
23.6 25.5 24.49
14.2 15.8 14.39
0 0 2.8
44.2 47.1 38.32
10.7 8.9 13.44
0.4 1.1 3.3 RME
[15] [13] [8] [16] [6]
0 0 0 0 0
0 0 0 0.1
0
4.2 3.5 3.49
4.8 4.3
2 0.9 0.85
0.4 1.9
0 0 0 0.2
0
64 64.1 64.4 61.6 61.5
20.6 22.3 22.3 20.6 20.6
9.2 8.2 8.23
9.2 8.3 *Explanations as in Table 1.
**1. Van Gerpen, 1996; 2. Holser and Harry-O’Kuru; 3. Monyemet al., 2000; 4. Imaraet al., in press; 5. Geller and Goodrum, 1996; 6. Kincs, 1985; 7. Netoet al., 2003; 8. Ramadhaset al., 2005; 9. Zullaijahet al., 2005; 10. Allenet al., 1999; 11. Kinast, 2003; 11. Lapuertaet al., 2005; 12. Demirbas, 2005; 13. Crabbleet al., 2001; 14. Dunn and Knothe, 2001; 15. Leunget al., 2006; 16. Rakopoluloset al., 2006; 17. Lianget al., 2006.
T a b l e 3.Continuation
CN Lauric Mystic Palmitic Stearic Palmitoleic Oleic Linoleic Linolenic
61.1 100 0 0 0 0 0 0 0
69.9 0 100 0 0 0 0 0 0
74.4 0 0 100 0 0 0 0 0
76.3 0 0 0 100 0 0 0 0
51.0 0 0 0 0 100 0 0 0
57.2 0 0 0 0 0 100 0 0
36.8 0 0 0 0 0 0 100 0
21.6 0 0 0 0 0 0 0 100
the dominating FAME in the biodiesel. The contributions of other acids, especially the 10% palmitic acid, will add to the increase in the CN number because of its high value of CN. Linoleic acid is predominant, close to 70% composition, oleic acid of about 20%, with the remaining acids sharing the rest in small percentages in sunflower biodiesel. The average measured value of CN was 53.9, while the predicted value was 48. It is expected that the CN should be within the range of 36.8 and 57.7, and should be closer to 36.8 than 57.7, considering that the composition of FAME is high in linoleic acid. The predicted value of 48 could be said to fall within the expected value in view of the dominant value of linoleic acid. However, it was closer to 57.7 than 36.8, which may be due to the effect of the 6% palmitic acid and 4% stearic acid which tend to increase the overall CN. The CN
of these acids are 74.6 and 76.3, respectively. The measured values may then not be totally accurate. The sharp disparity here could be due to oxidation of the fuel since some reports establish an increase in CN with oxidation up to 82 value of peroxide in the biofuel (Van Gerpen, 1996).
The same trend was observed in palm oil methyl ester where palmitic acid and oleic are the major constituents of the methyl ester. This is a combination of saturated and unsaturated acids. It has been found out that CN increases with saturation and decreases with unsaturation (Van Gerpen, 1996). The CN for pure methyl oleate was 57.2, while that of pure palmitate was 74.4. The average CN from literature was 62.7, while the predicted value was 63.1. The values are within the range of the two prominent FAME constituents, and closer to each other.
Feedstock Lauric Mystic Palmitic Stearic Palmitoleic Oleic Linoleic Linolenic
SME* 0 0.06 10.64 3.88 0.14 32.38 46.36 5.53
SUNME 0 0.01 6.48 4.25 0 18.97 69.07 0.26
PME 0.29 0.87 43.08 4.31 0.12 40.55 9.64 0.32
TME 0.08 1.3 23.88 17.88 0 45.25 2.85 0.53
CME 0.02 0.32 22.05 2.17 0.13 16.13 55.72 0.25
PEME 0 0 11.1 4.22 0 47.23 32.14 0.68
LME 0.07 1 26.03 15 0 45.43 9.87 0.5
RME 0 0.02 4.06 1.2 0.04 63.12 21.28 8.63
*Explanations as in Table 1.
T a b l e 5.Average % composition of fatty acids of different feedstocks
0 10 20 30 40 50 60 70 80
Lauric Mystic Palmitic Stearic Palmitoleic Oleic Linoleic Linoletic
Fatty acid
%
compos
ition
SME SUNME PME TME CME PEME LME RME
Fig. 1.Fatty acid compositions of eight feedstocks.
Linolenic
Linoleic acid is the predominant acid in cottonseed, with oleic and palmitic acids contributing about 16% and 22%, respectively. The average CN from literature was 52, while the predicted value was 52.8. This is close to each other and to the range of CN values of the pure FAME constituents.
The most dominant fatty acid in rapeseed is oleic acid, having about 60% of the composition, with 20% of linoleic acid. The average CN was 52.8, while the predicted value was 50.6. It is within the range of the CN of the dominant FAME. The FAME composition of peanut shows that oleic acid is predominant, representing about 47% of the com-position, with linoleic acid being the second predominant with about 30% of the composition. The average CN from literature was 54, while the predicted value was 54. The value is still within the range of the two major acids in the oil. The same trend was observed in lard and tallow.
The CN follows the same trend in the composition of the FAME compounds in all the feedstocks used. It was observed that a feedstock that is high in saturated fatty esters has a high CN, while feedstocks predominant in unsaturated fatty acid have lower CN values. This agrees with a previous report by Van Gerpen (1996). This suggests a profound effect of fatty acid composition on the CN of the biodiesel.
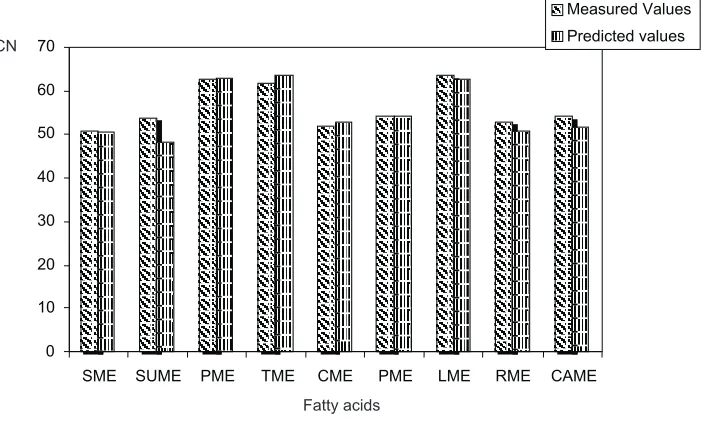
As illustrated in Fig. 2, the average measured values of CN obtained from literature compare well with the predicted values using the generated equation. However, there are slight variations in rapeseed, sunflower, and tallow bio-diesels. This may be connected with the variations in the results obtained by different researchers. The predicted va-lues, however, fall within the range of the measured values. It has been established that a change in the oxidation level of
biodiesel would have an impact on the cetane number (Vellguth, 1983). An increase in the peroxide value of the biodiesel up to 82 has been found to increase CN (Van Gerpen, 1996). This may account for the changes in CN of different stocks.
The equation developed as Eq. (2) was used to predict the CN values of different biodiesels consisting of different FAME compositions. A plot of predicted values of CN against the measured values from literature is illustrated in Fig. 3. The coefficient of determination (R2) was 0.88, which indicates that the CN can be predicted with 88% accu-racy based on the FAME composition of the biofuel. A clear pattern was observed from Fig. 3 showing two different groups of CN values, one forming the range of 48-54, and the other - 61.8 to 63.6. The CN values in the first range are
Fig. 3.Relationship between measured and predicted values of
ce-tane number (CN). 0
10 20 30 40 50 60 70
SME SUME PME TME CME PME LME RME CAME
Measured Values Predicted values
Fig. 2.Relationship between average measured and predicted values of cetane number (CN).
CN
Fatty acids
CN measured
CN
biodiesel fuels from vegetable oils, while the second range refers to biodiesel fuels from animal fats and palm oil. It was observed that FAME from vegetable oils are mostly un-saturated, while the animal fats and palm oil are saturated fatty acids. This further supports the fact that the CN is affected by the % composition of FAME, as CN values of the saturated FAME are above 60, while those of unsatura-ted FAME are below 60, as seen inTable 2.
CONCLUSIONS
1. It is established that the FAME composition of the methyl esters used has a predominant effect on the cetane number (CN) of the biodiesel. From the results obtained, it is evident that CN is affected by the % composition of the FAME in the fuel.
2. An equation was developed to predict the CN based on the FAME composition and it was able to predict with 88% accuracy. The developed equation can effectively predict the CN of the biodiesel based on its FAME composition.
REFERENCES
Alcantara R., Amores J., Canoira L., Fidalgo E., Franco M.J.,
and Navarro A., 2000.Catalytic production of biodiesel
from soybean oil, used frying oil and tallow, Biomass Bioenergy, 18, 515-527.
Allen C.A.W., Watts K.C., Ackman R.G., and Pegg M.J., 1999. Predicting the viscosity of biodiesel fuels from their fatty acid ester composition. Fuel, 78, 1319-1326.
Altin R., Cetinkaya S., annd Yücesu H.S., 2001.The potential of
using vegetable oil fuels as fuel for diesel engines. Energy Conv. Manag., 42, 529-538.
Arkoudeas P., Kalligeros S., Zannikos F., Anastopoulos G.,
Karonis D., Korres D., and Lois E., 2003.Study of using
JP-8 aviation fuel and biodiesel in CI engines. Energy Conv. Manag., 44,1013-1025.
American Society for Testing and Materials (ASTM), 1988. Annual Book of ASTM Standards, 5 (2004). Test Methods for Rating Motor, Diesel, and Aviation Fuels, Easton, MA, USA.
Canakci M. and Gerpen J.V., 2001.Biodiesel production from
oils and fats with high free fatty acids. Transactions of the ASAE, 44(6), 1429-1436.
Crabbe E., Nolasco-Hipolito C., Kobayashi G., Sonomoto K.,
and Ishizaki A., 2001. Biodiesel production from crude
palm oil and evaluation of butanol extraction and fuel pro-perties. Process Biochem., 37, 65-71.
Demirbas A., 2005.Biodiesel production from vegetable oils via
catalytic and non-catalytic supercritical methanol transe-sterification methods. Progress in Energy Combust. Sci., 31, 466-487.
Dunn R.O. and Knothe G., 2001.Alternative diesel fuels from
vegetable oils and animal fats. J. Oleo Sci., 50(5), 415-26.
Fangrui M.A. and Milford A.H., 1999.Biodiesel production: a
re-view. Bioresource Technol., 70, 1-15.
Freedman B. and Bagby M.O., 1990.Predicting cetane numbers
of n-alcohols and methyl esters from their physical pro-perties. J. Am. Oil Chem. Soc., 67(9), 565-571.
Geller D.P. and Goodrum J.W., 2004.Effects of specific fatty
acid methyl esters on diesel fuel lubricity. Fuel, 83, 2351-2356.
Gragg K., 1994. Effects of Environmentally Classified Diesel
Fuels, RME and Blends of Diesel Fuels and RME on the Exhaust Emissions. Final Report., Swedish Environ. Prot. Agency. Bilprovning Press, Stockholm, Sweden.
Holser R.A. and Harry-O’Kuru R., 2006.Transesterified
milk-weed (Asclepias) seed oil as a biodiesel fuel. Fuel (in press).
Imahara H., Minami E., and Saka S., 2006.Thermodynamic
study on cloud point of biodiesel with its fatty acid com-position. Fuel (in press).
Kalligeros S., Zannikos F., Stournas S., Lois E., Anastopoulos
G., Teas Ch., and Sakellaropoulos F., 2003.An
investiga-tion of using biodiesel/marine diesel blends on the perfor-mance of a stationary diesel engine. Biomass and Bioenergy, 24, 141-149.
Khan A.K., 2002.Research into Biodiesel Kinetics and Catalyst
Development. Ph.D. Thesis, Dept. Chem. Eng., University of Queensland, Australia.
Kinast J.A., 2003.Production of Biodiesels from Multiple
Feed-stocks and Properties of Biodiesels and Biodiesel/ Diesel Blends. Final Report. National Renewable Energy Labo-ratory. 1617 Cole Boulevard Golden, CO, USA.
Kincs F.R., 1985.Meat fat formulation. JAOCS, 62, 815-818.
Knothe G., 2005.Dependence of biodiesel fuel properties on the
structure of fatty acid alkyl esters. Fuel Proc. Technol., 86, 1062, 1059-1070.
Knothe G., Bagby M.O., and Ryan T.W., 1997.Cetane numbers
of fatty compounds: influence of compound structure and of various potential cetane improvers. Soc. Aut. Eng. Techn. Paper No. 971681.
Knothe G., Matheaus A.C., and Ryan T.W., 2003.Cetane
num-bers of branched and straight-chain fatty esters determined in an ignition quality tester. Fuel, 82, 971-990.
Labeckas G. and Slavinskas S., 2006a.The effect of rapeseed oil
methyl ester on direct injection Diesel engine performance and exhaust emissions. Energy Conv. Manag., 47, 1954-1967.
Labeckas G. and Slavinskas S., 2006b.Performance of
direct-injection off-road diesel engine on rapeseed oil. Renewable Energy, 31, 849-863.
Lang X., Dalai A.K., Bakhshi N.N., Reany M.J., and Hertz P.B.,
2001.Preparation and characterization of bio-diesels from
various bio-oils. Bioresource Technol., 80, 53-62. Lapuerta M., Armas O., Ballesteros R., and Fernandez J.,
2005.Diesel emissions from biofuels derived from Spanish
potential vegetable oils. Fuel, 84, 773-780.
Leung D.Y.C., Koo B.C.P., and Guo Y., 2006.Degradation of
biodiesel under different storage conditions. Bioresource Technol., 97, 250-256.
LiangY.E., May C.Y., Foon C.S., Ngan M.A., Hock C.C., and
Basiron Y., 2006.The effect of natural and synthetic
Marchetti J.M, Miguel V.U., and Errazu A.F., 2007.Possible methods for biodiesel production. Renewable and Sustaina-Ble Energy Reviews, FAO Press, Rome, Italy (in press). McCormick R., Graboski M., Alleman T., Herring A., and
Shainetyson K., 2001.Impact of biodiesel source material
and chemical structure on emissions of criteria pollutants from a heavy-duty engine. Environ. Sci. Technol., 35, 1742-1747.
McDonald J.F., Purcell D.L., McClure B.T., and Kittelson
D.B., 1995.Emissions Characteristics of Soy Methyl Ester
Fuels in a IDI Compression Ignition Engine. SAE Paper No. 950400.
Michael S.G. and Robert L.M., 1998.Combustion of fat and
vegetable oil derived fuels in diesel engines. Progr. Com-bust. Sci., 24, 125-164.
Midwest Biofuels, Inc.1993.Biodiesel Cetane Number Engine Testing Comparison to Calculated Cetane Index Number. Final Report to the National Biodiesel Board, New York, USA.
Mittelbach M., Pokits B., and Silberholz A., 1992.Liquid Fuels
from Renewable Resources: Production and Fuel Properties of Fatty Acid Methyl Esters from Used Frying Oil. Proc. Alternative Energy Conf., 74, 14-15 December, Nashville, USA.
Mittelbach M., Tritthart P., and Junek H., 1985.Diesel fuel
derived from vegetable oils. Energy in Agric., 4, 207-215.
Monyem A., Canakci M., and Van Gerpen J.H., 2000.
Investi-gation of biodiesel thermal stability under simulated in-use conditions. Appl. Eng. Agric., 16(4), 373-378.
Neto da Silva F., Prata A.S., and Teixeira J.R., 2003.Technical
feasibility assessment of oleic sunflower methyl ester utili-sation in diesel bus engines. Energy Conv. Manag., 44, 2857-2878.
Peterson C.L., Haines H., and Chase C., 1993.Rapeseed and
Safflower Oils as Diesel Fuels. Proc. 1st Biomass Conf., Americas: Energy, Environment, Agriculture, and Industry, August 30 - September 2, Burlington, Vermont, USA.
Peterson C.L., Reece D.L., Hammond B.J., Thompson J., and Beck S.M., 1994.Processing, characterization and perfor-mance of eight fuels from lipids. ASAE Paper No. 946531. Pischinger G.M., Falcon A.M., Siekmann R.W., and Fernandes
F.R., 1982.Methylesters of plant oils as diesels fuels, either
straight or in blends vegetable oil fuels. ASAE Paper No. 4-82.
Rakopoulos C.D., Antonopoulos K.A., Rakopoulos D.C.,
Houn-talas D.T., and Giakoumis E.G., 2006.Comparative
per-formance and emissions study of a direct injection Diesel
engine using blends of diesel fuel with vegetable oils or bio-diesels of various origins. Energy Conversion and Manag., (in press).
Ramadhas A.S., Jayaraj S., and Muraleedharan C., 2005.
Bio-diesel production from high FFA rubber seed oil. Fuel, 84, 335-340.
Ramadhas A.S., Jayaraj S., Muraleedharan C., and
Padmaku-mari K., 2006.Artificial neural networks used for the
predi-ction of the cetane number of biodiesel. Renewable Energy, 31, 2524-2533.
Reece D.L and Peterson C.L., 1993.A report on the Idaho
on-road vehicle test with RME and neat rapeseed oil as an alter-native to diesel fuel. ASAE Paper No. 93-5018.
Reed T.B., 1993.An overview of the current status of biodiesel.
Proc. 1st Biomass Conf. Americas: Energy, Environment, Agri- culture, and Industry. August 30 - September 2. Burlington, Vermont, USA.
Schwab A.W., Bagby M.O., and Freedman B., 1987.
Prepara-tion and properties of diesel fuels from vegetable oils. Fuel, 66, 1372-8.
Sharp C.A., 1994.Transient Emissions Testing of Biodiesel in
a DDC 6V-92TA DDEC Engine. Final Report to the Na-tional Biodiesel Board. SWRI Report No. 6602 & 6673 Southwest Research Institute. San Antonio, TX.
Srivastava A. and Prasad R., 2000.Triglycerides-based diesel
fuels. Renew. Sust. Energy Rev., 4, 111-33.
Takesawa Y., 1993.Study on Palm Oil for Diesel Substitute. In:
Vegetable Oils as Transport Fuels (Ed. G. Caserta). FAO Press, Pisa, Italy.
Van Gerpen J.A., 1996.Cetane number testing of biodiesel. Proc.
3rd Conf. ASAE Liquid Fuel, September 15-17, Nashville, TN, USA.
Van Gerpen J., Shanks B., Pruszko R., Clements D., and Knothe G.,
2004.Biodiesel Analytical Methods. NREL/SR-510-36240.
Vellguth G., 1983. Performance of Vegetable Oils and their
Monoesters as Fuels for Diesel Engines. SAE Paper No. 831358/30.
Wagner L.E., Clark S.J., and Schrock M.D., 1984.Effects of
Soybean Oil Esters on the Performance, Lubricating Oil, and Wear of Diesel Engines. SAE Paper No. 841385.
Wang W.G., Lyons D.W., Clark N.N., and Gautam G., and
Norton P.M., 2000. Emissions from nine heavy trucks
fueled by diesel and biodiesel blend without engine modification. Environ. Sci. Technol., 34, 933-939.
Zullaikah S., Lai C., Vali S.R., Ju Y., 2005.A two-step