NSW Public Health Bulletin Vol. 12 No. 5 126
Theo Vos, Stephen Begg, Ying Chen and Anne Magnus Public Health Division
Department of Human Services, Victoria
While the public has growing expectations of health services, and the repertoire of health services to respond to these demands is expanding, governments are under pressure to justify their allocation of health resources. Expressed intentions to base decision-making on health outcomes will remain rhetoric, however, unless adequate tools to measure health outcomes are used. In response to this need for comparable information on health outcomes, the Public Health Division of the Department of Human Services in Victoria has undertaken a body of work to assist decision-making on health resource allocation in Victoria.
The Victorian Burden of Disease Study is one of the endeavours in this process.1,2 The study uses the methodology developed by researchers at Harvard University and the World Health Organization for the Global Burden of Disease Study.3 The Victorian study had a similar goal: to provide a comprehensive assessment of premature mortality and disability attributable to diseases, injuries and various risk factors in 1996 and projections 20 years ahead. The Victorian study was undertaken in close collaboration with a national study at the Australian Institute of Health and Welfare (AIHW).4 This article presents analyses of the effect of socioeconomic differentials in life expectancy and mortality in Victoria between 1992 and 1996.
METHODS
The Australian Bureau of Statistics (ABS) supplied data on deaths of Victorians that occurred anywhere in Australia and were registered between 1992 and 1996. All-cause mortality by age and sex was used to create abridged life tables according to the Chiang method.5 The accuracy of life tables depends on the size of the population for which mortality observations are available. For the US Burden of Disease Study, Murray and colleagues found by simulation methods that the 95 per cent confidence interval around a life expectancy estimate is more than two years and rapidly widens for population sizes smaller than 100,000.6 Most of the Local Government Areas (LGAs) in Victoria have a smaller population size. To improve the accuracy of the calculations of life expectancy by small areas, we therefore examined five years of death data and aggregated contiguous LGAs with populations of fewer than 30,000 (or 150,000 person years of observation for five years). Thus, the 78 LGAs in Victoria were reduced to 56 small areas and all LGAs within a small area were given the same life expectancy.
SOCIOECONOMIC DIFFERENTIALS IN LIFE EXPECTANCY AND
YEARS OF LIFE LOST IN VICTORIA, 1992–1996
The 95 per cent confidence intervals of the life expectancy at birth estimates were derived by simulation methods, using the @RISK software program.7 The software allows the entry of probability distributions in a spreadsheet and then recalculates the spreadsheet many times over and produces summary statistics of designated output variables. We entered age and sex specific mortality rates as normal distributions defined by the observed rate and the standard error:8
Standard Error Mortality rate population =
Years of Life Lost (YLL) are the mortality component of Disability Adjusted Life Years (DALY). They are determined by the average remaining life expectancy while discounting future years by three per cent. We used a cohort life expectancy table created by Colin Mathers for the Australian National Burden of Disease study. For comparisons between populations and over time, YLL rates per 1,000 population were calculated and age-standardised to the 1996 Victoria population. Confidence intervals around the YLL rates were extrapolated from the 95 per cent confidence intervals of the age-standardised mortality rates applying the size of the interval as a proportion of the mortality rate to the YLL rate.
For comparisons of mortality differentials between metropolitan areas, rural centres (towns with 10,000– 100,000 population) and other rural and remote areas, the Rural, Remote and Metropolitan Areas (RRMA) classification of the approximately 200 Statistical Local Areas (SLA) was used.9 This classification is based on pre-1995 SLA boundaries. Where new SLA boundaries overlapped with old SLAs with different rurality status we assigned the rurality status taking population size and density into consideration.
Based on information collected at the census, the ABS produces socioeconomic indices for statistical local areas.10 In analyses of the relationship between socioeconomic status and mortality, we used the 1996 Socioeconomic Indexes for Areas (SEIFA) index of relative socioeconomic disadvantage, a composite measure that combines factors such as income, education, employment, family structure, dwellings, house ownership, marital status and ethnicity. After ordering SLAs by SEIFA index we grouped SLAs into SEIFA quintiles ensuring roughly equal population totals for each quintile.
Below Victoria average (23)
Equal to Victoria average (44)
Above Victoria average (11) Below Victoria average (23)
Equal to Victoria average (44)
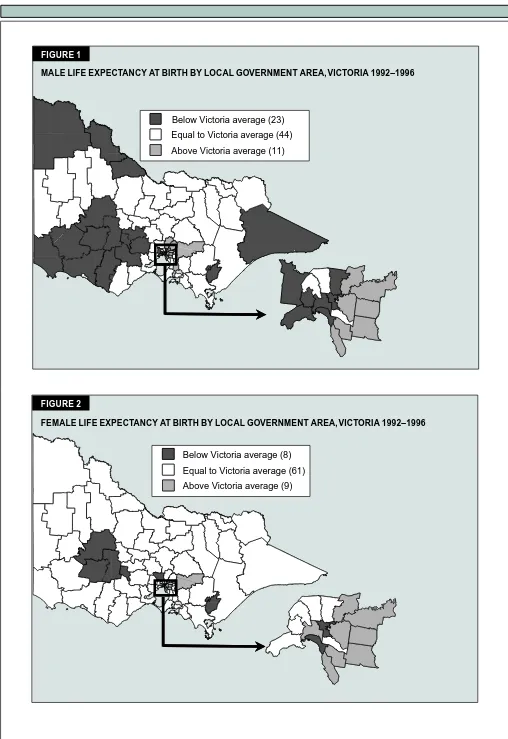
Above Victoria average (11) FIGURE 1
MALE LIFE EXPECTANCY AT BIRTH BY LOCAL GOVERNMENT AREA, VICTORIA 1992–1996
Below Victoria average (8)
Equal to Victoria average (61)
Above Victoria average (9) Below Victoria average (8)
Equal to Victoria average (61)
Above Victoria average (9) FIGURE 2
NSW Public Health Bulletin Vol. 12 No. 5 128
cause-specific mortality rates, SEIFA index, rurality status and population density.
RESULTS
The average male life expectancy at birth in Victoria over the period 1992–1996 was 75.6 years, ranging from 71.7 years in Yarra to 78.6 in Manningham. LGAs with significantly lower life expectancy than the state average include 16 rural LGAs and seven metropolitan LGAs. Eleven metropolitan LGAs had higher than average life expectancy (Figure 1)
Female life expectancy at birth in Victoria over the period 1992–1996 was 81.3 years, ranging from 79.4 in La Trobe to 83.3 in Monash. LGAs with significantly lower life expectancy than the state average include five rural areas and three metropolitan areas. Nine metropolitan LGAs had higher than average life expectancy in women (Figure 2).
Regression analyses revealed an association between low socioeconomic status and lower life expectancy at birth. The SEIFA index of relative socioeconomic disadvantage explains 36 per cent and 30 per cent of the variation in life expectancy at birth between LGAs in males and females respectively. As this is an ecological analysis, taking the average socioeconomic status of the population living in a small area and correlating it with the average mortality experience in the area, it is likely that this has diluted the true association between socioeconomic status and life expectancy. Unfortunately, the ABS mortality figures, unlike the SEIFA index, do not allow comparison of areas smaller than SLAs. If analysis at the level of census collection districts or even at the level of the
individual were possible, socioeconomic status would be a stronger predictor of mortality. The Port Phillip LGA is a good example of how an average can mask large differences within one area. The area combines the very wealthy suburbs of Albert Park and Middle Park, and a mix of upcoming and disadvantaged areas in Port Melbourne and St Kilda. The male and female life expectancy of Port Phillip as a whole is already among the lowest in Victoria and would certainly have been lower if we could have separated out the more advantaged areas.
All-cause YLL rates show a marked gradient across the five quintiles of the SEIFA index of relative socioeconomic disadvantage. The differentials are more marked in men. The male YLL burden in the lowest quintile is 30 per cent higher than in the highest quintile, while in women this difference is 19 per cent. While the overall YLL burden in women is considerably smaller than in men, women in the lowest quintile areas experience higher YLL than men of the most well-to-do areas (Figure 3).
Ischaemic heart disease, chronic obstructive pulmonary disease (COPD), diabetes, asthma, sudden infant death syndrome (SIDS), road traffic accidents and homicide are the most important causes of death in both men and women that show large socioeconomic differences. In addition, socioeconomic differences are associated with a greater mortality burden in men for pneumonia, stomach cancer, lung cancer, stroke, cirrhosis, drug overdoses, dementia, inflammatory heart disease, other transport accidents, drowning and suicide. Neonatal conditions in female infants, and not in male infants, are associated with lower SEIFA quintiles. AIDS in men and breast cancer
FIGURE 3
RATES OF YEARS OF LIFE LOST BY SEIFA QUINTILE OF STATISTICAL LOCAL AREA, SEX AND MAJOR CAUSES OF DEATH, VICTORIA
0 20 40 60 80 100
1 2 3 4 5 1 2 3 4 5
Oth er cause s Inj uries Cancer
Cardio vasc ula r diseases
Males Females
Rate of
YLL per 1,
000 popula
tion
Low Hig h Low Hig h
0 20 40 60 80 100
1 2 3 4 5 1 2 3 4 5
Oth er cause s Inj uries Cancer
Cardio vasc ula r diseases
Males Females
Rate of
YLL per 1,
000 popula
tion
Low Hig h
in women are the only causes of death that show the opposite effect being more common in wealthier areas.
The mortality burden is greater in rural Victoria than in the metropolitan areas of Melbourne and Geelong. The smaller differences in rates of years of life lost between the larger rural towns and the more remote rural areas are not significant (Figure 4). Ischaemic heart disease, COPD, road traffic accidents and drowning are the main causes of death more commonly found in rural Victoria. Additional causes of the higher mortality burden in the more remote rural areas are asthma in men and women, and suicide, other transport accidents and machinery accidents in men. AIDS, drug overdose and hepatitis are the only causes more prevalent in the metropolitan areas. The differences in the years of life lost due to injuries are most striking. The road traffic toll is 60 per cent greater in people living in rural towns and two-and-a-half times higher in the more remote rural areas compared to metropolitan Melbourne and Geelong.
DISCUSSION
The overlap in the conditions that are responsible for the greatest differences in mortality burden by rurality status and relative socioeconomic disadvantage begs two questions:
•
which of the two factors is of greater importance?•
do they differ by cause?The first thing to note is the uneven distribution of the SEIFA index of relative socioeconomic disadvantage across Victoria, indicating a strong link between socioeconomic status (SES) and rurality. Thus, there is a confounding effect between SES and rurality as
explanatory factors for differentials in the mortality burden. When both factors are taken into account, a clearer picture of the importance of each appears. The higher mortality burden from cardiovascular diseases in rural Victoria is largely due to the lower socioeconomic status of rural residents. This would indicate that differences are mostly likely attributable to life style factors such as smoking and diet. However, after controlling for socioeconomic status, rural residence remains significantly associated with mortality from ischaemic heart disease. This raises the hypothesis that people in rural areas may not have the same level of access to life-saving treatment. This could be due to delays in resuscitation, thrombolytic treatment or surgical interventions. Also, it cannot be ruled out that SES influences access to treatment.
The higher injury mortality in rural Victoria and particularly for the more remote rural areas is largely due to rurality status rather than SES. Road traffic accidents, machinery accidents, other traffic accidents, the other categories of unintentional injuries, and suicide in young males, are all significantly raised causes of mortality that are independent of socioeconomic status. The differences with the more densely populated parts of Victoria are great enough to warrant targeted interventions. More detailed analysis of the circumstances and the nature of injury deaths is needed to identify appropriate interventions for injury prevention.
These large differentials in life expectancy and YLL gave the impetus to a detailed analysis of the burden of disease for each of the 78 LGAs in Victoria. LGA burden of disease data is available for scrutiny on the Internet at www.dhs.vic.gov.au/phd/lgabod/index.htm. FIGURE 4
RATES OF YEARS OF LIFE LOST BY RURALITY STATUS, SEX AND MAJOR CAUSES OF DEATH, VICTORIA
0 20 40 60 80
Metr o Rural to wns
Rat
e of
YL
L
s
per 1,000 population
Males Females
Other rura l
Metr o Rural to wns
Other rura l
Oth er cause s Injur ies Canc er Cardio vascular dis eases
0 20 40 60 80
Metr o Rural to wns
Rat
e of
YL
L
s
per 1,000 population
Males Females
Other rura l
Metr o Rural to wns
Other rura l
NSW Public Health Bulletin Vol. 12 No. 5 130
Planners at state, regional and LGA level are using the results to identify local health problems and implement strategies that can reduce the large differentials in health status between LGAs.
REFERENCES
1. Vos T, Begg S. The Victorian Burden of Disease Study:
Mortality. Melbourne: Public Health and Development
Division, Department of Human Services, 1999. Also available on the World Wide Web at www.dhs.vic.gov.au/ phd/9903009/index.htm.
2. Vos T, Begg S. The Victorian Burden of Disease Study:
Morbidity. Melbourne: Public Health Division, Department
of Human Services, 2000. Also available at www.dhs.vic.gov.au/phd/9909065/index.htm.
3. Murray CJM and Lopez AD (Eds.). The Global Burden of
Disease: a comprehensive assessment of mortality and disability from diseases, injuries, and risk factors in 1990 and projected to 2020. Cambridge: Harvard University
Press, 1996.
4. Mathers C, Vos T, Stevenson C. The burden of disease
and injury in Australia. Canberra: Australian Institute of
Health and Welfare, 1999. Also available on the World
bdia.html.
5. Chiang CL. The life table and its applications. Florida: Robert E Krieger Publishing Company, 1984.
6. Murray CJM, Michaud CM, McKenna MT, Marks JS. US
patterns of mortality by county and race: 1965–1994. US Burden of Disease and Injury Monograph Series. Cambridge,
Mass: Harvard Center for Population and Development Studies, 1998.
7. Palisade. @RISK: advanced risk analysis for spreadsheets. New York: Palisade, 1996.
8. Kirkwood B. Essentials of medical statistics. Oxford: Blackwell Scientific Publications, 1988.
9. Department of Primary Industries and Energy. Rural, remote
and metropolitan areas classification, 1991 census edition.
Canberra: Department of Primary Industries and Energy, 1994.
10. Australian Bureau of Statistics. 1996 Census of population
and housing. Socioeconomic indexes for areas. Canberra:
Australian Bureau of Statistics, 1998. ABS Catalogue no. 2039.0.
Martin McKee
Professor of European Public Health
London School of Hygiene and Tropical Medicine
THE SCALE OF INEQUALITY
In 1998, of every 100 15-year-old boys in Iceland, 91 could expect, on the basis of current levels of mortality, to survive until the age of 60. Among a similar group of Zambian boys, only 22 could have a similar expectation. Male life expectancy at birth is similar in Russia and Ghana, but the underlying causes are very different.
The scale and diversity of the variation in mortality between countries has fascinated researchers for years. If we can begin to understand these differences, maybe we can gain some insights into the causes of inequalities in health within countries. This article examines the inequalities in life expectancy between countries, discusses the quality of global data sources, and describes how many analyses fail to recognise the complexity of attributing causality.
A first question must be: how good the data are on which such comparisons are based? There are two major issues. The first is whether they cover an adequate spectrum of ill health. A major achievement of the program on the Global Burden of Disease has been to highlight the importance of conditions that
GLOBAL HEALTH INEQUALITIES: THE CHALLENGE TO
EPIDEMIOLOGY
have a greater effect on disability than on death, such as mental health.1 Unfortunately, most comparisons are limited to data on mortality. While the World Health Organization does publish data on disability adjusted life expectancy,2 this involves the application of standard weightings for particular conditions to diverse populations and they are not based on directly collected data on disability in each country. Further, the correlation between unadjusted and disability adjusted life expectancy is very high (r = 0.96). Many countries do collect some information on health status, typically from household surveys, but comparability is limited.3