Volume 16, Number 5–6
May–June 2005
ISSN 1034 7674
State Health Publication PH 050080
NSW
Public
Health
Bulletin
CoNteNtS
Year IN reVIew:
CoMMuNICable DISeaSe
SurVeIllaNCe, 2004
In this issue we review the trends in reports of notifiable
diseases among NSW residents received by the NSW public
health units for 2004. Readers interested in the details of
notifications for specific diseases are referred to Tables 1–5
where diseases are reported by: year of onset, month of onset,
number of cases and rate per 100,000 population by area health
service, and number of cases by age group and sex. Table 6
shows the number of people with notifiable conditions who
were reported to have died by the time of follow-up by their
local public health unit.
treNDS
Among the 57,783 NSW residents with medical conditions
notified by doctors, hospital staff, and laboratories for 2004,
highlights included:
Conditions most frequently reported:
gastroenteritis occurring in institutions (12,784 or 189 per
100,000 population)
chlamydia (10,020 or 148 per 100,000 population, with,
by geographical area, the highest crude rates in the South
Eastern Sydney, Central Sydney and New England health
service areas)
hepatitis C (4,974 cases or 74 per 100,000 population, with
the highest crude rates in Central Sydney, Mid North Coast,
Northern Rivers and Far West health service areas)
pertussis (3,540 cases or 52 per 100,000 population, with
the highest crude rates in the Macquarie, Hunter and
Wentworth health service areas)
hepatitis B (2,835 cases or 42 per 100,000 population, with
the highest crude rates in Central Sydney, South Western
Sydney and Western Sydney health service areas)
salmonella infections (2,132 cases or 32 per 100,000
population, with the highest crude rates in the Northern
Rivers and New England health service areas).
•
•
•
•
•
•
77
Year in review:
Communicable Disease
Surveillance, 2004
88
Imported malaria notified
in New South wales and
the australian Capital
territory, including trends in
notifications of Plasmodium
falciparum, 1989–2003
91
Health Impact assessment
Colloquium: 9 December 2005
92
NSw telehealth Initiative—
2005 Symposium
93
Celebrating 15 years of bug
breakfast
93
bug breakfast on the NSw
Health Intranet
94
bug breakfast in the
Bulletin—outbreaks: the past,
present and future
96
Communicable Diseases
report, NSw, for March and
april 2005
96
Trends
96
Enteric disease
96
Pertussis
Conditions with the most meaningful declines in
the number of notifications compared with previous
years:
hepatitis C (4,974 cases, steadily declining from 8,691
in 2001)
meningococcal disease (148 cases, steadily declining
from 253 in 2000)
rubella (18 cases, declining from 191 in 2000).
Conditions with the most meaningful increases in
the number of notifications compared with previous
years:
chlamydia (10,020 cases, continuing its rise since it
became notifiable in the late 1990s), possibly due to
both better detection and a real increase in infections
gastroenteritis occurring in institutions (12,784 cases,
up from 3,583 in 2003), due in part to multiple outbreaks
in aged care facilities
pertussis (3,540 cases, up from 2,770 in 2003) across
the State
salmonellosis (2,132 cases, up from 1,838 in 2003),
due in part to several outbreaks of different salmonella
subspecies
cryptosporidioisis (357, up from 202 in 2002), most
likely due, in part, to transmission via contaminated
swimming pools
legionnaires’ disease due to infection with Legionella
pneumophila (51, up from 23 in 2003), partly the result
of a cluster related to eastern Sydney
2shigellosis (96 cases, up from 59 in 2003)
syphilis (1,047 cases, up from 843 in 2003), due mostly
to new infections among inner city men who have sex
with men
mumps (65 cases, up from 35 in 2003), mainly in
Sydney.
Conditions least frequently reported
There were no reported cases of chancroid, congenital
syphilis, diphtheria, donovanosis, granuloma inguinale,
lymphogranuloma venereum, plague, polio, rabies, severe
acute respiratory syndrome (SARS), tetanus, typhus, viral
haemorrhagic fevers, or yellow fever in 2004.
Conditions associated with the largest numbers of
reported deaths
Deaths reported via the surveillance mechanisms for
notifiable conditions may not include all deaths associated
with these conditions. Public health units routinely
investigate all cases of some notifiable conditions (for
example tuberculosis, measles, meningoccocal disease)
in order to implement control measures and are likely
to identify associated deaths. However, there are other
notifiable conditions (for example chlamydia and
gonorrhoea) where no routine investigation takes place
and for which deaths will not be identified. Conversely,
some deaths of patients following notification may be due
to conditions other than that notified. Deaths were most
•
•
•
•
•
•
•
•
•
•
•
•
frequently reported for the following notifiable diseases:
invasive pneumococcal disease (87)
HIV infection (52), including 32 people who died from
AIDS and 20 people with HIV infection who died of
causes other than AIDS.
outbreaKS aND tHreatS
Several notable disease outbreaks and threats were reported
in 2004 in NSW. These included:
12 outbreaks of influenza in aged care facilities in
September, associated with 34 deaths
5two clusters of measles linked to overseas travel
2several clusters of pertussis (whooping cough)
244 outbreaks of food borne disease affecting 550
people
452 other gastroenteritis outbreaks (affecting 12,784
people: more than six times the number of outbreaks
reported in 2003, when 71 were reported). These
occurred largely in institutional settings and were most
likely caused by person to person spread of norovirus
several outbreaks of salmonellosis, including:
Salmonella Typhimurium phage type 12 (linked to
eating chicken prepared at home), S. Birkenhead
6(risk
factor undetermined), S.Typhimurium PT 126 (linked
to eating tiramisu prepared with contaminated raw
egg)
5, S. Typhimurium PT 135 (linked to a residential
facility)
4, and S. Typhimurium phage type 170/108 (in
part linked to consumption of contaminated chicken)
4a cluster of hepatis A in a school, possibly linked to
sharing a lolly jar
3ongoing concerns regarding the emergence of H5N1
avian influenza in south east Asia leading to the deaths
of millions of chickens and a small number of people
who were exposed to infected fowl
5the transient re-emergence of SARS, following the
virus’s escape from a laboratory in northern China in
April.
2So wHat DoeS It all MeaN?
The data derived from notifiable diseases captures only a
subset of infectious diseases that cause disease in people.
Nonetheless, analysis of these data indicates that enteric
viruses, blood borne viruses, sexually transmissible
infections, pertussis, food borne infections and influenza
remain important, preventable causes of disease in
NSW. These diseases can be further reduced through
implementation of a range of measures, including careful
attention to hand washing (especially in people with
diarrhoea and their carers, and people who handle food),
routine immunization, practicing safe sex and the use of
sterile injecting equipment.
tHaNK You
depends on effective surveillance of communicable diseases
in the community. We acknowledge all those general and
specialist medical practices, laboratories, hospitals, schools,
childcare centres, and others, who have notified diseases of
public health significance to their local public health units
for investigation and control.
refereNCeS
NSW Department of Health. Communicable Diseases Report,
NSW, for February 2004. N S W Public Health Bulletin 2004;
15(4): 76–7.
NSW Department of Health. Communicable Diseases Report,
NSW, for March and April 2004. N S W Public Health Bulletin
2004; 15(5–6): 115–18.
NSW Department of Health. Communicable Diseases Report,
NSW, for May–June 2004. N S W Public Health Bulletin
2004; 15(7–8): 144–9.
NSW Department of Health. Communicable Diseases Report,
NSW, for July and August 2004. N S W Public Health Bulletin
2004; 15(9–10): 184–5.
NSW Department of Health. Communicable Diseases Report,
NSW, for September–October 2004. N S W Public Health
Bulletin
2004; 15(11–12): 220–4.
Beard F, Stafford R, Terry J, Morgan G, Ayyar A, Birrell
F. Risk factors for sporadic Salmonella Birkenhead
infection in Queensland and Northern New South Wales:
a case control study. N S W Public Health Bulletin 2004;
15(9–10): 172–7.
1.
2.
3.
4.
5.
table 1
DISeaSe NotIfICatIoNS bY Year of oNSet of IllNeSS
#,NSw, 1991 to 2004
Conditions 1991 1992 1993 1994 1995 1996 1997 1998 1999 2000 2001 2002 2003 2004
AIDS 440 432 481 555 480 371 210 180 125 133 98 105 137 82
Adverse event after immunisation 9 31 23 40 28 56 70 95 16 42 111 177 219 183
Arbovirus infection: total* 409 343 656 381 539 1227 1804 783 1220 978 1191 661 1024 1147
Barmah Forest virus infection* 6 6 25 39 271 172 185 134 249 195 402 394 451 403
Ross River virus infection* 297 324 599 331 236 1031 1598 583 952 750 716 181 494 700
Arboviral other* 106 13 32 11 32 24 23 66 19 33 73 86 79 44
Blood lead level ≥ 15mg/dl* not notifiable until December 1996 710 874 691 988 513 517 338 298
Botulism 0 0 0 0 0 0 0 0 1 0 0 0 0 1
Brucellosis* 2 2 4 4 2 1 3 3 2 1 1 2 2 7
Chancroid* not notifiable until December 1998 1 0 0 0 0 0
Chlamydia* not notifiable until August 1998 2469 3504 4500 5824 7784 10020
Cholera* 1 0 1 0 1 3 1 1 2 0 1 1 0 1
Creutzfeldt-Jakob Disease not notifiable until April 2004 6
Cryptosporidiosis* not notifiable until December 1996 157 1130 121 133 195 306 202 357
Food-borne illness (NOS) 2765 253 106 213 270 211 255 201 151 147 56 41 1071 550
Gastroenteritis (institutional) 158 406 443 296 1359 554 939 738 673 697 775 1752 3583 12784
Giardiasis* not notifiable until August 1998 1091 978 967 863 1027 1232
Gonorrhoea* 392 491 382 357 428 522 636 1054 1291 1060 1364 1527 1330 1444
H.influenzae type b: total* 212 217 124 61 29 13 17 11 13 8 7 10 6 5
H.influenzae type b epiglottitis* 15 57 32 21 6 2 5 1 2 2 1 1 0 3
H.influenzae type b meningitis* 48 103 53 17 11 4 3 3 3 1 1 1 0 0
H.influenzae type b septicaemia* 11 26 24 12 8 3 1 4 6 4 2 3 1 2
H.influenzae type b infection (NOS)* 138 31 15 11 4 4 8 3 2 1 3 5 5 0
Hepatitis A* 1119 901 579 585 614 958 1426 927 421 201 197 149 124 137
Hepatitis B: total* 1491 3169 3603 3983 4007 3508 3170 2958 3515 3977 4563 3549 2845 2835
Hepatitis B: acute viral* 409 112 95 74 61 43 53 58 77 99 94 87 70 32
Hepatitis B: other* 1082 3057 3508 3909 3946 3465 3117 2900 3438 3878 4469 3462 2775 2803
Hepatitis C: total* 852 3895 5897 7823 6884 7003 6928 7213 8607 8298 8691 6702 5253 4974
Hepatitis C: acute viral* 22 26 22 16 32 18 19 112 112 222 295 153 121 12
Hepatitis C: other* 830 3869 5875 7807 6852 6985 6909 7101 8495 8076 8396 6549 5132 4962
Hepatitis D* 0 8 12 19 19 9 11 3 14 12 11 9 12 14
Hepatitis E* 0 0 1 2 0 3 6 4 7 9 6 6 6 8
HIV infection* 823 696 56 501 533 447 421 402 373 352 338 389 415 404
Haemolytic uraemic syndrome not notifiable until December 1996 3 6 11 9 2 7 5 9
Influenza: total* not notifiable until December 2000 244 1012 861 1012
Influenza: Type A* not notifiable until December 2000 216 770 767 823
Influenza: Type B* not notifiable until December 2000 27 241 55 162
Influenza; Type (NOS)* 1 1 39 27
Legionnaires’ disease: total* 37 104 66 60 75 74 33 46 41 41 68 44 60 79
Legionnaires’ disease: L. longbeachae* 0 14 13 8 16 30 9 19 12 12 29 21 37 27
Legionnaires’ disease: L. pneumophila* 16 80 34 30 35 34 18 22 22 26 38 22 23 51
Legionnaires’ disease: other* 21 10 19 22 24 10 6 5 7 3 1 1 0 1
Leprosy 1 7 5 3 3 2 0 0 1 2 4 0 2 3
Leptospirosis* 28 21 16 14 6 33 33 50 56 54 66 39 39 40
Listeriosis* 11 13 12 10 14 22 23 28 22 18 12 11 28 30
Malaria* 171 110 174 184 96 203 173 158 174 232 157 105 120 101
Measles: total 496 805 2348 1484 596 191 273 119 32 36 31 8 18 12
Measles: laboratory confirmed* 20 76 460 302 138 35 98 19 13 22 18 6 14 11
Measles: other 476 729 1888 1182 458 156 175 100 19 14 13 2 4 1
Meningococcal disease (invasive): total 128 121 153 142 113 161 219 186 221 253 234 216 202 148
Meningococcal disease: type B* 0 3 7 7 23 36 54 55 95 93 90 105 100 81
Meningococcal disease: type C* 0 4 6 9 8 35 55 55 60 64 38 54 45 24
Meningococcal disease: type W135* 0 0 0 0 1 0 2 4 4 4 2 2 2 5
Meningococcal disease: type Y* 0 0 1 1 0 1 0 7 1 7 2 2 5 3
Meningococcal disease: other 128 114 139 125 81 89 108 65 61 85 102 53 50 35
Mumps* 8 23 13 11 14 27 29 39 33 92 28 29 35 65
Paratyphoid* 20 8 9 11 12 15 5 9 5 14 11 13 22 10
Pertussis 49 217 1533 1405 1369 1156 4246 2309 1415 3687 4438 2012 2770 3540
Pneumococcal disease: invasive* not notifiable until December 2000 444 861 800 905
Psittacosis* not notifiable until December 2000 38 155 87 80
Q fever* 167 213 403 267 201 287 258 236 164 131 143 309 287 222
Rubella: total* 60 324 1186 233 2376 636 153 78 46 191 58 35 24 18
Rubella* 59 324 1184 229 2375 631 153 78 45 191 58 35 23 17
Rubella: congenital* 1 0 2 4 1 5 0 0 1 0 0 0 1 1
Salmonellosis* 1170 802 980 1101 1366 1224 1698 1812 1438 1396 1643 2100 1838 2132
Shigellosis* not notifiable until December 2000 134 85 59 96
Syphilis: total 579 873 732 966 834 662 512 612 585 581 546 647 843 1047
Syphilis: infectious*+ 1 3 6 29 132 72 57 45 87 81 67 128 245 301
Syphilis: congenital 1 1 0 2 6 3 3 0 3 3 3 3 7 0
Syphilis: other* 577 869 726 935 696 587 452 567 495 497 476 516 591 746
Tetanus 5 2 5 4 0 1 3 3 1 2 0 0 1 0
Tuberculosis* 429 394 389 394 443 410 422 382 484 448 416 447 386 426
Typhoid* 38 20 28 25 27 30 28 18 32 28 32 26 16 39
Verotoxigenic Escherichia coli infections* not notifiable until December 1996 0 2 0 1 1 5 2 3 # year of onset = the earlier of patient reported onset date, specimen date or date of notification; * laboratory-confirmed cases only;
NOS = not otherwise specified; + includes syphilis primary, syphilis secondary, syphilis < 1 yr duration and syphilis-newly acquired
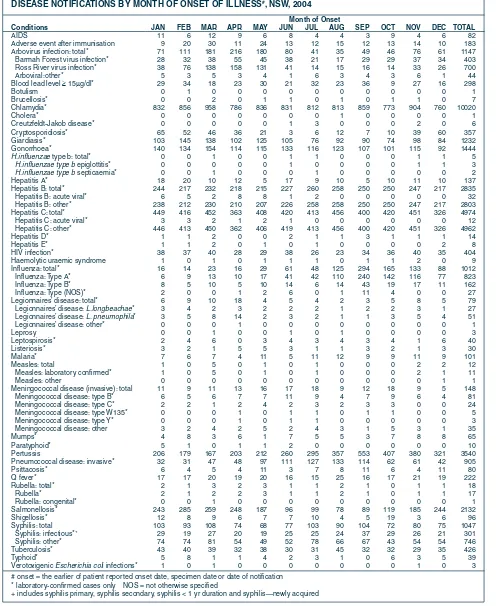
table 2
DISeaSe NotIfICatIoNS bY MoNtH of oNSet of IllNeSS
#, NSw, 2004
Month of onset
Conditions JaN feb Mar aPr MaY JuN Jul auG SeP oCt NoV DeC total
AIDS 11 6 12 9 6 8 4 4 3 9 4 6 82
Adverse event after immunisation 9 20 30 11 24 13 12 15 12 13 14 10 183
Arbovirus infection: total* 71 111 181 216 180 80 41 35 49 46 76 61 1147
Barmah Forest virus infection* 28 32 38 55 45 38 21 17 29 29 37 34 403
Ross River virus infection* 38 76 138 158 131 41 14 15 16 14 33 26 700
Arboviral:other* 5 3 5 3 4 1 6 3 4 3 6 1 44
Blood lead level ≥ 15mg/dl* 29 34 18 23 30 21 32 23 36 9 27 16 298
Botulism 0 1 0 0 0 0 0 0 0 0 0 0 1
Brucellosis* 0 0 2 0 1 1 0 1 0 1 1 0 7
Chlamydia* 832 856 958 786 836 831 812 813 859 773 904 760 10020
Cholera* 0 0 0 0 0 0 0 1 0 0 0 0 1
Creutzfeldt-Jakob disease* 0 0 0 0 0 1 3 0 0 0 2 0 6
Cryptosporidiosis* 65 52 46 36 21 3 6 12 7 10 39 60 357
Giardiasis* 103 145 138 102 125 105 76 92 90 74 98 84 1232
Gonorrhoea* 140 134 154 114 115 133 116 123 107 101 115 92 1444
H.influenzae type b: total* 0 0 1 0 0 1 1 0 0 0 1 1 5
H.influenzae type b epiglottitis* 0 0 0 0 0 1 0 0 0 0 1 1 3
H.influenzae type b septicaemia* 0 0 1 0 0 0 1 0 0 0 0 0 2
Hepatitis A* 18 20 10 12 5 17 9 10 5 10 11 10 137
Hepatitis B: total* 244 217 232 218 215 227 260 258 250 250 247 217 2835
Hepatitis B: acute viral* 6 5 2 8 8 1 2 0 0 0 0 0 32
Hepatitis B: other* 238 212 230 210 207 226 258 258 250 250 247 217 2803
Hepatitis C: total* 449 416 452 363 408 420 413 456 400 420 451 326 4974
Hepatitis C: acute viral* 3 3 2 1 2 1 0 0 0 0 0 0 12
Hepatitis C: other* 446 413 450 362 406 419 413 456 400 420 451 326 4962
Hepatitis D* 1 1 2 0 0 2 1 1 3 1 1 1 14
Hepatitis E* 1 1 2 0 1 0 1 0 0 0 0 2 8
HIV infection* 38 37 40 28 29 38 26 23 34 36 40 35 404
Haemolytic uraemic syndrome 1 0 1 0 1 1 1 0 1 1 2 0 9
Influenza: total* 16 14 23 16 29 61 48 125 294 165 133 88 1012
Influenza: Type A* 6 9 13 10 17 41 42 110 240 142 116 77 823
Influenza: Type B* 8 5 10 5 10 14 6 14 43 19 17 11 162
Influenza: Type (NOS)* 2 0 0 1 2 6 0 1 11 4 0 0 27
Legionnaires’ disease: total* 6 9 10 18 4 5 4 2 3 5 8 5 79
Legionnaires’ disease: L.longbeachae* 3 4 2 3 2 2 2 1 2 2 3 1 27
Legionnaires’ disease: L. pneumophila* 3 5 8 14 2 3 2 1 1 3 5 4 51
Legionnaires’ disease: other* 0 0 0 1 0 0 0 0 0 0 0 0 1
Leprosy 0 0 1 0 0 1 0 1 0 0 0 0 3
Leptospirosis* 2 4 6 0 3 4 3 4 3 4 1 6 40
Listeriosis* 3 2 1 5 5 3 1 1 3 2 1 3 30
Malaria* 7 6 7 4 11 5 11 12 9 9 11 9 101
Measles: total 1 0 5 0 1 0 1 0 0 0 2 2 12
Measles: laboratory confirmed* 1 0 5 0 1 0 1 0 0 0 2 1 11
Measles: other 0 0 0 0 0 0 0 0 0 0 0 1 1
Meningococcal disease (invasive): total 11 9 11 13 16 17 18 9 12 18 9 5 148
Meningococcal disease: type B* 6 5 6 7 7 11 9 4 7 9 6 4 81
Meningococcal disease: type C* 2 2 1 2 4 2 3 2 3 3 0 0 24
Meningococcal disease: type W135* 0 0 0 1 0 1 1 0 1 1 0 0 5
Meningococcal disease: type Y* 0 0 0 1 0 1 1 0 0 0 0 0 3
Meningococcal disease: other 3 2 4 2 5 2 4 3 1 5 3 1 35
Mumps* 4 8 3 6 1 7 5 5 3 7 8 8 65
Paratyphoid* 5 1 0 1 1 2 0 0 0 0 0 0 10
Pertussis 206 179 167 203 212 260 295 357 553 407 380 321 3540
Pneumococcal disease: invasive* 32 31 47 48 97 111 127 133 114 62 61 42 905
Psittacosis* 6 4 5 4 11 3 7 8 11 6 4 11 80
Q fever* 17 17 20 19 20 16 15 25 16 17 21 19 222
Rubella: total* 2 1 3 2 3 1 1 2 1 0 1 1 18
Rubella* 2 1 2 2 3 1 1 2 1 0 1 1 17
Rubella: congenital* 0 0 1 0 0 0 0 0 0 0 0 0 1
Salmonellosis* 243 285 259 248 187 96 99 78 89 119 185 244 2132
Shigellosis* 12 8 9 6 7 7 10 4 5 19 3 6 96
Syphilis: total 103 93 108 74 68 77 103 90 104 72 80 75 1047
Syphilis: infectious*+ 29 19 27 20 19 25 25 24 37 29 26 21 301
Syphilis: other* 74 74 81 54 49 52 78 66 67 43 54 54 746
Tuberculosis* 43 40 39 32 38 30 31 45 32 32 29 35 426
Typhoid* 5 8 1 1 4 2 3 1 0 6 3 5 39
Verotoxigenic Escherichia coli infections* 1 0 1 0 0 0 0 0 0 0 1 0 3
# onset = the earlier of patient reported onset date, specimen date or date of notification * laboratory-confirmed cases only NOS = not otherwise specified
table 3
DISeaSe NotIfICatIoNS bY area HealtH SerVICe of reSIDeNCe (2005 aHS bouNDarIeS), CruDe rateS
Per 100,000 PoPulatIoN, NSw, 2004
#Greater Southern Greater western Hunter/ New england North Coast
Conditions GMa Sa fwa MaC Mwa HuN Nea MNC Nra
AIDS 0.0 0.0 0.0 0.0 0.0 0.2 0.0 0.4 1.5
Adverse event after immunisation 14.7 13.9 0.0 4.7 6.3 1.6 0.6 2.5 1.1
Arbovirus infection: total* 18.5 15.4 58.2 26.5 11.5 21.0 60.4 130.4 101.6
Barmah Forest virus infection* 5.7 3.5 6.2 1.9 0.0 5.3 7.8 70.9 43.3
Ross River virus infection* 12.4 8.0 49.9 24.6 10.4 15.0 50.4 59.1 57.2
Arboviral: other* 0.4 4.0 2.1 0.0 1.2 0.7 2.2 0.4 1.1
Blood lead level ≥ 15mg/dl* 0.4 1.5 58.2 18.9 2.9 10.6 2.8 2.2 5.1
Botulism 0.0 0.0 0.0 0.9 0.0 0.0 0.0 0.0 0.0
Brucellosis* 0.4 0.0 0.0 0.0 0.0 0.0 0.0 0.4 0.0
Chlamydia* 135.6 98.1 193.2 132.5 150.9 172.2 199.5 136.5 157.7
Cholera* 0.0 0.0 0.0 0.0 0.0 0.0 0.0 0.0 0.0
Creutzfeldt-Jakob disease* 0.4 0.0 0.0 0.0 0.0 0.2 0.0 0.0 0.0
Cryptosporidiosis* 10.2 2.5 2.1 24.6 8.1 3.7 8.9 12.2 6.6
Giardiasis* 8.7 13.0 20.8 21.8 26.5 14.1 29.4 10.1 1.5
Gonorrhoea* 2.6 3.5 12.5 8.5 7.5 7.6 10.0 10.1 16.4
H.influenzae type b: total* 0.0 0.0 0.0 0.0 0.0 0.2 0.0 0.0 0.0
H.influenzae type b epiglottitis* 0.0 0.0 0.0 0.0 0.0 0.2 0.0 0.0 0.0
H.influenzae type b septicaemia* 0.0 0.0 0.0 0.0 0.0 0.0 0.0 0.0 0.0
Hepatitis A* 0.0 0.5 2.1 0.9 1.2 0.0 3.3 2.5 1.8
Hepatitis B: total* 8.3 7.0 41.5 16.1 8.6 9.5 12.2 6.8 7.6
Hepatitis B: acute viral* 0.0 0.0 0.0 0.0 0.0 0.7 0.0 0.4 0.4
Hepatitis B: other* 8.3 7.0 41.5 16.1 8.6 8.8 12.2 6.5 7.3
Hepatitis C: total* 41.4 57.8 85.2 83.3 74.9 57.2 40.4 90.0 87.8
Hepatitis C: acute viral* 0.0 2.0 0.0 0.0 0.0 0.2 0.6 0.0 0.0
Hepatitis C: other* 41.4 55.8 85.2 83.3 74.9 57.0 39.9 90.0 87.8
Hepatitis D* 0.0 0.0 0.0 0.0 0.6 0.0 0.0 0.0 0.7
Hepatitis E* 0.0 0.0 0.0 0.0 0.0 0.2 0.0 0.0 0.0
HIV infection* 1.5 0.0 2.1 0.9 1.2 2.3 2.2 1.1 2.2
Haemolytic uraemic syndrome 0.4 0.5 0.0 0.0 0.0 0.0 0.6 0.0 0.0
Influenza: total* 3.0 5.0 0.0 19.9 5.2 12.2 1.1 3.6 11.3
Influenza: type A* 2.6 4.5 0.0 18.9 5.2 8.7 1.1 2.9 9.5
Influenza: type B* 0.4 0.5 0.0 0.9 0.0 3.5 0.0 0.7 1.8
Influenza: : NOS* 0.0 0.0 0.0 0.0 0.0 0.0 0.0 0.0 0.0
Legionnaires’ disease: total* 0.4 0.5 0.0 0.0 3.5 0.2 0.6 0.4 0.0
Legionnaires’ disease: L.longbeachae* 0.0 0.5 0.0 0.0 1.7 0.0 0.6 0.4 0.0
Legionnaires’ disease: L. pneumophila* 0.4 0.0 0.0 0.0 1.7 0.2 0.0 0.0 0.0
Legionnaires’ disease: other* 0.0 0.0 0.0 0.0 0.0 0.0 0.0 0.0 0.0
Leprosy 0.0 0.0 0.0 0.0 0.0 0.0 0.0 0.0 0.0
Leptospirosis* 0.0 0.5 0.0 0.9 1.2 1.1 6.6 1.4 3.3
Listeriosis* 0.0 0.0 0.0 0.0 0.0 0.2 0.0 0.0 0.7
Malaria* 3.4 0.5 0.0 0.0 0.0 1.6 0.0 0.4 0.7
Measles: total 0.0 0.0 2.1 0.0 0.0 0.0 0.0 0.0 0.4
Measles Lab Confirm* 0.0 0.0 0.0 0.0 0.0 0.0 0.0 0.0 0.4
Measles: other 0.0 0.0 2.1 0.0 0.0 0.0 0.0 0.0 0.0
Meningococcal disease (invasive): total 1.5 2.0 4.2 2.8 1.7 3.7 1.1 0.7 1.8
Meningococcal disease: type B* 0.8 0.0 0.0 0.9 1.7 3.2 0.6 0.4 1.5
Meningococcal disease: type C* 0.8 2.0 0.0 0.0 0.0 0.4 0.6 0.0 0.0
Meningococcal disease: type W135* 0.0 0.0 2.1 0.0 0.0 0.2 0.0 0.0 0.0
Meningococcal disease: type Y* 0.0 0.0 0.0 0.0 0.0 0.0 0.0 0.0 0.4
Meningococcal disease: other 0.0 0.0 2.1 1.9 0.0 0.0 0.0 0.4 0.0
Mumps* 0.4 0.0 0.0 2.8 0.0 0.5 0.0 0.0 0.0
Paratyphoid* 0.0 0.0 0.0 0.0 0.0 0.0 0.0 0.0 0.0
Pertussis 46.7 42.8 16.6 216.8 42.1 74.7 32.1 32.1 41.5
Pneumococcal disease: invasive* 10.5 12.0 16.6 10.4 12.1 19.4 5.0 13.0 8.4
Psittacosis* 3.0 0.5 0.0 0.9 2.3 4.1 5.5 1.4 1.8
Q fever* 1.9 4.0 22.9 61.5 3.5 2.1 29.9 7.6 8.4
Rubella: total* 0.0 0.0 0.0 0.0 0.0 0.0 0.0 0.0 0.4
Rubella* 0.0 0.0 0.0 0.0 0.0 0.0 0.0 0.0 0.4
Rubella: congenital* 0.0 0.0 0.0 0.0 0.0 0.0 0.0 0.0 0.0
Salmonellosis* 27.9 19.9 35.3 31.2 23.6 23.0 56.5 37.8 71.4
Shigellosis* 0.8 0.0 6.2 0.0 1.7 0.4 5.0 1.1 3.3
Syphilis: total 3.4 2.0 45.7 6.6 7.5 3.0 7.2 2.5 8.0
Syphilis: infectious*+ 2.3 0.0 2.1 0.0 0.6 1.6 1.7 0.0 3.3
Syphilis: other* 1.1 2.0 43.6 6.6 6.9 1.4 5.5 2.5 4.7
Tuberculosis* 0.8 1.5 4.2 0.9 0.6 2.1 0.0 2.2 0.7
Typhoid* 0.0 0.0 2.1 0.0 0.0 0.0 0.6 0.0 0.0
Verotoxigenic Escherichia coli infections* 0.0 0.0 0.0 0.0 0.0 0.0 0.0 0.0 0.0
# year of onset =the earlier of patient reported onset date, specimen date or date of notification * laboratory-confirmed cases only NOS = not otherwise specified
+ includes syphilis primary, syphilis secondary, syphilis < 1 yr duration and syphilis-newly acquired Area health service population estimates 2004:
CCA = Central Coast Area (309 425) CSA = Central Sydney Area (503 030) FWA = Far West Area (47 656) GMA = Greater Murray Area (258 985) HUN = Hunter Area (547 325) ILL = Illawarra Area (355 533) MAC = Macquarie Area (103 907) MNC = Mid North Coast Area (270 433)
table 3
continued
DISeaSe NotIfICatIoNS bY area HealtH SerVICe of reSIDeNCe (2005 aHS bouNDarIeS), CruDe rateS
Per 100,000 PoPulatIoN, NSw, 2004
#Northern Sydney/
Central Coast South eastern Syd/ Illawarra Sydney South west Sydney west
Conditions CCa NSa Ill SeS CSa SwS weN wSa total (a)
AIDS 0.7 0.2 1.1 3.3 3.4 0.7 0.6 0.9 1.2
Adverse event after immunisation 4.2 1.0 0.5 2.4 1.4 1.5 1.9 1.8 2.7
Arbovirus infection: total* 8.1 3.0 5.4 1.9 0.8 0.8 4.3 1.4 17.0
Barmah Forest virus infection* 1.3 0.4 1.6 0.1 0.2 0.0 0.3 0.0 6.0
Ross River virus infection* 6.8 1.9 3.8 1.1 0.6 0.6 3.4 0.9 10.4
Arboviral: other* 0.0 0.7 0.0 0.6 0.0 0.2 0.6 0.4 0.7
Blood lead level ≥ 15mg/dl** 2.9 1.6 5.2 0.9 2.6 5.6 2.8 5.4 4.4
Botulism 0.0 0.0 0.0 0.0 0.0 0.0 0.0 0.0 0.0
Brucellosis* 0.0 0.0 0.0 0.1 0.4 0.1 0.0 0.1 0.1
Chlamydia* 116.6 137.1 102.1 236.1 220.7 86.9 94.3 107.3 148.4
Cholera* 0.0 0.0 0.0 0.0 0.0 0.0 0.3 0.0 0.0
Creutzfeldt-Jakob disease* 0.0 0.2 0.0 0.0 0.0 0.0 0.6 0.0 0.1
Cryptosporidiosis* 1.3 2.6 2.4 7.0 5.0 3.5 5.9 4.1 5.3
Giardiasis* 17.3 27.4 12.2 25.9 18.2 10.3 21.6 22.2 18.2
Gonorrhoea* 4.9 12.3 10.3 73.0 69.5 8.7 6.5 9.5 21.4
H.influenzae type b: total* 0.0 0.0 0.0 0.1 0.0 0.0 0.6 0.0 0.1
H.influenzae type b epiglottitis* 0.0 0.0 0.0 0.1 0.0 0.0 0.0 0.0 0.0
H.influenzae type b septicaemia* 0.0 0.0 0.0 0.0 0.0 0.0 0.6 0.0 0.0
Hepatitis A* 2.3 2.2 0.8 1.4 4.2 3.2 0.3 3.7 2.0
Hepatitis B: total* 13.4 40.8 7.1 49.6 103.1 88.5 15.1 66.7 42.0
Hepatitis B: acute viral* 0.0 0.2 0.8 0.9 0.6 1.1 0.0 0.0 0.5
Hepatitis B: other* 13.4 40.5 6.2 48.7 102.5 87.4 15.1 66.7 41.5
Hepatitis C: total* 74.3 30.3 61.4 72.1 92.3 81.2 55.3 54.2 73.7
Hepatitis C: acute viral* 0.0 0.1 0.5 0.0 0.0 0.0 0.0 0.0 0.2
Hepatitis C: other* 74.3 30.2 60.8 72.1 92.3 81.2 55.3 54.2 73.5
Hepatitis D* 0.0 0.0 0.3 0.1 0.0 0.5 0.0 0.5 0.2
Hepatitis E* 0.0 0.0 0.0 0.5 0.2 0.1 0.3 0.0 0.1
HIV infection* 3.3 3.1 3.5 17.1 20.2 2.8 1.5 3.7 6.0
Haemolytic uraemic syndrome 0.3 0.1 0.3 0.0 0.0 0.2 0.3 0.0 0.1
Influenza: total* 2.6 14.3 4.1 39.8 16.0 16.0 5.3 21.9 15.0
Influenza: type A* 2.3 12.8 3.8 31.3 8.6 13.7 4.6 19.2 12.2
Influenza: type B* 0.3 1.0 0.0 8.4 3.2 2.3 0.3 2.7 2.4
Influenza: : NOS* 0.0 0.5 0.3 0.0 4.2 0.0 0.3 0.0 0.4
Legionnaires’ disease: total* 1.3 1.0 4.9 2.3 0.6 0.6 0.9 1.1 1.2
Legionnaires’ disease: L.longbeachae* 0.7 0.1 2.4 0.4 0.0 0.1 0.3 0.4 0.4
Legionnaires’ disease: L. pneumophila* 0.7 0.9 2.4 1.8 0.6 0.5 0.6 0.7 0.8
Legionnaires’ disease: other* 0.0 0.0 0.0 0.1 0.0 0.0 0.0 0.0 0.0
Leprosy 0.0 0.0 0.0 0.0 0.2 0.1 0.0 0.1 0.0
Leptospirosis* 0.0 0.1 0.3 0.1 0.0 0.1 0.0 0.0 0.6
Listeriosis* 0.3 0.9 0.0 1.5 0.4 0.2 0.9 0.0 0.4
Malaria* 0.7 1.5 0.5 1.9 1.0 1.8 1.2 2.7 1.5
Measles: total 0.0 0.0 0.0 0.6 0.2 0.1 0.3 0.3 0.2
Measles Lab Confirm* 0.0 0.0 0.0 0.6 0.2 0.1 0.3 0.3 0.2
Measles: other 0.0 0.0 0.0 0.0 0.0 0.0 0.0 0.0 0.0
Meningococcal disease (invasive): total 1.0 2.4 3.3 2.9 3.0 1.7 1.9 1.4 2.2
Meningococcal disease: type B* 1.0 0.7 1.6 1.3 2.0 0.8 1.2 0.7 1.2
Meningococcal disease: type C* 0.0 0.7 0.5 0.4 0.2 0.2 0.3 0.0 0.4
Meningococcal disease: type W135* 0.0 0.1 0.0 0.3 0.0 0.0 0.0 0.0 0.1
Meningococcal disease: type Y* 0.0 0.0 0.0 0.0 0.0 0.1 0.3 0.0 0.0
Meningococcal disease: other 0.0 0.7 1.1 1.0 0.8 0.5 0.0 0.7 0.5
Mumps* 1.0 1.9 1.6 1.5 1.6 0.7 0.3 0.8 1.0
Paratyphoid* 0.0 0.1 0.0 0.3 0.0 0.4 0.0 0.4 0.1
Pertussis 37.1 43.7 39.1 66.6 55.3 37.1 70.5 52.2 52.4
Pneumococcal disease: invasive* 16.3 12.0 12.8 14.6 14.8 10.9 15.8 14.6 13.4
Psittacosis* 0.0 0.2 1.6 0.4 0.2 0.4 2.2 0.3 1.2
Q fever* 0.7 0.2 1.9 0.1 0.0 0.4 0.0 0.3 3.3
Rubella: total* 0.3 0.5 0.8 0.5 0.8 0.0 0.0 0.1 0.3
Rubella* 0.3 0.5 0.8 0.5 0.6 0.0 0.0 0.1 0.3
Rubella: congenital* 0.0 0.0 0.0 0.0 0.2 0.0 0.0 0.0 0.0
Salmonellosis* 29.3 30.8 16.3 31.0 29.4 28.1 37.7 31.8 31.6
Shigellosis* 1.0 1.5 0.0 1.4 2.2 0.7 0.0 3.0 1.4
Syphilis: total 7.2 11.8 4.3 30.8 39.8 29.6 4.6 11.5 15.5
Syphilis: infectious*+ 0.3 0.5 1.1 20.0 15.4 0.8 0.0 2.6 4.5
Syphilis: other* 6.8 11.3 3.3 10.8 24.4 28.7 4.6 8.9 11.0
Tuberculosis* 2.9 5.6 0.8 9.9 15.0 9.3 4.6 11.8 6.3
Typhoid* 0.0 0.2 0.0 1.1 0.4 1.0 0.0 2.2 0.6
Verotoxigenic Escherichia coli infections* 0.0 0.0 0.0 0.3 0.0 0.0 0.3 0.0 0.0
# year of onset =the earlier of patient reported onset date, specimen date or date of notification * laboratory-confirmed cases only NOS = not otherwise specified
(a) = includes cases from Justice Health Service and with unknown public health unit
table 4
NuMber of DISeaSe NotIfICatIoNS bY area HealtH SerVICe of reSIDeNCe (2005 aHS bouNDarIeS),
NSw, 2004
#Greater Southern Greater western Hunter/ New england North Coast
Conditions GMa Sa fwa MaC Mwa HuN Nea MNC Nra
AIDS 0 0 0 0 0 1 0 1 4
Adverse event after immunisation 39 28 0 5 11 9 1 7 3
Arbovirus infection: total* 49 31 28 28 20 119 109 362 279
Barmah Forest virus infection* 15 7 3 2 0 30 14 197 119
Ross River virus infection* 33 16 24 26 18 85 91 164 157
Arboviral: other* 1 8 1 0 2 4 4 1 3
Blood lead level ≥ 15mg/dl* 1 3 28 20 5 60 5 6 14
Botulism 0 0 0 1 0 0 0 0 0
Brucellosis* 1 0 0 0 0 0 0 1 0
Chlamydia* 360 197 93 140 262 975 360 379 433
Cholera* 0 0 0 0 0 0 0 0 0
Creutzfeldt-Jakob disease* 1 0 0 0 0 1 0 0 0
Cryptosporidiosis* 27 5 1 26 14 21 16 34 18
Giardiasis* 23 26 10 23 46 80 53 28 4
Gonorrhoea* 7 7 6 9 13 43 18 28 45
H.influenzae type b: total* 0 0 0 0 0 1 0 0 0
H.influenzae type b epiglottitis* 0 0 0 0 0 1 0 0 0
H.influenzae type b septicaemia* 0 0 0 0 0 0 0 0 0
Hepatitis A* 0 1 1 1 2 0 6 7 5
Hepatitis B: total* 22 14 20 17 15 54 22 19 21
Hepatitis B: acute viral* 0 0 0 0 0 4 0 1 1
Hepatitis B: other* 22 14 20 17 15 50 22 18 20
Hepatitis C: total* 110 116 41 88 130 324 73 250 241
Hepatitis C: acute viral* 0 4 0 0 0 1 1 0 0
Hepatitis C: other* 110 112 41 88 130 323 72 250 241
Hepatitis D* 0 0 0 0 1 0 0 0 2
Hepatitis E* 0 0 0 0 0 1 0 0 0
HIV infection* 4 0 1 1 2 13 4 3 6
Haemolytic uraemic syndrome 1 1 0 0 0 0 1 0 0
Influenza: total* 8 10 0 21 9 69 2 10 31
Influenza: type A* 7 9 0 20 9 49 2 8 26
Influenza: type B* 1 1 0 1 0 20 0 2 5
Influenza: : NOS* 0 0 0 0 0 0 0 0 0
Legionnaires’ disease: total* 1 1 0 0 6 1 1 1 0
Legionnaires’ disease: L.longbeachae* 0 1 0 0 3 0 1 1 0
Legionnaires’ disease: L. pneumophila* 1 0 0 0 3 1 0 0 0
Legionnaires’ disease: other* 0 0 0 0 0 0 0 0 0
Leprosy 0 0 0 0 0 0 0 0 0
Leptospirosis* 0 1 0 1 2 6 12 4 9
Listeriosis* 0 0 0 0 0 1 0 0 2
Malaria* 9 1 0 0 0 9 0 1 2
Measles: total 0 0 1 0 0 0 0 0 1
Measles Lab Confirm* 0 0 0 0 0 0 0 0 1
Measles: other 0 0 1 0 0 0 0 0 0
Meningococcal disease (invasive): total 4 4 2 3 3 21 2 2 5
Meningococcal disease: type B* 2 0 0 1 3 18 1 1 4
Meningococcal disease: type C* 2 4 0 0 0 2 1 0 0
Meningococcal disease: type W135* 0 0 1 0 0 1 0 0 0
Meningococcal disease: type Y* 0 0 0 0 0 0 0 0 1
Meningococcal disease: other 0 0 1 2 0 0 0 1 0
Mumps* 1 0 0 3 0 3 0 0 0
Paratyphoid* 0 0 0 0 0 0 0 0 0
Pertussis 124 86 8 229 73 423 58 89 114
Pneumococcal disease: invasive* 28 24 8 11 21 110 9 36 23
Psittacosis* 8 1 0 1 4 23 10 4 5
Q fever* 5 8 11 65 6 12 54 21 23
Rubella: total* 0 0 0 0 0 0 0 0 1
Rubella* 0 0 0 0 0 0 0 0 1
Rubella: congenital* 0 0 0 0 0 0 0 0 0
Salmonellosis* 74 40 17 33 41 130 102 105 196
Shigellosis* 2 0 3 0 3 2 9 3 9
Syphilis: total 9 4 22 7 13 17 13 7 22
Syphilis: infectious*+ 6 0 1 0 1 9 3 0 9
Syphilis: other* 3 4 21 7 12 8 10 7 13
Tuberculosis* 2 3 2 1 1 12 0 6 2
Typhoid* 0 0 1 0 0 0 1 0 0
Verotoxigenic Escherichia coli infections* 0 0 0 0 0 0 0 0 0
# year of onset =the earlier of patient reported onset date, specimen date or date of notification * laboratory-confirmed cases only NOS = not otherwise specified
+ includes syphilis primary, syphilis secondary, syphilis < 1 yr duration and syphilis-newly acquired Area health service population estimates 2004:
CCA = Central Coast Area (309 425) CSA = Central Sydney Area (503 030) FWA = Far West Area (47 656) GMA = Greater Murray Area (258 985) HUN = Hunter Area (547 325) ILL = Illawarra Area (355 533) MAC = Macquarie Area (103 907) MNC = Mid North Coast Area (270 433)
table 4
continued
NuMber of DISeaSe NotIfICatIoNS bY area HealtH SerVICe of reSIDeNCe (2005 aHS bouNDarIeS),
NSw, 2004
#Northern Sydney/
Central Coast South eastern Syd/ Illawarra Sydney South west Sydney west
Conditions CCa NSa Ill SeS CSa SwS weN wSa total (a)
AIDS 2 2 4 26 17 6 2 7 82
Adverse event after immunisation 13 8 2 19 7 12 6 13 183
Arbovirus infection: total* 25 24 20 15 4 7 14 10 1147
Barmah Forest virus infection* 4 3 6 1 1 0 1 0 403
Ross River virus infection* 21 15 14 9 3 5 11 7 700
Arboviral: other* 0 6 0 5 0 2 2 3 44
Blood lead level ≥ 15mg/dl* 9 13 19 7 13 46 9 40 298
Botulism 0 0 0 0 0 0 0 0 1
Brucellosis* 0 0 0 1 2 1 0 1 7
Chlamydia* 358 1099 376 1876 1102 717 305 794 10020
Cholera* 0 0 0 0 0 0 1 0 1
Creutzfeldt-Jakob disease* 0 2 0 0 0 0 2 0 6
Cryptosporidiosis* 4 21 9 56 25 29 19 30 357
Giardiasis* 53 220 45 206 91 85 70 164 1232
Gonorrhoea* 15 99 38 580 347 72 21 70 1444
H.influenzae type b: total* 0 0 0 1 0 0 2 0 5
H.influenzae type b epiglottitis* 0 0 0 1 0 0 0 0 3
H.influenzae type b septicaemia* 0 0 0 0 0 0 2 0 2
Hepatitis A* 7 18 3 11 21 26 1 27 137
Hepatitis B: total* 41 327 26 394 515 730 49 493 2835
Hepatitis B: acute viral* 0 2 3 7 3 9 0 0 32
Hepatitis B: other* 41 325 23 387 512 721 49 493 2803
Hepatitis C: total* 228 243 226 573 461 670 179 401 4974
Hepatitis C: acute viral* 0 1 2 0 0 0 0 0 12
Hepatitis C: other* 228 242 224 573 461 670 179 401 4962
Hepatitis D* 0 0 1 1 0 4 0 4 14
Hepatitis E* 0 0 0 4 1 1 1 0 8
HIV infection* 10 25 13 136 101 23 5 27 404
Haemolytic uraemic syndrome 1 1 1 0 0 2 1 0 9
Influenza: total* 8 115 15 316 80 132 17 162 1012
Influenza: type A* 7 103 14 249 43 113 15 142 823
Influenza: type B* 1 8 0 67 16 19 1 20 162
Influenza: : NOS* 0 4 1 0 21 0 1 0 27
Legionnaires’ disease: total* 4 8 18 18 3 5 3 8 79
Legionnaires’ disease: L.longbeachae* 2 1 9 3 0 1 1 3 27
Legionnaires’ disease: L. pneumophila* 2 7 9 14 3 4 2 5 51
Legionnaires’ disease: other* 0 0 0 1 0 0 0 0 1
Leprosy 0 0 0 0 1 1 0 1 3
Leptospirosis* 0 1 1 1 0 1 0 0 40
Listeriosis* 1 7 0 12 2 2 3 0 30
Malaria* 2 12 2 15 5 15 4 20 101
Measles: total 0 0 0 5 1 1 1 2 12
Measles Lab Confirm* 0 0 0 5 1 1 1 2 11
Measles: other 0 0 0 0 0 0 0 0 1
Meningococcal disease (invasive): total 3 19 12 23 15 14 6 10 148
Meningococcal disease: type B* 3 6 6 10 10 7 4 5 81
Meningococcal disease: type C* 0 6 2 3 1 2 1 0 24
Meningococcal disease: type W135* 0 1 0 2 0 0 0 0 5
Meningococcal disease: type Y* 0 0 0 0 0 1 1 0 3
Meningococcal disease: other 0 6 4 8 4 4 0 5 35
Mumps* 3 15 6 12 8 6 1 6 65
Paratyphoid* 0 1 0 2 0 3 0 3 10
Pertussis 114 350 144 529 276 306 228 386 3540
Pneumococcal disease: invasive* 50 96 47 116 74 90 51 108 905
Psittacosis* 0 2 6 3 1 3 7 2 80
Q fever* 2 2 7 1 0 3 0 2 222
Rubella: total* 1 4 3 4 4 0 0 1 18
Rubella* 1 4 3 4 3 0 0 1 17
Rubella: congenital* 0 0 0 0 1 0 0 0 1
Salmonellosis* 90 247 60 246 147 232 122 235 2132
Shigellosis* 3 12 0 11 11 6 0 22 96
Syphilis: total 22 95 16 245 199 244 15 85 1047
Syphilis: infectious*+ 1 4 4 159 77 7 0 19 301
Syphilis; other* 21 91 12 86 122 237 15 66 746
Tuberculosis* 9 45 3 79 75 77 15 87 426
Typhoid* 0 2 0 9 2 8 0 16 39
Verotoxigenic Escherichia coli infections* 0 0 0 2 0 0 1 1 3
# year of onset =the earlier of patient reported onset date, specimen date or date of notification * laboratory-confirmed cases only NOS = not otherwise specified
(a) = includes cases from Justice Health Service and with unknown public health unit
table 5
DISeaSe NotIfICatIoNS bY aGe GrouP aND SeX of tHe CaSe, NSw, 2004
#0–4 yrs 5–24 yrs 25–44 yrs 45–64 yrs 65 + yrs Total (a)
Conditions M f M f M f M f M f M f total
AIDS 0 0 0 0 41 4 32 1 2 1 75 6 82b
Adverse event after immunisation 38 35 36 43 2 13 4 7 4 1 84 99 183
Arbovirus infection: total* 4 3 56 53 210 240 248 197 70 63 588 556 1147a
Barmah Forest virus infection* 1 1 23 16 62 71 96 69 33 28 215 185 403a
Ross River virus infection* 3 2 26 33 137 158 147 124 36 34 349 351 700
Arboviral: other* 0 0 7 4 11 11 5 4 1 1 24 20 44
Blood lead level ≥ 15mg/dl* 44 17 27 2 108 5 82 7 6 0 267 31 298
Botulism 0 1 0 0 0 0 0 0 0 0 0 1 1
Brucellosis* 0 0 2 1 2 0 1 0 1 0 6 1 7
Chlamydia* 20 18 1715 3797 2222 1812 287 107 15 4 4260 5738 10020a
Cholera* 0 0 0 0 0 0 1 0 0 0 1 0 1
Creutzfeldt-Jakob disease* 0 0 0 0 0 0 1 2 0 3 1 5 6
Cryptosporidiosis* 88 72 52 69 28 28 6 5 2 5 176 179 357a
Giardiasis* 183 144 139 111 215 201 106 79 21 32 664 567 1232a
Gonorrhoea* 2 0 294 74 831 81 138 8 12 0 1277 163 1444a
H.influenzae type b: total* 1 0 1 0 0 1 0 1 1 0 3 2 5
H.influenzae type b epiglottitis* 0 0 1 0 0 0 0 1 1 0 2 1 3
H.influenzae type b septicaemia* 1 0 0 0 0 1 0 0 0 0 1 1 2
Hepatitis A* 4 3 29 16 23 21 17 6 7 11 80 57 137
Hepatitis B: total* 9 2 225 232 834 704 413 270 64 63 1546 1271
Hepatitis B: acute viral* 0 0 6 4 16 4 2 0 0 0 24 8 32
Hepatitis B: other* 9 2 219 228 818 700 411 270 64 63 1522 1263 2803 a,b
Hepatitis C: total* 22 8 397 332 1833 1084 762 364 82 66 3099 1854 4974a
Hepatitis C: acute viral* 0 0 1 2 3 4 2 0 0 0 6 6 12
Hepatitis C: other* 22 8 396 330 1830 1080 760 364 82 66 3093 1848 4962a
Hepatitis D* 0 0 0 0 5 2 4 2 0 1 9 5 14
Hepatitis E* 0 0 0 1 4 0 0 2 0 1 4 4 8
HIV infection* 0 1 19 9 254 37 63 11 4 2 340 60 404a
Haemolytic uraemic syndrome 1 3 0 0 0 0 1 1 0 3 2 7 9
Influenza: total* 77 67 62 81 124 167 89 128 98 116 450 560 1012a
Influenza: type A* 71 57 52 74 107 129 62 101 81 86 373 448 823a
Influenza: type B* 5 9 8 7 16 31 23 24 14 25 66 96 162
Influenza: : NOS* 1 1 2 0 1 7 4 3 3 5 11 16 27
Legionnaires’ disease: total* 0 0 3 0 4 3 26 9 29 5 62 17 79
Legionnaires’ disease: L.longbeachae* 0 0 1 0 0 1 6 2 14 3 21 6 27
Legionnaires’ disease: L. pneumophila* 0 0 2 0 4 2 20 7 14 2 40 11 51
Legionnaires’ disease: other* 0 0 0 0 0 0 0 0 1 0 1 0 1
Leprosy 0 0 0 0 0 0 0 1 0 2 0 3 3
Leptospirosis* 0 0 4 1 13 3 12 4 2 1 31 9 40
Listeriosis* 0 1 0 0 1 2 5 2 13 6 19 11 30
Malaria* 2 2 20 14 38 9 9 6 0 0 69 31 101a
Measles: total 2 1 2 1 4 2 0 0 0 0 8 4 12
Measles Lab Confirm* 2 1 1 1 4 2 0 0 0 0 7 4 11
Measles: other 0 0 1 0 0 0 0 0 0 0 1 0 1
Meningococcal disease (invasive): total 27 23 24 23 11 7 12 16 2 3 76 72 148
Meningococcal disease: type B* 20 17 13 13 3 1 4 7 2 1 42 39 81
Meningococcal disease: type C* 1 0 5 2 4 3 5 3 0 1 15 9 24
Meningococcal disease: type W135* 0 0 1 0 0 0 1 3 0 0 2 3 5
Meningococcal disease: type Y* 0 0 1 0 0 0 1 0 0 1 2 1 3
Meningococcal disease: other 6 6 4 8 4 3 1 3 0 0 15 20 35
Mumps* 5 1 7 2 14 15 8 7 2 4 36 29 65
Paratyphoid* 0 2 4 0 1 3 0 0 0 0 5 5 10
Pertussis 131 111 424 513 389 575 384 633 164 214 1492 2046 3540a
Pneumococcal disease: invasive* 160 108 36 22 62 62 117 61 140 135 515 388 905a
Psittacosis* 0 0 2 4 13 13 18 17 9 4 42 38 80
Q fever* 2 0 25 8 67 22 64 19 10 4 168 53 222b
Rubella: total* 4 1 3 5 3 2 0 0 0 0 10 8 18
Rubella* 3 1 3 5 3 2 0 0 0 0 9 8 17
Rubella: congenital* 1 0 0 0 0 0 0 0 0 0 1 0 1
Salmonellosis* 362 273 337 286 215 196 142 139 72 102 1128 996 2132a
Shigellosis* 6 11 10 12 15 19 9 9 2 2 42 53 96a
Syphilis: total 2 2 42 44 355 177 239 49 87 48 725 320 1047a
Syphilis: infectious*+ 0 1 23 8 198 14 51 2 3 1 275 26 301
Syphilis other* 2 1 19 36 157 163 188 47 84 47 450 294 746a
Tuberculosis* 3 3 31 34 79 98 38 35 61 42 212 212 426b
Typhoid* 4 0 5 9 9 7 2 2 0 1 20 19 39
Verotoxigenic Escherichia coli infections* 0 0 0 1 1 0 0 0 0 1 1 2 3
# onset =the earlier of patient reported onset date, specimen date or date of notification * laboratory-confirmed cases only NOS = not otherwise specified
+ includes syphilis primary, syphilis secondary, syphilis < 1 yr duration and syphilis-newly acquired a = includes cases with unknown age and sex
table 6
rePorteD DeatHS of reSIDeNtS bY Year of oNSet of IllNeSS
#, NSw, 1991 to 2004
Conditions 1991 1992 1993 1994 1995 1996 1997 1998 1999 2000 2001 2002 2003 2004
Adverse event after immunisation 0 1 0 1 0 2 1 0 1 1 2 1 0 0
Arbovirus infection: total* 2 1 0 0 0 0 0 0 0 0 1 0 0 0
Ross River virus infections* 2 1 0 0 0 0 0 0 0 0 1 0 0 0
Blood lead level ≥ 15mg/dl* 0 0 0 0 0 0 2 0 0 0 0 0 0 0
Chlamydia trachomatis infections* not notifiable until August 1998 0 0 0 1 0 0
Cryptosporidiosis* not notifiable until December 1996 0 0 0 0 0 0 0 0
Giardiasis* not notifiable until August 1998 0 1 0 0 0 0
Gonorrhoea* 0 1 0 0 0 0 0 1 0 0 0 0 0 0
H.influenzae type b: total* 4 4 4 1 0 2 0 0 0 1 1 0 0 0
H.influenzae type b epiglottitis* 0 1 0 0 0 0 0 0 0 1 0 0 0 0
H.influenzae type b infection (NOS)* 2 0 1 0 0 0 0 0 0 0 1 0 0 0
H.influenzae type b meningitis* 2 3 3 0 0 0 0 0 0 0 0 0 0 0
H.influenzae type b septicaemia* 0 0 0 1 0 2 0 0 0 0 0 0 0 0
Hepatitis A* 2 1 0 0 0 0 1 2 0 0 0 1 0 0
Hepatitis B: total* 4 5 6 1 1 1 1 1 1 1 4 1 2 0
Hepatitis B: acute viral* 0 0 1 0 0 0 0 0 0 0 0 0 1 0
Hepatitis B: other* 4 5 5 1 1 1 1 1 1 1 4 1 1 0
Hepatitis C: total* 4 12 6 6 8 15 23 13 17 20 18 10 8 6
Hepatitis C: acute viral* 0 1 0 0 0 0 0 0 0 0 2 0 0 0
Hepatitis C: other* 4 11 6 6 8 15 23 13 17 20 16 10 8 6
Hepatitis E* 0 0 0 0 0 0 0 0 0 0 1 0 0 0
HIV infection: total*£ 349 336 390 432 364 281 132 74 70 81 49 57 46 52
AIDS 349 335 390 432 364 280 132 74 69 79 45 41 41 32
Haemolytic uraemic syndrome not notifiable until December 1996 0 0 1 1 0 1 0 1
Influenza: total* not notifiable until December 2000 0 0 1 1
Influenza—Type A* 0 0 0 0 0 0 0 0 0 0 0 0 1 1
Legionnaires’ disease: total* 6 12 8 8 7 9 2 6 4 2 3 1 2 5
Legionnaires’ disease—L. longbeachae* 0 1 2 0 1 1 0 5 1 1 1 1 0 3
Legionnaires’ disease—L. pneumophila* 1 10 5 3 4 6 2 0 2 1 2 0 2 2
Legionnaires’ disease—other 5 1 1 5 2 2 0 1 1 0 0 0 0 0
Leptospirosis* 0 0 0 0 0 0 1 0 0 0 0 1 0 0
Listeriosis* 0 0 2 2 2 9 1 5 4 4 3 1 6 3
Malaria* 0 1 0 0 0 0 0 0 0 0 0 0 0 0
Measles: total 3 2 0 0 0 0 0 0 0 0 0 0 0 0
Measles laboratory confirmed* 1 0 0 0 0 0 0 0 0 0 0 0 0 0
Measles: other 2 2 0 0 0 0 0 0 0 0 0 0 0 0
Meningococcal disease (invasive): total 0 0 2 2 3 2 6 13 12 11 7 18 12 6
Meningococcal disease—Type B* 0 0 1 1 3 0 4 2 7 6 2 8 6 4
Meningococcal disease—Type C* 0 0 1 1 0 2 2 10 4 4 5 10 6 1
Meningococcal disease—Type W135* 0 0 0 0 0 0 0 0 1 0 0 0 0 0
Meningococcal disease—Type Y* 0 0 0 0 0 0 0 1 0 1 0 0 0 0
Meningococcal disease—other 3 8 9 13 4 5 1 4 2 3 0 1 2 1
Pertussis 0 0 0 0 2 2 3 1 1 2 0 0 1 1
Pneumococcal disease: invasive* not notifiable until December 2000 0 6 96 68 87
Psittacosis* not notifiable until December 2000 0 1 1 0 0
Q fever* 0 0 0 1 0 1 0 0 2 0 0 1 0 0
Salmonella infection* 3 0 0 0 4 4 4 3 3 1 2 3 0 1
Syphilis: total 0 0 0 1 1 0 1 0 1 2 1 1 1 0
Syphilis infection*+ 0 0 0 0 0 0 0 0 0 0 0 1 0 0
Syphilis congenital 0 0 0 1 1 0 0 0 0 1 0 0 0 0
Syphilis other* 0 0 0 0 0 0 1 0 1 1 1 0 1 0
Tetanus 0 0 1 0 0 0 0 0 0 0 0 0 0 0
Tuberculosis* 10 26 31 25 23 16 21 25 29 40 33 39 19 0
# year of onset =the earlier of patient reported onset date, specimen date or date of notification * laboratory-confirmed cases only NOS = not otherwise specified
£ deaths in people with HIV may be reported as related to AIDS or, where the cause is apparently unrelated, to their HIV infection