A b s t r a c t. Ultrasonic dispersion equipment has been deve-loped to investigate soil aggregate stability. An ultrasonic probe was vibrating in water containing soil aggregates. Constant vibra-tion amplitudes of 0.5, 1 and 2mm were used in ultrasonic soil aggregate stability measurements. Ultrasonic power determined with an energy balance method was 0.7, 2.7 and 8.9 W for the three amplitudes. Vibration amplitudes were close to the cavitation limit of gas saturated deionized water, which was found at 0.5-0.6mm measuring absorbance with diode array spectrophotometer. Cambi-sol and Chernozem from a long-term tillage experiment in Lower Austria were investigated. The treatments were conventional, reduced and no tillage. Dissolved organic carbon measured with ultrasonic extraction was higher in Cambisol than in Chernozem. Measuring soil aggregate stability according to DIN norm showed greater stability of Cambisol than of Chernozem, however, can hardly show influences of tillage. Ultrasonic soil aggregate stabili-ty showed greater stabilistabili-ty of Cambisol. Additionally, the ultra-sonic soil aggregate stability method can demonstrate significant influences of soil tillage on aggregate stability iestability de-creased from no tillage to reduce tillage and conventional tillage for both soils. Ultrasonic soil aggregate stability measurements corre-lated with total organic carbon content in aggregates. Total organic carbon content was greater in no tillage than in conventional tillage and larger in Cambisol than in highly degraded Chernozem.
K e y w o r d s: soil aggregate stability, ultrasonic dispersion, cavitation limit, carbon distribution, tillage
INTRODUCTION
Ultrasonic dispersion is a widely used method to dis-aggregate and disperse soil dis-aggregates. Aggregates and par-ticles of different size may be fractioned and used for further physical or chemical analysis without prior use of chemical agents (Ashmanet al., 2009; Zhuet al., 2010). Ultrasonic
waves are emitted into water containing the soil aggregates, and cavitation bubbles are generated. High pressures occur when cavitation bubbles collapse, which promotes disaggre-gation and dispersion of soil aggregates.
Disaggregation is closely related to the power of the used ultrasonic equipment and to the time the water-soil mixture is subjected to ultrasonic vibrations. The absorbed energy (North, 1976) or absorbed energy per unit volume of fluid (Morraet al., 1991) may be correlated to the process of soil particle disaggregation and dispersion and may serve to quantify the stability of soil particles. Several models for the aggregation of soil assume hierarchical order (Bronick and Lal, 2005; Fristensky and Grismer, 2008). In general these models divide soil particles into micro- and macroaggre-gates being larger or smaller than 250mm. The hierarchical nature of soil structure indicates that different aggregation mechanisms operate for different size classes of aggregates; consequently, aggregates of different size classes will have different stability (Amézketa, 1999).
One main benefit of the ultrasonic method is the ability to quantify several physical parameters of the experiment. The energy used to disaggregate and disperse soil particles, for example, may be used to quantify and compare the results of different ultrasonic stability tests (Fristensky and Grismer, 2008; North, 1976). Nonetheless, problems arise evaluating and comparing ultrasonic dispersion results of different laboratories due to several reasons:
– Different ultrasonic procedures: Probe- and tank-type ultrasonic devices are used. Magnitude of ultrasonic vibration is often quantified using the ultrasonic power. However, power displayed on the instruments may differ
Characterization of soil aggregate stability using low intensity ultrasonic vibrations
J. Schomakers
1, A. Mentler
2, T. Steurer
1, A. Klik
3, and H. Mayer
1*
1Department of Material Sciences and Process Engineering, Institute of Physics and Material Science 2Department of Forest- and Soil Sciences, Institute of Soil Science
University of Natural Resources and Life Sciences, Peter-Jordan-Str. 82, 1190 Vienna, Austria 3Department of Water, Atmosphere and Environment, Institute of Hydraulics and Rural Water Management,
University of Natural Resources and Life Sciences, Muthgasse 18, 1190 Vienna, Austria
Received June 29, 2010; accepted October 13, 2010
© 2011 Institute of Agrophysics, Polish Academy of Sciences
*Corresponding author’s e-mail: [email protected]
A A
Agggrrroooppphhyhyysssiiicccsss
from the actual power output depending on equipment, insertion depth and geometry of the ultrasonic probe (Oortset al., 2005; Schmidtet al., 1999; Zhuet al., 2009a). – Different soil treatment: Experimental procedures may
vary considerably and are often not well defined. Results strongly depend on pretreatment and soil water content (Raine and So, 1994). Treatment time and soil/water ratio influence the effectiveness of the ultrasonic dispersion (Zhuet al., 2010).
– Different evaluation: Classification of soil particle sizes and presentation of results are not well standardized. The terms macro-, meso- and microaggregates, for example, refer to different particle sizes in the range from 8 mm to 2mm, and different numbers of classes serve to quantify the frequency of different aggregate fractions (Amézketa, 1999). This makes it necessary to interpret the results within the context of the used methodology (Daraghmeh
et al., 2009).
The aim of this work is to further develop the ultra-sonic method for soil science applications.
MATERIAL AND METHOD
Topsoil samples of Cambisol and Chernozem (0-5 cm) were taken from two sites in Lower Austria in fall 2009 (before harvest) that have been under continuous investi-gation in long-term tillage and erosion experiments. The two sites, Tulln and Pixendorf, situated North-West of Vienna, exhibit experimental fields with altered crop rotation and three different tillage systems:
1. conventional tillage (CT) with mechanical weed control, 2. reduced tillage (RT) with cultivator and cover cropping
in winter,
3. no tillage (NT) with inter cropping in winter.
The soil management practices at each site started in the year 1999. The three different tillages were applied to a loa-my clay Cambisol and a loaloa-my silt Chernozem(Table 1). The average annual precipitation at both sites is 685 mm with a mean annual temperature of 9.4°C. Tulln has a gra-dient of 0-2% whereas gragra-dient of Pixendorf site is 5-6%. The experimental set-up varies in allotment length only. The site Pixendorf features an allotment length of 100 m with an allotment width of six metres. In Tulln, the allotment length is 25 m. Samples were air-dried and sieved, and aggregates with diameters between 1 and 2 mm were obtained. Soil ag-gregate stability was performed in two ways:
– soil aggregate stability (SAS) according to DIN-Norm 19683-16,
– ultrasonic soil aggregate stability (USAS) according to Mentleret al. (2004), soil aggregates were analyzed after three different sonification procedures: vibration ampli-tude 0.5mm for 60 s, vibration amplitude 1mm for 30 s and vibration amplitude 2mm for 15 s.
Total organic carbon content (TOC) was measured with a CNS Analysator (Carlo Erba 1500) with flash combustion technique (ÖNORM L-1080-89). For the destruction of carbonates, the samples were pretreated with 15ml concen-trated HCl and subsequently dried.
Extraction of dissolved organic carbon (DOC) from soil samples was conducted with the ultrasonic technique using Bandelin Sonoplus HD 2200 equipment. The ultrasonic probe had a cylindrical shape with a diameter of 12.7 mm in the extraction experiments. Extraction was performed with vibration amplitude 23mm and an extraction ratio of 1:50 and using high ultrasonic energy (specific energy greater than 312 J ml-1). With HP 8452A Diode Array Spectrophotometer at 254 nm the release of DOC (mg l-1) from the soil samples was determined, according to (Brandstetter
et al., 1996).
Commercially available ultrasonic equipment have se-veral shortcomings, that limit their application in soil scien-ce: Control parameter is the ultrasonic power, their lowest power setting is rather high and their accuracy is low. In the present study, self-developed ultrasonic soil dispersion equipment is used, which is an adapted ultrasonic material testing system (Mayer, 2006). It is a probe type system, where one end of the cylindrical ultrasonic probe is dipped in water containing the soil aggregates. The probe performs resonance vibrations at ultrasonic frequency (approximately 20 kHz) leading to the emission of pressure waves into the fluid. Vibration amplitude of the cylindrical ultrasonic probe is measured with an induction coil. In a closed-loop electronic circuit, the amplitude is controlled and kept constant with very high accuracy. Vibration amplitude and duration of sonification are selected prior to the dispersion experiment. Compared with commercially available ultra-sonic soil dispersion equipment, the self-built system has three main advantages:
– It uses the vibration amplitude rather than the power to control the magnitude of loading in the dispersion ex-periment. Under well-defined geometrical conditions, the vibration amplitude strongly correlates with the magni-tude of the acoustic pressure waves emitted into the fluid, that cause dispersion of soil particles (Kuttruff, 1988; Millner, 1987). Measurement of the vibration amplitude of an ultrasonic probe can be performed accurately with nu-merous standard measuring methods including induction coils used here, optical methodsegwith laser vibrometer or indirect methods performing strain measurements (Mayer et al., 2002). In contrast, the actual power of Sample Sand Silt Clay Ntot TOC CaCO3 C/N
(%)
Cambisol 11.13 39.87 51.0 0.25 3.33 1.4 13.1 Chernozem 23.61 64.89 11.5 0.14 1.86 14.9 13.5
ultrasonic equipment cannot be measured directly but it is derived from voltage and current signals, the efficiency of the ultrasonic transducer and other electrical and mecha-nical parameters of the system (Ratoarinoroet al., 1995; Zhuet al., 2009b). This is prone to errors and can lead to large differences between the displayed power and the actual power output (Oorts et al., 2005; Schmidtet al., 1999). Additionally, at low acoustic pressures close to the cavitation limit, the ultrasonic power fluctuates consi-derably due to the statistically varying water volume subjected to cavitation.
– It is very accurate. Closed-loop control of vibration ampli-tude and resonance frequency guarantee, that the maxi-mum deviation of pre-selected and actual vibration amplitu-de is maximum ±1%. In contrast, control of ultrasonic power is less accurate and prone to errors. Ultrasonic power may vary during the experiment and is influenced by the process of soil dispersion, for example. Detailed recent study shows that ultrasonic energy can be quanti-fied within 10-20% accuracy only (Zhuet al., 2009b). – It allows performing experiments at high and very low
vibration amplitudes. It is possible, for example to per-form experiments below the cavitation limit. Weakly ag-gregated and degraded soils, for example, can be characte-rized in this way.
The ultrasonic soil dispersion equipment works at a fre-quency close to 20 kHz. Cylindrical ultrasonic probe with dia-meter 30 mm is used. This is larger than diadia-meters of probes used in commercially available equipment, which are typi-cally between 10 and 19 mm (Schmidtet al., 1999). The larger diameter of the ultrasonic probe leads to a better homo-geneity of the pressure field. Additionally, emission of acous-tic energy increases about linearly with the area of the ultra-sonic probeiewith the square of the diameter. Using probes with large diameters, certain ultrasonic power can be reach-ed at lower vibration amplitudes and lower acoustic pressures.
Ultrasonic experiments were performed using 80 ml water in a beaker with diameter 44 mm made of PMMA glass. The insertion depth was about 4 mm in all experi-ments, which means that the distance from the lower end of the ultrasonic probe to the bottom of the beaker was about 50 mm. This length was chosen to avoid resonance of the acoustic waves in the water (half wavelength of sound waves of 20 kHz frequency in water is 37 mm and one wave-length is 74 mm). 4 g soil were inserted in 80 ml deionized water shortly before the dispersion experiment started. The solution was stirred with a magnetic device (2 Hz, cylindri-cal shape with length 25 mm and thickness 8 mm). Stirring started simultaneously with the ultrasonic vibration and was continued during the experiments to obtain homogeneous soil distribution in the solution.
Power of ultrasonic equipment used for soil science applications can be calibrated with calorimetric methods. North (1976) suggested a procedure, which was later used and adapted by several investigators (Morra et al., 1991;
Oortset al., 2005; Raine and So, 1994; Roscoeet al., 2000). North uses an energy balance criteria to determine the ultra-sonic poweriewhen ultrasonic waves are emitted into water, power delivered by the equipment is balanced by the in-crease of thermal energies of water and beaker per second plus the loss of heat into the environment per second. The method suggested by North (1976) may be successfully used for commercially available ultrasonic equipment. Power out-put of such equipment is relatively large, and diameters of ultra-sonic probes are relatively small, which causes a relatively small rate of heat loss. In the present investigation however, experiments with very low ultrasonic power close to the cavitation limit are performed. Additionally, the diameter of the ultrasonic probe and its mass are large which leads to large heat capacity and considerable heat transport due to thermal conduction. Due to these reasons, we use the fol-lowing caloric calibration procedure to determine the power of the ultrasonic equipment. The vibration amplitude of ultrasonic probe end is kept constant during the experiment. The ultrasonic probe is inserted in water (mass of water is
mw and specific heat capacity iscw), and the increase of water temperature, DT during the time periodDtis mea-sured. Changes of thermal energy of water are caused by the ultrasonic vibrations and by the heat exchange with ultrasonic probe, beaker and laboratory air. With the ultrasonic power, PUS, and the heat exchange per second,
DQExchange/Dt, change of thermal energy of water per
second,mwcwDT/Dtis given by Eq. (1):
m c T t P
Q
t
w w US
Exchange
D D
D
D
= + . (1)
Heat flow between water and environment due to con-vection or thermal conduction is driven by a temperature gradient. Heat flow from water to beaker, ultrasonic probe or laboratory air is proportional to the respective temperature difference. At the beginning of ultrasonic power measure-ments, all mechanical components of the system including ultrasonic probe and beaker are at ambient temperature. Water with temperature below ambient temperature is used at the beginning of the experiment.DQExchange/Dtis greater zero and increase of thermal energy of water per unit time is the sum of ultrasonic power and heat flow into the water. Water temperature is measured and increases during sonification. When water temperature is above ambient temperature,DQExchange/Dtbecomes less than zero. When the temperature of water and environment coincide,
DQExchange/Dt becomes zero and the ultrasonic power is
A wavelength range from 300 to 800 nm was chosen with a bandwidth of 2 nm and an integration time of one second. The ultrasonic probe vibrates at different previously selected vibration amplitudes, and the absorption coefficient is measured. Cavitation leads to bubbles in the water that cause scatter and reflection and thus attenuation of the transmitted light. Therefore, the absorption coefficient abruptly increases when cavitation occurs, which serves to detect the occurrence of cavitation. The experiments were repeated five times with constant temperature 22°C in the absorption cell.
SPSS Version 8 (Bühl and Zöfel, 1999) was used to calculate means and standard deviations of all data and one-way ANOVA followed by the Duncan Test (p<0.05) to compare means.
RESULTS AND DISCUSSION
Ultrasonic power is measured at different vibration amplitudes of the ultrasonic probe. Temperature increase of water is measured and the absorbed thermal energy per second is calculated. Figure 1 shows the results of measure-ments for vibration amplitudes 1, 2, and 3mm. Each mea-surement is repeated four times. The abscissa shows the water temperature. Ultrasonic probe and beaker have am-bient temperature of 20°C, whereas water temperature is be-low ambient at the beginning of the experiments. Therefore, heat flows into the water from ultrasonic probe, beaker and laboratory air at the beginning. With increasing water perature heat flow decreases and vanishes, when water tem-perature is 20°C. At higher temtem-perature, heat flows from water to beaker, ultrasonic probe and laboratory air. Absorb-ed energy per second when water temperature is 20°C is the ultrasonic power.
Ultrasonic power at vibration amplitude 1 mm deter-mined in this way is by mean 2.7 W. At vibration amplitude 2mm, the mean ultrasonic power is 8.9 W. Mean power at 3 mm is 16.5 W, and at vibration amplitude 0.5mm mean power is 0.7 W (not shown in Fig. 1). Data scatter is relatively large, which is caused by the statistical occurrence and magnitude of cavitation close to the cavitation limit. Consequently, the absorbed energy varies in the different experiments.
Absorbance determined with HP 8452A Diode Array Spectrophotometer are shown for light with wavelengths between approximately 340 and 550 nm in Fig. 2. Wave-lengths are indicated on the abscissa and absorption coef-ficients on the ordinate. If cavitation occurs, absorbance in-creases significantly compared to no cavitation. Cavitation bubbles in the light path of the spectrophotometer cause scattering and reflections, which increases absorbance. Increase of absorption coefficient is visible within the whole range of investigated wavelengths from 300 to 800 nm.
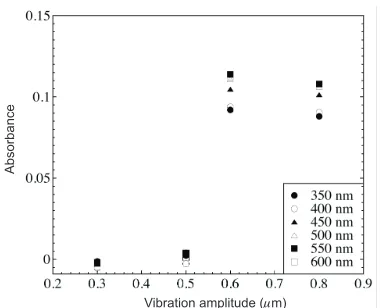
Experiments with different vibration amplitudes of the ultrasonic probe in the range between 0.3 and 0.8mm are performed to determine the cavitation limit. Figure 3 shows the absorption coefficient for different vibration amplitudes of the ultrasonic probe. Between 0.5 and 0.6 mm there is sharp increase in absorbance. Thus minimum vibration am-plitude necessary to cause cavitation in gas saturated de-ionized water is 0.5-0.6mm.
Few experimental investigations on the cavitation limit in water can be found in the literature. For frequency 15 kHz, the minimum acoustic pressure amplitudes necessary to cause cavitation in tap water are found in the range from 0.5 to 2 bar (Esche, 1952). With the vibration frequency,f, the vibration amplitude,u, the mass density,r,and the sound velocity,c, the acoustic pressure,pa, can be calculated using Eq. (2) (Kuttruff, 1988; Millner, 1987):
pa=2m f urc. (2)
Ab
so
rb
e
de
n
e
rg
y
(W
s
)
-1
Fig. 1.Increase of thermal energy of water per second for vibration amplitudes of 1mm (closed circles), 2mm (open circles), and 3mm (closed squares).
Considering the mass density of water (998 kg m-3at 20°C) and the sound velocity in water (1483 m s-1at 20°C), the acoustic pressure amplitudes are 0.9 bar for vibration amplitude 0.5mm and 1.1 bar for 0.6mm. This means that the minimum acoustic pressure necessary to cause cavitation in gas saturated deionized water at 20 kHz frequency is about atmospheric pressure.
Additional experiments have been performed with deionized and degassed water. Cavitation limit under these conditions is at higher vibration amplitudes in the range between 1 and 1.5mm, which corresponds to acoustic pres-sures between 1.9 and 2.8 bar. This supports studies reported in the literature, that degassing of water raises the cavitation limit (Raine and So, 1994). In the present investigation, ultrasonic soil disaggregation experiments are performed using vibration amplitudes of 0.5, 1, and 2mm, which is close to or slightly above the cavitation limit.
Figure 4 shows mean values and standard deviation (five repetitions) of SAS measurements according to DIN-Norm 19683-16. Samples of Cambisol show overall higher stability than samples of Chernozem due to the higher content of organic carbon and clay. Differences in SAS between the three tillage systems proofed to be not signifi-cant for Cambisol. Soil aggregates of Chernozem lost more than 50% of their stability through CT in comparison to RT and NT. Differences of Chernozem in SAS between RT and NT proofed to be not significant. The hillside location in-creases the loss of clay and organic matter and reduces soil aggregate stability.
Figure 5 shows the results of ultrasonic soil aggregate stability measurements after sonification with three diffe-rent vibration amplitudes and sonification times. Vibration amplitude 0.5mm for 60 s (Fig. 5a): with the ultrasonic power of 0.7 W the absorbed ultrasonic energy in 80 ml water and 4 g soil is 42 J and the specific absorbed ultrasonic energy is 0.5 J g-1. Figure 5a shows that the implementation of different tillage practices had a wide influence on the water stable aggregate fractions, characterized by USAS
with vibration amplitude 0.5 mm. The largest decrease in aggregate stability can be observed in Chernozem (clay content 11%). Ten years of CT resulted in the loss of nearly 80% aggregate stability (USAS). In the same time period Cambisol (clay content 49%) was more resistant to con-ventional tillage systems and shows a reduction in USAS of only 20%. Vibration amplitude 1mm for 30 s (Fig. 5b): with the ultrasonic power of 2.7 W the absorbed ultrasonic energy is 81 J and the specific absorbed ultrasonic energy is about 1 J g-1. Figure 5b shows a significant difference in USAS between CT and the conservation oriented tillage practices for Cambisol. Treatments NT and RT of Cambisol show no significant differences. Tillage systems of Chernozem, on the other hand, cannot be distinguished. Vibration amplitude 2mm for 15 s (Fig. 5c): with the ultrasonic power of 8.9 W the absorbed ultrasonic energy is 134 J and the specific absorb-ed ultrasonic energy is about 1.6 J g-1. Figure 5c shows that the vibration amplitude 2mm delivers useful results for both soil types. Differences in USAS between NT and CT are significant for Cambisol and Chernozem. Cambisol lost nearly 60% of its stability, Chernozem more than 80%.
All USAS measurements after different sonification am-plitudes and times show that Cambisol is more stable than Chernozem (Fig. 5a-c), which coincides with the results of the SAS method. In contrast to the SAS method, however, the USAS method using vibration amplitudes close to the ca-vitation limit can additionally detect diffeences in soil aggre-gate stability after different tillage. For both investiaggre-gated sites, soils show a higher aggregate stability, if no tillage is practiced. RT decreases aggregate stability characterized by USAS and CT shows the lowest aggregate stability.
The distribution of total organic carbon (TOC) in water stables aggregates of Cambisol is shown in Fig. 6a. A relati-vely large content of TOC is visible in NT aggregates. TOC content is significantly larger in NT than in RT or CT aggregates for aggregates greater than 250 mm. Figure 6b shows TOC in water stables aggregates of Chernozem from Pixendorf. TOC is higher in all NT aggregate fractions Vibration amplitude ( m)m
Ab
so
rb
a
n
ce
Fig. 3.Absorption of light with different wavelengths in water sub-jected to ultrasonic vibrations with amplitudes between 0.3 and 0.8mm.
compared to CT aggregate fractions. TOC in NT and CT mesoaggregates (>630mm) differs significantly, whereas differences in RT and CT fractions are not significant. Comparing all aggregate fractions, highest TOC content is measured in the NT fractions of Cambisol (up to 8%). TOC in aggregates greater than 250mm from Cambisol with CT and RT is lower compared with the same aggregate classes of Chernozem.
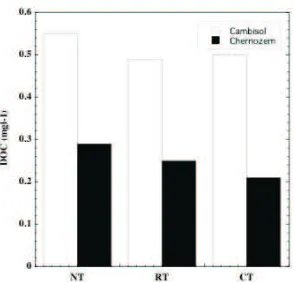
The DOC release from aggregates of different tillage systems at Tulln and Pixendorf using the ultrasonic ex-traction method is shown in Fig. 7. Tulln displays a signifi-cantly higher release of easily water-soluble organic sub-stances. The DOC release for Chernozem displays diffe-rences among the management systems. For both soil types, the release of DOC in NT soils is higher than in CT soils.
The impact of common and conservation-oriented til-lage systems on physical and chemical properties of soil can be observed in long-term tillage experiments. Soil mana-gement influences the stability of aggregates and noticeably the carbon storage and distribution within the fractions (Kasperet al., 2009; Sohiet al., 2010). The maintenance of a ‘good’ soil structure is critical for agricultural sustaina-bility, and depends on the stability of the aggregates (Amézketa, 1999).
Both aggregate stability measurements, USAS and SAS, show a significant difference between the stability of Cambisol from Tulln and the Chernozem from Pixendorf. In addition, the USAS method using low vibration amplitudes close to the cavitation limit shows that tillage accelerates the disaggregation process for both soil types.
Agricultural management affects the stability of macro-aggregates while micromacro-aggregates are independent of it (Amézketa, 1999; Fulleret al., 1995). Cambisol contains more water stable macroaggregates, which show prolonged resistan-ce towards disruption compared to the Chernozem from Pixendorf. A change in aggregate stability occurs for both soils comparing conservation oriented to conventional til-lage systems, which is best demonstrated in ultrasonic experi-ments with vibration amplitude above the cavitation limit.
Fig. 5.Ultrasonic soil aggregate stability (USAS, %) of Cambisol and Chernozem for three tillage systems (CT, RT and NT); USAS after sonification with amplitude: a – 0.5mm for 60 s, b – 1mm for 30 s, c – 2mm for 15 s.
Fig. 6. Distribution of total organic carbon (TOC, %) in water stable aggregates for: a – Cambisol and b – Chernozem.
a
b
c
Analysis of the soil show that the energy of draft forces of tillage tools during cultivation separates macroaggregates and increases the disaggregation process. The reduction of soil aggregate stability goes along with a decrease in the amount of organic carbon and nitrogen (Kasperet al., 2009; Sohiet al., 2010). Tillage does not only reduce soil organic matter but influences the distribution of organic carbon in the aggregate fractions, which determines the surface-orientated processes eg carbon release and in particular water soluble carbon (DOC). The solubility depends on the surface of the aggregates, carbon content and molecular composition.
It is shown, that the chosen vibration amplitudes, sonifi-cation times and setup of experiments (ultrasonic probe, soil water ratio,etc.) is appropriate to monitor slight differences in soil aggregate stability. Key experimental parameters, like sonification time and vibration amplitude, can be adapted using the ultrasonic method whereas sieving methods are known to provide only relative estimates of the investigated pa-rameters (Bieganowskiet al., 2010; Daraghmehet al., 2009).
CONCLUSIONS
1. Ultrasonic soil aggregate stability (USAS) measu-rements using vibration amplitudes close to the cavitation limit can be successfully used to characterize low and highly aggregated soils. USAS can also demonstrate influences of tillage on soil aggregate stability, which can hardly be found using the conventional Soil aggregate stability (SAS) sie-ving method. Results of USAS measurements correlate with total organic carbon (TOC) content in aggregates.
2. Several parameters of the ultrasonic dispersion expe-riment need to be standardized to obtain reproducible re-sults. It is suggested to use the vibration amplitude of the ultrasonic probe to control the experiment. Details of the ex-perimental procedure, including determination of ultrasonic power, time of sonification, mass of water and soil aggre-gates, diameter of the ultrasonic probe, insertion depthetc. are suggested in the present work.
3. Ultrasonic dispersion equipment may be further used to quantify available carbon pools. Extraction of dissolved organic carbon (DOC) from aggregates is performed ap-plying high ultrasonic energy to the soil water mixture.
REFERENCES
Amézketa E., 1999.Soil aggregate stability: A review. J. Sustain. Agric., 14(2, 3), 83-151.
Ashman M.R., Hallett P.D., Brookes P.C., and Allen J., 2009.
Evaluating soil stabilisation by biological processes using step-wise aggregate fractionation. Soil Till. Res., 102(2), 209-215.
Bieganowski A., Ry¿ak M., and Witkowska-Walczak B., 2010.
Determination of soil aggregate disintegration dynamics using laser diffraction. Clay Minerals, 45(1), 23-34.
Brandstetter A., Sletter R.S., Mentler A., and Wenzel W.W., 1996.Estimating dissolved organic carbon in natural water by UV-absorbance (254 nm). Z. Pflanz. Bodenk., 159, 605-607.
Bronick C.J. and Lal R., 2005.Soil structure and management:
A review. Geoderma, 124(1-2), 3-22.
Bühl A. and Zöfel P., 1999.SPSS Version 8. Einführung in die
moderne Datenanalyse unter Windows. Addison-Wesley-Longman Press, Bonn, Germany.
Daraghmeh O.A., Jensen J.R., and Petersen C.T., 2009.Soil
structure stability under conventional and reduced tillage in a sandy loam. Geoderma, 150, 64-71.
Esche R., 1952.Untersuchung der Schwingungskavitation in Flüs-sigkeiten. Acustica (Akustische Beihefte), 2, 208-218.
Fristensky A. and Grismer M.E., 2008.A simultaneous model for ultrasonic aggregate stability assesment. Catena, 74, 153-164.
Fuller L.G., Goh T.B., and Oscaron D.W., 1995.Cultivation ef-fects on dispersible clay of soil aggregates. Can. J. Soil Sci., 75, 101-107.
Kasper M., Buchan G.D., Mentler A., and Blum W.E.H., 2009.
Influence of soil tillage systems on the aggregate stability and the distribution of C and N in different aggregate frac-tions. Soil Till. Res., 105, 192-199.
Kuttruff H., 1988.Physik und Technik des Ultraschalls. Hirzel Verlag, Stuttgart, Germany.
Mayer H., 2006. Ultrasonic torsion and tension-compression
fatigue testing: measuring principles and investigations on 2024T351 aluminium alloy. Int. J. Fatigue, 28(11), 1446-1455.
Mayer H., Mentler A., Papakyriacou M., Rampazzo N., Marxer Y., and Blum W.E.H., 2002.Influence of vibration amplitude on ultrasonic dispersion of soils. Int. Agrophysics 16, 53-60.
Mentler A., Mayer H., Strauß P., and Blum W.E.H., 2004.
Characterization of soil aggregate stability by ultrasonic dispersion. Int. Agrophysics, 18, 39-45.
Millner R., Ed. 1987.Ultraschalltechnik-Grundlagen und Anwen-dungen. Physik-Verlag, Weinheim, Germany.
Morra M.J., Blank R.R., Freehorn L.L., and Shafii B., 1991.
Size fractionation of solid organo-mineral complexes using ultrasonic dispersion. Soil Sci., 152, 294-303.
North P.F., 1976.Towards an absolute measurement of soil struc-tural stability using ultrasound. J. Soil Sci., 27, 451-459.
Oorts K., Vanlauwe B., Recous S., and Merckx R., 2005. Redistri-bution of particulate organic matter during ultrasonic dispersion of highly weathered soils. Eur. J. Soil Sci., 56, 77-91.
Raine S.R. and So H.B., 1994.Ultrasonic dispersion of soil in water: the effect of suspension properties on energy dis-sipation and soil dispersion. Acoust. J. Soil Res., 32, 1157-1174.
Ratoarinoro N., Contamine F., Wilhelm A.M., Berlan J., and
Delmas H., 1995.Power measurement in sonochemistry.
Ultrasonics Sonochem., 2(1), 43-47.
Roscoe R., Buurman P., and Velthorst E.J., 2000.Disruption of soil aggregates by varied amounts of ultrasonic energy in fractionation of organic matter of a clay Latosol: carbon, nitrogen andd13C distribution in particle-size fractions. Eur. J. Soil Sci., 51, 445-454.
Schmidt M.W.I., Rumpel C., and Kögel-Knabner I., 1999.
Evaluation of an ultrasonic dispersion procedure to isolate primary organomineral complexes from soils. Eur. J. Soil Sci., 50, 87-94.
Sohi S.P., Yates H.C., and Gaunt J.L., 2010.Testing a practical indicator for changing soil organic matter. Soil Use Manag., 26, 108-117.
Zhu Z., Field D.J., and Minasny B., 2010. Measuring and
modelling the actual energy involved in aggregate break-down. Catena, 82, 53-60.
Zhu Z., Minasny B., and Field D.J., 2009a.Adapting technology for measuring soil aggregate dispersive energy using ultra-sonic dispersion. Biosys., Eng., 104, 258-265.
Zhu Z.L., Minasny B., and Field D.J., 2009b.Measurement of