Please cite this article as: N. V. Achuth Kumar, S. S. BhanuPrakash, Analysis on Components Complexity During Execution of Construction Projects, International Journal of Engineering (IJE), TRANSACTIONS C: Aspects Vol. 29, No. 9, (September 2016) 1227-1234
International Journal of Engineering
J o u r n a l H o m e p a g e : w w w . i j e . i rAnalysis on Components Complexity During Execution of Construction Projects
N. V. Achuth Kumar, S. S. Bhanu Prakash*
Department of Civil Engineering, KL University, Andhra Pradesh, India
P A P E R I N F O
Paper history:
Received 11 May 2016
Received in revised form 11 July 2016 Accepted 14 July 2016
Keywords:
Construction Management Cost Constraint Time Constraint Quality Constraint Correlation
A B S T R A C T
Development is the fundamental area in enabling India`s economy and urban and provincial structure. Development is a multi-connected structure where all variables are bury connected and multi-centered. All the three limitations time, expense and quality ought to be adjusted in an improved way, so that no segment gets influenced by dismissing those. The goal of this study is to distinguish the managerial variables which will prompt limitations which let-down the development concerning cost, time and quality parts of development from five segments which are critical in execution of development venture. A sum of 51 managerial variables is considered from five components specifically material, labor, equipment, quality control and safety. Data validation is completed for 51 calculated managerial factors. Results revealed that Cronbach coefficient value for all components in three constraints are with range of 0.8-0.9 which is considered as highly reliable with assumed scale. Relative significance is done on these factors. The obtained results reveal that value acceleration of material is 1st most variable with 0.85 RII esteem, which would be a basic element prompting limitation and may let-down the development. Truancy of work with 0.866 RII esteem as far as time limitation, low material quality observing framework with 0.903 regarding quality requirement and afterward relationship examination is finished with variables harmonizing the three imperatives. The result revealed that work efficiency is critical among all components which is associated with 19 different elements above moderate scale. Any need and impact on these elements will demonstrate way on different perspectives which may prompt requirement that let-down the development venture.
doi: 10.5829/idosi.ije.2016.29.09c.07
1. INTRODUCTION1
Construction project life cycle is constituted of many sequential steps, among those most critical tasks would be the execution of planned work [1, 2]. Basically, at reality, management of resources would be important task to be performed and always there would be three constraints that we face during execution – cost, time and quality which show impact of output of project. Internationally, any impact due requirements will be lead to cost invade and therefore the cost variable is thought to be the scale for the task's prosperity or disappointment [3]. Any item is fruitful just when it conveys a conservative fulfillment to buyer in the business sector [4]. In order to accomplish this, arranged execution of item/administration is critical. cost invade ought to be taken into notification, which happens
1*Corresponding Author’s Email: [email protected] (S. S. Bhanu
Prakash)
because of postponements in execution of work and different reasons and dependably attempt to minimize the misfortune because of the impacts and management challenges in executing it [5].
2. LITERATURE STUDY
affecting factors. Relation factors are done through correlation analysis and concluded that financial problems faced by contractors related and sub contractors relates are critical in projects along with fluctuation in price of materials, shortage of site workers and cash flow difficulties. Sheriff Mohamed states that there are number of independent constructs with potential to affect the safety climate [7]. A safety model was developed having factors such as communication, commitment, work pressure, workers involvement, etc. Rifat N.Ruston states that factors affecting the quality in building in the particular place might be in form of 14 main factors and 60 sub factors. Pareto analysis is done and identified that site staff, design financial issues; sub-contractors influence on quality [5]. Adnan Enshassi states that factors which are affecting the performance of construction are divided in different groups such as cost, time, quality, productivity, client satisfaction, people health and safety, environment, etc [4] and having sub factors in each and also conclude that materials shortage is critical factor. Ismail Abdul Rahmanstates affirms that resources factors are affecting project output which has resulted to significant amount of cost overrun in the project [8]. 20 factors are considered and analysis is done on data collected and concludes that three most significant factors are highly influencing among them 2 are from materials and one from money. Correlation analysis is done and results reveals that strong relation found between factors connected to financial aspects. Okoye states that there are management challenges facing construction practice in Nigeria, to reduce these risks. They provided list management challenges which will face during execution of project [9], skills manager to withstand pressure and list of strategies which can applied to succeed the project. Teena Joy states that there are significant factors affecting the quality of construction projects which among them 15 factors are critical. Analysis reveals that Conformance to codes and standards, materials, labours and financial problems are most significant factors affecting the construction factor [2].
3. AIM AND OBJECTIVE
The study is done for recognizing managerial variables which will influence the development and prompts imperative which may let-down the task amid execution and discovering the correlation between managerial factors.
Identifying major significant managerial factors which affect on project output mainly during execution which may lead to constraints like cost, time, quality from 5 components namely material, manpower, equipment, quality control and safety [1-3, 6, 8]
Identifying the managerial factors which are correlated [3, 6, 8] to more number of factors highly and moderately through coinciding the three constraints together.
4. METHODOLOGY
The methodology adopted for this study is questionnaire survey and critical analysis which is done on the data obtained through survey. Totally, 51 managerial factors are considered for questionnaire survey which are derived from previous literature and few are considered from industrial professionals perception. Managerial factors are taken from five components out of which 11 from material [2-4, 8], manpower [2-4, 8], equipment [3, 4, 8], 13 from quality control [1, 2] and 9 from safety [7].
4. 1. Questionnair Survey A Questionnaire survey was conducted with factors from five components (material, manpower, equipment, safety, quality control) which are important during execution of project from industrial professionals [2-4, 8]. These factors are derived from pervious literature and perceptions of industrial professionals, respondents were asked to assess on the scale assuming the following representation while answering the questionnaire 0 is not at all connected, 1 is no evidence as per experience, 2 is few cases, 3 is more cases and 4 is highly influencing factor.
4. 2. Data Validation (Analysis) Test is performed to prove that collected data is reliable for further studies by knowing its degree of consistency. The value represents data consistency and confined as Cronbach coefficient [1, 3, 7, 8]. The range with in which the score of test is considered is mentioned below. If Cronbach coefficient value is greater than 0.7, the data is considered as acceptable for further analysis
4. 3. Ranking Method (Analysis) The relative importance index method (RII) was used to determine the industrial professionals perception of the importance of the identified managerial factor [2, 4, 8] which can show impact on project execution in terms of cost, time and quality constraint.
Using this formula, the major significant factors which will affect the project output was identified. The RII was computed Equation (1),
RII= ∑ W ∕ A* N (1)
TABLE 1. Cronbach value of each component under each constraint
Cronbach value Consideration
α >0.9 represents Excellent
α >0.8 represents Good
α >0.7 Represent Acceptable
α >0.6 represents Questionable
α >0.5 represents Poor
α<0.4 represents Unacceptable
4. 4. Correlation Analysis The scale of strength between two of variables can be determined by correlation analysis. Three methods are used for finding the strength of relation between two variables which are Pearson correlation method, the Spearman rank correlation method and the Chi square test of independence method. The data which was collected through survey are considered as non-parametric and ordinal variables, so the suitable method for finding the strength of relationship between two variables is Spearman’s rank order correlation through SPSS software tool [3, 8].
Correlation coefficient ρ varies from -1.0 to +1.0. The value reaching toward +1 or -1, the stronger the two variables is related. The value of ρ towards 1 show that there is strong positive relation between the two variables while the value of ρ towards to -1 show a strong negative relation between the two considered variables which is mentioned [3, 9].
5. RESULTS AND DISCUSSIONS
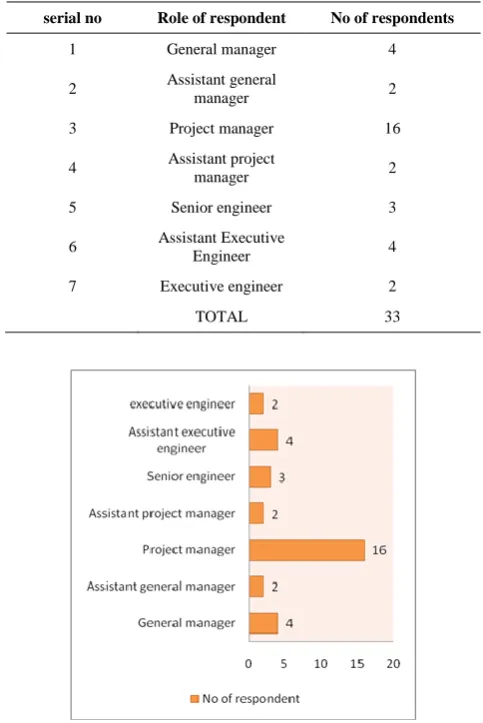
5. 1. Demographic Analysis Survey was conducted with preferred questionnaire [2, 4, 8] consisting of managerial factors from 5 components namely material, man power, equipment, quality control and safety which will affect output of project during execution of project. Totally 42 respondents are approached to assess the scale which among them 2 executive engineer, 4 assistant executive engineer, 5 senior engineer, 4 assistant project manager, 20 project manager, 2 assistant general manager, 5 general manager and out of which 33 respondents are received and also 78% response is received.
As per mentioned in Table 3, a total of 33 respondents questionnaire are received, out of which 16 are project managers with 48% major in participation in the survey, and remaining 4 where Assistant executive engineer, 2 are executive engineer, 3 are senior engineers, 2 are assistant project manager, 4 are general manager and 2 are assistant general managers.
TABLE 2. Correlation coefficient value regarding to the relation between factors
Correlation coefficient Consideration
0-0.2 very week
0.2-0.4 week
0.4-0.6 moderate
0.6-0.8 strong
0.8-1.0 very strong
TABLE 3. Respondents involved in survey
serial no Role of respondent No of respondents
1 General manager 4
2 Assistant general
manager 2
3 Project manager 16
4 Assistant project manager 2
5 Senior engineer 3
6 Assistant Executive
Engineer 4
7 Executive engineer 2
TOTAL 33
Figure 1. Respondents involved in survey
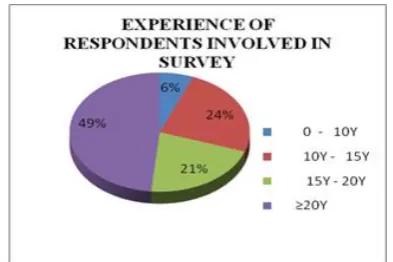
TABLE 4. Experienceof respondents
SL NO Experience in years No of respondents
1 0 - 10Y 2
2 10Y - 15Y 8
3 15Y - 20Y 7
4 ≥20Y 16
Respondents who are involved in survey has a vast experience in construction sector weather it may be commercial or residential or infra projects. As Table 4 and Figure 2 mentioned, 16 persons out of 33 (48%) have experience above 20 years and 8 out of 30 (24%) have experience 10-15 years, 7 out of 30 (21%) have experience 15-20 years and 2 out of 30 (6%) have experience 0-10 years.
5. 2. Data Validation Total 51 managerial factors considered as variables and reliability test is conducted in SPSS software 20 mentioned. Data from each component of questionnaire were tested for its Cronbach α value. To ensure that the collected data are valid and reliable for analysis [1, 3, 7, 8], Table 5 shows values of Cronbach α in each component of the questionnaire data. The alpha value have average value of 0.852 for constraints in terms of material component, average value of 0.832 for constraints in terms of manpower component, average value of 0.84 for constraints in terms of equipment component, average value of 0.901 for constraints in terms of qc component, and average value of 0.920 for constraints in terms of safety component. This shows that data collected was highly reliable and acknowledged as good and excellent. Thus, the reliability of collected data is assured. Certainly, this shows that the questionnaire data is assured for further analysis and reliability of the scale.
Figure 2. Experience of respondents involved in survey
TABLE 5. Cronbach alpha values for cost, time and quality constraint for five components
Component of data collected
Cronbach α value
(Cost constraint)
Cronbach α value
(Time constraint)
Cronbach α value
(Quality constraint)
Material 0.824 0.881 0.851
Manpower 0.840 0.875 0.783
Equipment 0.803 0.901 0.816
Quality control 0.916 0.953 0.835
Safety 0.932 0.924 0.905
5. 3. Ranking Method Total 51 Managerial factors are considered for ranking which are data collected from questionnaire survey where its validation has done through reliability test. The data was mentioned in Table 5 with respective Cronbach value with respective components for cost, time and quality constraints and then RII was computed using SPSS software. RII was provided for all 51 factors and ranking is provided to them with reference to top RII value to the managerial factor with perception of relative importance given by respondent to concern managerial factor [2, 4, 8] which will can make impact on the project output in terms of cost time and quality constraint.
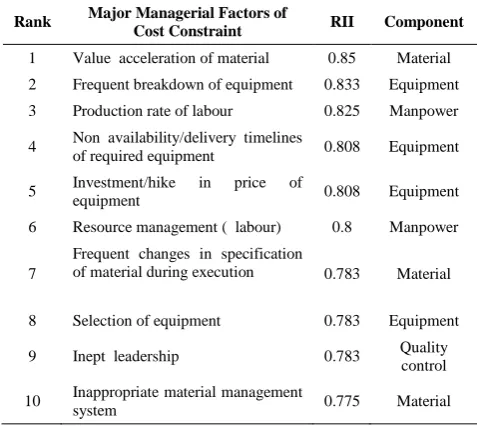
As shown in Table 6, value acceleration of material [3, 8] holds 1st position in factors which will show the impact on output of project by increasing the estimation of project in terms cost constraint with RII value of “0.85”, 2nd frequent breakdown of equipment which can delay the speed of work [3, 8] going and leading to critical path show the impact on project with RII value of “0.8533”, 3rd production rate of labour [3, 8] which will increase the investment of your spending on completion of activity and the cost of project and leads to cost constraint with RII value of “0.825”. 4th position is non availability/delivery timelines of required equipment [3, 8] with RII value “0.808”, 5th position is investment/hike in price of equipment with RII value “0.808”, 6th
position is resource management [3, 8] with RII value “0.8”, 7th position frequent is changes in specification of material during execution [1, 2] with RII value of “ 0.783”, 8th position selection of equipment [3, 8] with RII value of “0.783”, 9th position inept leadership [4] with RII value of “0.783” and 10th position inappropriate material.
As depicted in Table 6, Truancy of work [3, 8] by labour involved holds 1st position with RII value of 0.866 which will delay the progress of the work by increasing the completion time of activity, Non availability/delivery timelines of required equipment [3, 8].
It is also involved holds 2nd position with RII value of 0.853 which can increase the duration of activity depends on one equipment which is yet to delivered on site, 3rd shortage of unskilled/skilled/labour [3, 6, 8] which will increase the completion time of activity on time to lead to providing with RII value of “0.825”and following 4th position scarcity of material [3, 6, 8] with RII value of “0.808”, 5th
position production rate of labour3,7 with RII value of “0.808”, 6th position erection/ installation/ commissioning of equipment [8]with RII value of “0.808”, 7th
position logistics and inventorywith RII value of “ 0.791”, 8thposition frequent breakdown of equipment [3, 6, 8] with RII value of “0.791”, 9th position Frequent changes in specification of material [1, 2] during execution with RII value of “0.775” and 10th
TABLE 6. Details of managerial factor in terms of cost constraint
Rank Major Managerial Factors of
Cost Constraint RII Component
1 Value acceleration of material 0.85 Material
2 Frequent breakdown of equipment 0.833 Equipment
3 Production rate of labour 0.825 Manpower
4 Non availability/delivery timelines
of required equipment 0.808 Equipment
5 Investment/hike in price of
equipment 0.808 Equipment
6 Resource management ( labour) 0.8 Manpower
7
Frequent changes in specification
of material during execution 0.783 Material
8 Selection of equipment 0.783 Equipment
9 Inept leadership 0.783 Quality
control
10 Inappropriate material management
system 0.775 Material
call to correlate material flow [4] with work flow with RII value of “0.74”.
As shown in Table 7, 1st low material quality observing framework [1, 2] with RII value of 0.908 will show impact on quality aspects of work which can make few delays in execution of work or repairing it which will lead to increase the cost , 2nd Incompetency of man power [1, 2] with RII value of 0.841 which is important to guide the execution technical , 3rd inability of contractor [1, 2] who can damage the quality of work if he is incomptant, 4th adjustment of tools and techniques with RII value of 0.825,5th inept leadership [1, 2] with RII value of 0.808, 6th position unavailability of skilled labour [1, 2, 6] with RII value of 0.741, 7th implementation of QMS, 8th poor maintenance at site in its usable condition with RII value of 0.716, 9th techno commercial management system [2, 4] with RII value of 0.716,10th frequent changes in specification of material during execution with RII value of 0.708.
TABLE 7. Details of top managerial factors ranked overall 51 factors from 5 components in terms of quality constraint
Rank
Major Managerial Factors of Quality
Constraint
RII Component
1 Low Material quality
observing framework 0.908 Quality control
2 Incompetency of
manpower 0.841 Quality control
3 Inability of contractor 0.825 Quality control
4 Adjustment of tools
and techniques 0.825 Quality control
5 Inept leadership 0.808 Quality control
6 Unavailability of
skilled labour 0.783 Quality control
7 Implementation of
QMS 0.741 Quality control
8
Poor maintenance material at site in its
usable conditions
0.716 Material
9 Techno-commercial
management system 0.716 Quality control
10
Frequent changes in specification of material during
execution
0.708 Material
5. 4. Correlation Analysis Relation between variable is calculated by spearmen’s rank order correlation through SPSS20 software tool [3, 8]. After computing correlation analysis, the tabular from is developed with 24*24 matrix form of managerial factors which was taken after coinciding top ten managerial factors in three constraints, shown in Figure 3 according to output of analysis done;1 represents Truancy of work by labour; 2 represents non availability/delivery timelines of required equipment; 3 represents shortage of unskilled/skilled labour; 4 represents scarcity of materials; 5 represents production rate of labour; 6 represents erection/installation of equipment; 7 represents logistics and inventory; 8 represents frequent breakdown in equipment; 9 represents frequent changes in specification of material during execution; 10 represents adoptability to management call to correlate material with work flow; 11 represents value acceleration of material; 12 represents investment/hike in price of equipment; 13 represents resource management; 14 represents equipment selection; 15 represents inept leadership; 16 represents improper material management system; 17 represents low material quality observing frame work; 18 represents incompetency of manpower; 19 represents selection of contractor; 20 represents adjustment tools and techniques; 21 represents implementation of QMS; 22 represents poor maintenance material at site; 23 represents techno commercial management system and 24 represents unavailability of skilled labour.
Figure 3. 24*24 matrix of managerial factors for correlation analysis
This shows that any impact on the production rate of labour can show impact on the project output in terms of cost or time or quality aspects of project, from correlation analysis very strong relation occurs between non availability/delivery timelines of required equipment and adoptability to management call to correlate material with work flow with coefficient value up to 0.806.
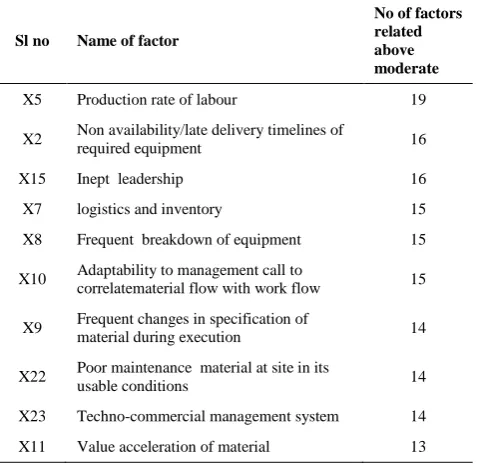
As depicted in Table 7 the factors which are correlated with production rate of labour moderate and above moderate are mentioned above are produced by correlation analysis through SPSS which shows that any alteration or impact on the production rate of labour can show impact on the rest of factors which are related with it. Correlation coefficient value is considered as moderate when it is above 0.4 and considered strong when it is above 0.6 which show in Table 2.
Production rate of labour is highly correlated with non availability/delivery time lines of required equipment with coefficient about 0.74 and highly related with erection/installation/commissioning of equipment with coefficient of 0.708. The production rate of labour can show very much impact in terms of amount you spend on the activity. When the activity is extended due to low production rate, time extension in
completion of activity which may disturb the planned activities can also lead to critical path of activities.
TABLE 8. Details of factors related above moderate scale
Sl no Name of factor
No of factors related above moderate
X5 Production rate of labour 19
X2 Non availability/late delivery timelines of
required equipment 16
X15 Inept leadership 16
X7 logistics and inventory 15
X8 Frequent breakdown of equipment 15
X10 Adaptability to management call to
correlatematerial flow with work flow 15
X9 Frequent changes in specification of
material during execution 14
X22 Poor maintenance material at site in its
usable conditions 14
X23 Techno-commercial management system 14
6. CONCLUSIONS
A questionnaire survey is conducted with 51 managerial factors and questionnaire survey is done by approaching 42 industrial professionals and among those, 33 respondents (about 78 %) are received with assumed scale.
The data collected had got Cronbach coefficient value from range 0.7 to 0.9 which is preferred as highly reliable data and reliable scale of data.
Value acceleration of material holds 1st position with RII value of 0.85 in terms of cost constraint in overall managerial factors which can show impact on the cost aspects of project by increasing the estimation of project in duration course.
Truancy of work by labour involved holds 1st position with RII value of 0.866 in terms of time constraint in overall managerial factors which can show impact on completion of activity to break the progress of the project.
Low material quality observing frame work holds 1st position with RII value 0.908 in terms of quality constraint in overall managerial factors which can show impact on quality parameters of project and damage the economical aspects of project in globally.
By correlation analysis, production rate of labour involved managerial factor has 19 other factors related to it moderate and any impact of production rate of labour can show impact on other management factors in project output.
Very strong relation occurs between non availability/delivery timelines of required
equipment and adoptability to management call to correlate material with work flow with coefficient value up to 0.806.
7. REFERENCES
1. Abas, M., Khattak, S., Hussain, I., Maqsood, S. and Ahmad, I., "Evaluation of factors affecting the quality of construction projects".
2. Joy, T., "A study on factors influencing quality of construction projects", International Journal of Innovative Research and Development|| ISSN 2278–0211, Vol. 3, No. 5, (2014). 3. Memon, A.H., Rahman, I.A., Aziz, A.A., Ravish, V. and Hanas,
N.M., "Identifying construction resource factors affecting construction cost: Case of johor", in Malaysian Technical Universities International Conference on Engineering & Technology (MUiCET 2011)., (2011).
4. Enshassi, A., Mohamed, S. and Abushaban, S., "Factors affecting the performance of construction projects in the gaza strip", Journal of Civil Engineering and Management, Vol. 15, No. 3, (2009), 269-280.
5. Rustom, R. and Amer, M., "Identification of the factors affecting quality in building construction projects in gaza strip", in International Conference on Engineering and City Development. Vol. 1, (2003), 89-101.
6. Divya.R, "Causes, effects and minimization of delays in construction projects", International Journal of Civil Engineering, (2015), 47-53.
7. Mohamed, S., "Safety climate in construction site environments", Journal of Construction Engineering and Management, Vol. 128, No. 5, (2002), 375-384.
8. Abdul Rahman, I., Memon, A.H., Karim, A. and Tarmizi, A., "Relationship between factors of construction resources affecting project cost", Modern Applied Science, Vol. 7, No. 1, (2013).
Analysis on Components Complexity During Execution of Construction Projects
N.V. Achuth Kumar, S.S. Bhanu Prakash
Department of Civil Engineering, KL University, Andhra Pradesh, India
P A P E R I N F O
Paper history:
Received 11 May 2016
Received in revised form 11 July 2016 Accepted 14 July 2016
Keywords:
Construction Management Cost Constraint Time Constraint Quality Constraint Correlation
ديكچ ه
یداػتقا یساس ذٌوًاَت رد یساسا عَضَه ،ِؼسَت .تسا ذٌّ یًاتسا ٍ یزْض راتخاس ٍ
یلاػتا ذٌچ راتخاس کی ،ِؼسَت
دَثْت ُار کی رد ذیات تیفیک ٍ ٌِیشّ ،ىاهس تیدٍذحه ِس زّ .تسا رَحه ذٌچ ٍ ُذض لػته اّزیغته ِوّ ىآ رد ِک تسا
نیظٌت ِتفای عیخطت ،ِؼلاطه يیا سا فذّ .دزیگً رازق زیثات تحت زگید صخت فذح ات صخت چیّ ِک یرَط ِت ،دَض
جٌپ سا ِؼسَت تیفیک ٍ ىاهس ،ٌِیشّ يتفزگ زظً رد ات ِک ذّد یه ُساجا ییاّ تیدٍذحه ِت ِک تسا یتیزیذه یاّزیغته
ه .ذٌّد یه صّاک ار ِؼسَت ،یراذگ ِیاهزس ِؼسَت یازجا رد نْه ِؼطق عَوج
11 رَط ِت ِفلَه جٌپ سا یتیزیذه زیغته
.تسا ُذض ِتفزگ زظً رد یٌویا ٍ تیفیک لزتٌک ،تاشیْجت ،راک یٍزیً ،داَه ظاخ یازت اّ ُداد یجٌس راثتػا
11 زیغته
فیط ات تیدٍذحه ِس رد اشجا ماوت یازت خاثًٍزک ةیزض راذقه ِک داد ىاطً جیاتً .ذیدزگ لیوکت ،ُذض ِثساحه یتیزیذه
سٍ سا یؼی 8 / 0 ات 9 / 0 یثسً تیوّا .تسا ُذض ِتفزگ زظً رد ،ُذض ؼزف سایقه ات داوتػا لتاق رایست ترَغ ِت ِک تسا
ات زیغته يیلٍا ،داَه شسرا باتض ِک ذّد یه ىاطً ُذهآ تسد ِت جیاتً .دَض یه ماجًا لهاَػ يیا زت 81
/ 0
RII
سفً تشػ
یساسا تیدٍذحه ثػات ِک تسا یلغا ءشج کی ِک ،تسا یًس ِسزپ .ذّد ُساجا ِؼسَت صّاک ِت تسا يکوه ٍ دَض یه
ات راک سا 888 / 0
RII
سفً تشػ ات یتَچراچ ُذّاطه ات داَه يییاپ تیفیک ،یًاهس تیدٍذحه ذًٌاوّ 909
/ 0 زظًرد ات
ر ذّاَخ ىایاپ ِت ترٍزض ِس یاّزیغته یساس گٌّاوّ ات ُازوّ ِطتار یسرزت ىآ سا سپ ٍ سایً درَه تیفیک يتفزگ .ذیس
داد ىاطً جیاتً ات ٍ تسا زت نْه راک یرٍ ُزْت ،اشجا ِوّ يیت سا ِک
19 طاثترا رد طسَته سایقه سا زتلاات فلتخه ءشج
ار تاجایتحا تسا يکوه ِک ذٌک یه تاثثا فلتخه یاّ ُاگذید سا ار یّار ءاشجا يیا یٍر زت زیثات ٍ سایً عًَ زّ .تسا
ک ار یراذگ ِیاهزس کسیر ٍ ذٌک غیزست ذّد صّا
.