Please cite this article as: B. Zoullouti, M. Amghar, N. Sbiti, Risk Analysis of Operating Room Using the Fuzzy Bayesian Network Model, International Journal of Engineering (IJE), TRANSACTIONS A: Basics Vol. 30, No. 1, (January 2017) 66-74
International Journal of Engineering
J o u r n a l H o m e p a g e : w w w . i j e . i rRisk Analysis of Operating Room Using the Fuzzy Bayesian Network Model
B. Zoullouti*, M. Amghar, N. Sbiti
Mohammadia School of Engineering, Mohammed V University of Rabat, Rabat, Morocco
P A P E R I N F O
Paper history: Received 22 August 2016
Received in revised form 04 October 2016 Accepted 24 December 2016
Keywords: Risk Assessment Operating Room Fuzzy Bayesian Network Fuzzy Logic
Bayesian Network Patient’s Safe
A B S T R A C T
To enhance Patient’s safety, we need effective methods for risk management. This work aims to propose an integrated approach to risk management for a hospital system. To improve patient’s safety, we should develop flexible methods where different aspects of risk and type of information are taken into consideration. This paper proposes a fuzzy Bayesian network to model and analyze risk in the operating room. Bayesian networks provide a framework for presenting causal relationships and enable probabilistic inference among a set of variables. Fuzzy logic allows using the expert’s opinions when quantitative data are lacking and only qualitative or vague statements can be made. This approach provides an actionable model that accurately supports human cognition using linguistic variables. A case study of the patient’s safety risk is used to illustrate the application of the proposed method.
09 . 01a . 30 . 7 : 10.5829/idosi.ije.201 doi
1. INTRODUCTION1
Medical error is a leading cause of death and injury. Each year, between 210,000 and 440,000 patients who go to the hospital for care suffer from some type of preventable harm that contributes to their death [1]. High error rates with serious consequences are most likely to occur in the operating room [2]. A strong patient’s safety culture in the operating room is very important to improve quality and reduce risks of adverse event and medical errors. Thus, a flexible risk analysis technique becomes crucial.
Numerous methods and techniques including Fault Tree Analysis (FTA) and Failure Mode and Effect Criticality Analysis (FMECA) have been used for safety risk analysis in the healthcare system. However, these methods have a limitation when dealing with rare event and complex systems. Khakzad indicated FTA unsuitable for complex problems with its limitation in explicitly representing dependencies of events, updating probabilities, and coping with uncertainties [3]. While
1*Corresponding Author’s Email: [email protected] (B. Zoullouti)
FMECA doesn’t allow taking into consideration multiple failure scenarios and causes. Bayesian network (BN) is a powerful method for risk analysis. In contrast with other classical methods of dependability analysis, Bayesian networks provide a lot of benefits. Some of these benefits are the ability to model complex systems to make predictions as well as diagnostics, to compute exactly the occurrence probability of an event, to update the calculations according to evidences, to represent multi-modal variables and to help modelling user-friendly by a graphical and compact approach [4].
doesn’t exist (especially in the developing countries), the input data of risk modeling will be provided by expert’s opinion. The quality of such data must be discussed. We must help experts to provide reliable quantitative data. That can be done with the fuzzy set theory.
Including the expert’s judgment in the risk model is essential for providing a reliable risk picture supporting the decision making. In this paper, we are going to propose a methodology of risk analysis of the hospital system, using FBN. FBN is a powerful approach for risk modeling and analysis. This is especially noticed when quantitative data are lacking and only qualitative or vague statements can be made, as well as when historical adverse events data are unavailable or insufficient to be used for safety assessment.
The rest of this paper is organized as follows: Section 2 introduces the bases of Bayesian networks and Fuzzy logic. Section 3 develops the proposed approach for risk analysis. Section 4 illustrates the application of the approach to patient’s safety risk analysis in the operating room. Section 5 discusses some of the main results and summarizes the paper with some concluding remarks.
2. FUZZY BAYESIAN NETWORKS APPLICATIONS IN RISK ANALYSIS
2. 1. Bayesian Networks Bayesian networks were first introduced by Pearl in 1986 and are defined as: is a graphical model that permits a probabilistic relationship among a set of variables. One of the main advantages BN is their ability to model causal relationship among variables. This can be done from cause to effect and vice versa. Bayes rule can be expressed as follows:
) ( / ) ( ) / ( ) /
(A B P B A P A P B
P (1)
Networks are built on principles of adaptability and integrate uncertainties on the relationship between causes and effects (Figure 1). Network model allows taking into account the dependency between the risks and the causes or the factors to compute the system’s risk of failure.
2. 2. Fuzzy Set and Fuzzy Bayesian Networks According to Zadeh (Professor of Berkeley University in California) "The more precise mathematically our statements about the behavior of a complex system are the more insignificant and irrelevant these statements are." Fuzzy logic comes to resolve this limit of classical logic. Fuzzy logic is an approach that allows us to understand human reasoning without resorting to rigid mathematical calculation.
Figure 1. Bayesian network and conditional probability table
It allows taking into account the inaccuracies and uncertainties. It quantifies the blur from acquired knowledge. Unlike classical logic where there are only two states (TRUE, FALSE), in fuzzy logic, we talk about the degree of membership in a fuzzy set. In 1965, Zadeh sets the fuzzy sets from the idea of partial class membership. The fuzzy logic theory combines the notions of fuzzy sets and the possibility theory.
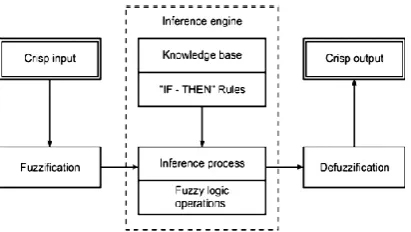
Fuzzy logic systems take into fuzzy variables and produce the output of the fuzzy variables. The basic structure of a fuzzy logic system is shown in Figure 2 and consists of three parts: fuzzification of the input variables, the fuzzy inference process, and défuzzification [7].
Classical Bayesian network methods presume that future states of nature can be characterized probabilistically. However, the Bayesian method can be further extended to include fuzzy states of nature [8]. Suppose the new information is a universe of discourse. It is possible to define fuzzy variables on likelihood, such as ‘‘Low’’, ‘‘Average’’ and ‘‘High’’. For hospitals risk management, the need to work with rare events and limited data about adverse event and risks, leads us to use expert opinions. According to Ross [8], we can extend the Bayesian approach to consider fuzzy information, provided that the fuzzy events on the new information universe are orthogonal.
Leon-Rojas et al. proposed a fuzzy Bayesian partnership algorithm to estimate fuzzy likelihood and fuzzy prior probability [9]. Using maximum likelihood solution, they avoided complicated likelihood function estimation and thus provided a way to simplify computation. Darwiche proposed a differential approach to inference in BN [10]. Their idea is based on evaluating and differentiating arithmetic circuits using a polynomial.
In this study, we use triangular fuzzy numbers for representing probabilities of events. A fuzzy number Ẑ= (a, m, b) is called triangular fuzzy number if its membership function is given by :
b x b x m m b x b m x m x a b m a x a x x F , 0 , , 1 , , 0 )
( (2)
The operators between two triangular fuzzy variables A1(a1, m1, b1) and A2(a2, m2, b2) can be defined by Equation (3):
) / , / , / ( ) , , ( ) , , ( ) , , ( 2 1 2 1 2 1 2 1 2 1 2 1 2 1 2 1 2 1 2 1 2 1 2 1 2 1 2 1 2 1 2 1 a b m m b a A A b b m m a a A A b b m m a a A A b b m m a a A A (3)
Based upon the work of Halliwell et al., the fuzzy marginalization rule and the fuzzy Bayesian rule can be calculated by Equations (4) and (5), respectively [11]. Herein, T stands for the leaf root, while X stands for the root nodes. Combing with Equation (3), the FBN-based inference techniques can then be fulfilled.
) / ( ) ( ) ( i i i
j PX x PT tj X x
t T
P
(4)
( ) ( / )
( )) /
(X xj T tj PX xi PT tj X xi PT tj
P (5)
After having done the inference, we obtained fuzzy number; we use then the defuzzification to produce the crisp value. The most commonly used method of defuzzification is the center of gravity method. Chen and Chen propose a simple method to calculate the center of gravity of a triangular number [12]. Figure 3 shows a triangle. We can see that the center of gravity G(x*, y*) of the triangle is on the medium curve denoted by a dotted line, where
x*=(x1+x2+x3)/3
y*=w/3 (6)
2. 3. Fuzzy Bayesian Network and Risk Analysis Risk analysis is a technique for identifying,
Figure 3. Gravity G of triangular number [12]
characterizing, quantifying and evaluating critical event occurrence. The quantification of risk includes the estimation of the frequencies and the consequences of hazard occurrence. Since 2001, Bayesian networks have been used to analyze risky situations. However, the lack of data about risk, the uncertainty and the very rare events make it difficult to feed the Bayesian network with probabilities. To face this situation, the fuzzy Bayesian network seems to be a good solution.
Zhang et al. propose an approach for safety risk analysis under uncertainty in tunnel construction [13]. Fuzzy Bayesian Networks (FBN) is used to investigate causal relationships between tunnel-induced damage and its influential variables based upon the risk/hazard mechanism analysis. Yang et al. suggest a modified CREAM to facilitate human reliability quantification in marine engineering by incorporating fuzzy evidential reasoning and Bayesian inference logic. The core of the new method is to use evidential reasoning to establish fuzzy IF–THEN rule bases with belief structures, and to employ a Bayesian inference mechanism to aggregate all the rules associated with a marine engineer's task for estimating its failure probability [14]. Ferreira and Borenstein propose a method based on the integration of influence diagram and fuzzy logic to rank and evaluate suppliers to support the decision making process in the supply chain system [15]. Ren et al. give a fuzzy Bayesian network (FBN) approach to model causal relationships among risk factors in offshore operations [16]. The FBN model explicitly represents cause-and-effect assumptions between offshore engineering system variables that may be obscured under other modeling approaches like fuzzy reasoning and Monte Carlo risk analysis. The flexibility of the method allows for multiple forms of information to be used to quantify model relationships, including formally assessed expert opinions when quantitative data are lacking in early design stages with a high level of innovation or when only qualitative or vague statements can be made.
3. METHODOLOGY OF RISK ANALYSIS FOR THE OPERATING ROOM
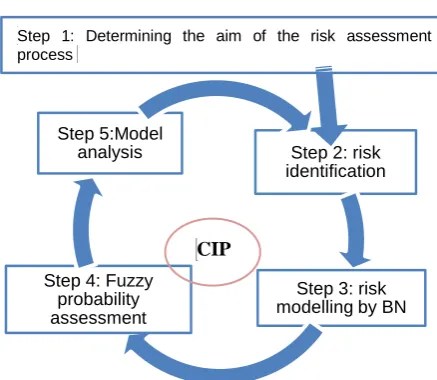
methodology follows five steps (Figure 4) and is part of the Continuous Improvement Process (CIP). The first step involves determining the aim of the risk assessment process, the description of the problem and the definition of the scope.
The second step is to identify potential risks that can affect the quality and the efficiency of the operating room process. In this step, we may encourage creativity and involvement of the operating room team. The next rules are very interesting to lead a workshop of risk identification:
Everything that has happened in a hospital can occur again in the same hospital or another.
What is conceived by the imagination can happen. The third step is the risk modeling. It consists of the construction of the BN graph (definition and choice of the variables to represent the nodes, describing the states of each node and building the structure of Bayesian networks in terms of links between the predefined nodes).
The fourth step is the fuzzy assessment of probability. We investigate the expert’s judgment to feed the model. Experts use a linguistic variable to describe the probabilities of occurrence of adverse events. We transform the linguistic expressions into fuzzy numbers. Since we have more than one expert, we must aggregate the different opinions. For that, we use the weight of the expert to take into account the reliability of the data.
The last step is the analysis of the results: We should then analyze and interpret the result of risk measures to support decision making for safety improvement.
Finally, continuous improvement efforts must incorporate a risk assessment process to ensure the effectiveness and the quality of the process. The model must be updated with the new risks and factors.
Figure 4. Methodology of risk analysis for operating room
4. CASE STUDY: PATIENT SAFETY RISK ANALYSIS IN THE OPERATING ROOM
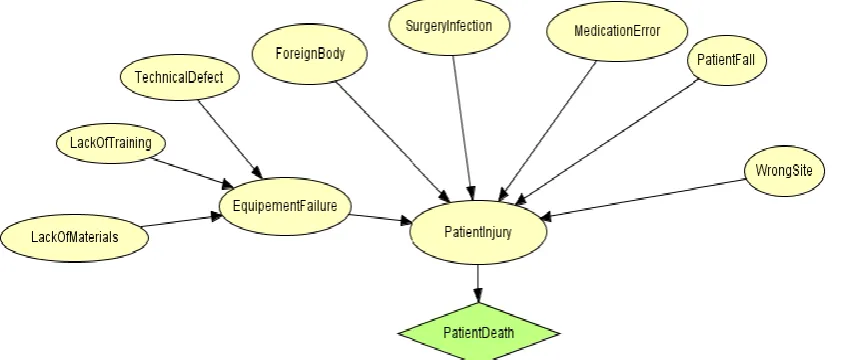
4. 1. Risk Modeling In this paper, we will study the risk of patient’s safety in the operating room. We limit our study to events that cause a significant deviation of the operating room process compared to normal process and which have serious consequences for the patient (Re-intervention, hospitalization in intensive care, extension of the period of hospitalization, additional care, death ...). Figure 3 illustrates the main events that can lead to patient’s injury or patient’s death.
Figure 5 illustrates the BN model of patient’s safety showing interrelationships of events that may lead to patient’s injury. The model has 8 nodes with 1 utility node added to estimate the risk of the patient’s death after surgery due to an error. The nodes are assessed using a literature source and expert’s opinion. The description of these nodes is detailed below.
Surgery infection: The incidence of surgical site infections (SSI) depends upon the patient risk-factors, surgical procedure and practices observed by the operating team.
Surgical foreign body: Leaving things inside the patient's body after surgery is an uncommon but a dangerous error. Sponges and scissors used during surgery have been left inside patients’ bodies.
Operating on the wrong part of the body or wrong-site or wrong-patient or wrong-procedure surgeries: The surgery admissions experiencing a wrong site or wrong side or wrong patient or wrong procedure or wrong implant.
Medication error: Wrong-dose, time, wrong-medication or transcription errors. “A wrong-medication error is any preventable event that may cause or lead to inappropriate medication use or patient harm while the medication is in the control of the health care professional, patient or consumer.
Equipment Failure: Equipment problem may contribute to morbidity and mortality. It can occur due to a technical defect, a lack of training or a lack of materials.
Operation error: An error may occur in surgery due to different adverse events.
Patient injury: An error may or may not cause an adverse event. Adverse events are injuries that cause harm to the patient (death, life-threatening illness, disability at the time of discharge, prolongation of the hospital stay, etc.)
4. 2. Fuzzy Probability Assessment Surgeons and operating team of a children’s hospital were asked to give judgments about the fuzzy probabilities regarding all the nodes.
Step 2: risk identification
Step 3: risk modelling by BN Step 4: Fuzzy
probability assessment
Step 5:Model analysis
CIP
Figure 5.Bayesian network for patient safety model for the Operating room
They use linguistic terms to describe the fuzzy probabilities and then refine them with membership functions. For example, ‘Very low’ was assigned to node ‘Patient Fall’ and ‘Average’ was assigned to technical defect, then defined by the membership function (a, b, c). The other probabilities are given in Table 4 according to the answers given by experts.
The likelihood of each criterion (Table 1) was represented by a range of five discrete values identified by the following linguistic terms: ‘extremely low’ (L1), ‘very low’ (L2), ‘low’ (L3), ‘average’ (L4), ‘high’ (L5). The severity of each adverse event (Table 2) was represented by a range of five discrete values identified by the following linguistic terms: ‘negligible’ (S1), ‘minor’ (S2), ‘medium’ (S3), ‘major’ (S4) and ‘catastrophic’ (S5). These five values represent the states of the node “patient’s injury”.
We interviewed three individuals from the operative team (surgeon, crew chief, anesthesia nurse). They have different points of view and confidence levels toward their own subjective judgments due to the difference in background, working experience and risk attitudes. Thus, a certain deviation exists in the data reliability among different interviewed individuals. Table 3 represents the weight of each expert. Expert 1 has
TABLE 1. Scale of the likelihood
Set Linguistic variable Meaning
L1 Extremely low Never seen
L2 Very low One time in my career
L3 Low Occur in another hospital
L4 Average Occur in our hospital
L5 High Occur in my domain
TABLE 2. Scale of the severity
Set Linguistic
variable meaning
S1 Negligible Consequence minor without prejudice (simple delay )
S2 Minor Incident with prejudice (disorganization )
S3 Medium
Incident with impact postponement , prolongation of hospitalization , not expected
transfer in reanimation )
S4 Major Serious Consequence (reintervention ; permanent or partial disability)
S5 Catastrophic Very serious Consequence (disability, death )
TABLE 3. Weight of expert’s opinion
Expert Weight
E1 W1=1/2
E2 W2=1/3
E3 W 3=1/6
more experience and more precise answers about adverse events than the others, so he was given the higher weight, namely 1/2. A weight of 1/3 was assigned to expert 2 and 1/6 to expert 3.
To deal with the deviation of experts’ answers, the aggregated fuzzy importance of each criterion, whose properties are used to produce a scalar measure of consensus degree, is computed by the weight of the criteria according to the judgment of the expert (Equation (7)).
M1=(
µe1b1 ⋯ µekb1
⋮ ⋱ ⋮
µe2bn ⋯ µekbn
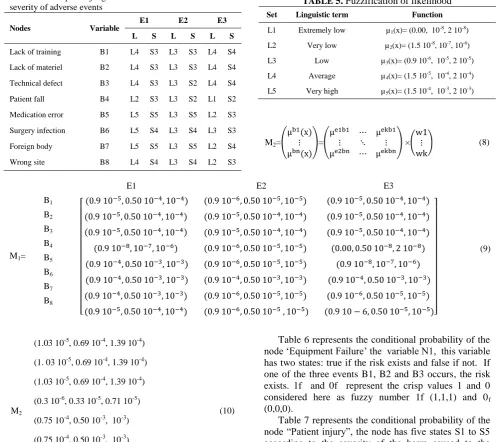
The expert’s judgment about the likelihood and the severity of adverse events is given in Table 4. For instance, the probability (‘high’, ‘L5’) and the severity (‘catastrophic’, S5) have been assigned to the node ‘foreign body’ by expert E1; expert E2 had a different judgement about the likelihood of the same event (L3, ‘Low’). As you can see, experts have different opinions; that's why we used the weight of each expert.
Table 5 represents the fuzzification of the probabilities linguistic variable.
TABLE 4. Expert’s judgment about the likelihood and the severity of adverse events
Nodes Variable
E1 E2 E3
L S L S L S
Lack of training B1 L4 S3 L3 S3 L4 S4
Lack of materiel B2 L4 S3 L3 S3 L4 S4
Technical defect B3 L4 S3 L3 S2 L4 S4
Patient fall B4 L2 S3 L3 S2 L1 S2
Medication error B5 L5 S5 L3 S5 L2 S3
Surgery infection B6 L5 S4 L3 S4 L3 S3
Foreign body B7 L5 S5 L3 S5 L2 S4
Wrong site B8 L4 S4 L3 S4 L2 S3
For example, the triangular fuzzy number (0.00, 10 -8
, 2x10⁻⁸) is assigned to the linguistic variable (‘Extremely low, ‘L1’). The point (10-8, 1) with membership grade of 1 is the mean value; 0 and 2x10⁻⁸ are the left hand and right hand spreads of the triangular number, respectively.
M2 represents the vector of probabilities of basic nodes obtained using Equation (8) and the matrix of fuzzy probabilities estimated by experts represented in Equation (9). The weight of each expert is given in Table 5. This step aims to determine the fuzzy probabilities of basic events represented in Equation (10).
TABLE 5. Fuzzification of likelihood
Set Linguistic term Function
L1 Extremely low µ1(x)= (0.00, 10-8, 2 10-8)
L2 Very low µ2(x)= (1.5 10-8, 10-7, 10-6)
L3 Low µ3(x)= (0.9 10-6, 10-5, 2 10-5)
L4 Average µ4(x)= (1.5 10-5, 10-4, 2 10-4)
L5 Very high µ5(x)= (1.5 10-4, 10-3, 2 10-3)
M2=(
µb1(x)
⋮
µbn(x)
)=(
µe1b1 ⋯ µekb1
⋮ ⋱ ⋮
µe2bn ⋯ µekbn
) ×(
w1 ⋮ wk
) (8)
E1 E2 E3
(9) M1=
B1
[
(0.9 10−5, 0.50 10−4, 10−4) (0.9 10−6, 0.50 10−5, 10−5) (0.9 10−5, 0.50 10−4, 10−4)
(0.9 10−5, 0.50 10−4, 10−4) (0.9 10−5, 0.50 10−4, 10−4) (0.9 10−5, 0.50 10−4, 10−4)
(0.9 10−5, 0.50 10−4, 10−4) (0.9 10−5, 0.50 10−4, 10−4) (0.9 10−5, 0.50 10−4, 10−4)
(0.9 10−8, 10−7, 10−6) (0.9 10−6, 0.50 10−5, 10−5) (0.00, 0.50 10−8, 2 10−8)
(0.9 10−4, 0.50 10−3, 10−3) (0.9 10−6, 0.50 10−5, 10−5) (0.9 10−8, 10−7, 10−6)
(0.9 10−4, 0.50 10−3, 10−3) (0.9 10−4, 0.50 10−3, 10−3) (0.9 10−4, 0.50 10−3, 10−3)
(0.9 10−4, 0.50 10−3, 10−3) (0.9 10−6, 0.50 10−5, 10−5) (0.9 10−6, 0.50 10−5, 10−5)
(0.9 10−5, 0.50 10−4, 10−4) (0.9 10−6, 0.50 10−5 , 10−5) (0.9 10 − 6, 0.50 10−5, 10−5)]
B2
B3
B4
B5
B6
B7
B8
M2
(1.03 10-5, 0.69 10-4, 1.39 10-4)
(10) (1. 03 10-5, 0.69 10-4, 1.39 10-4)
(1.03 10-5, 0.69 10-4, 1.39 10-4)
(0.3 10-6, 0.33 10-5, 0.71 10-5)
(0.75 10-4, 0.50 10-3, 10-3)
(0.75 10-4, 0.50 10-3, 10-3)
(0.75 10-4, 0.50 10-3, 10-3)
(0.75 10-4, 0.50 10-3, 10-3)
Table 6 represents the conditional probability of the node ‘Equipment Failure’ the variable N1, this variable has two states: true if the risk exists and false if not. If one of the three events B1, B2 and B3 occurs, the risk exists. 1f and 0f represent the crisp values 1 and 0 considered here as fuzzy number 1f (1,1,1) and 0f (0,0,0).
TABLE 6. Conditional occurrence probability of “Equipment
Failure”
B1 B2 B3 N1=True N1=False
True True True 1f 0f
False 1f 0f
False True 1f 0f
False 1f 0f
False True True 1f 0f
False 1f 0f
False True 1f 0f
False 0f 1f
4. 3. Result and Sensitive Analysis After the structure of the BN is developed and probabilities are determined, the inference can be performed to estimate the probability of patient’s safety risk. The dependency and correlation among risks and factors are captured in node ‘Patient injury’.
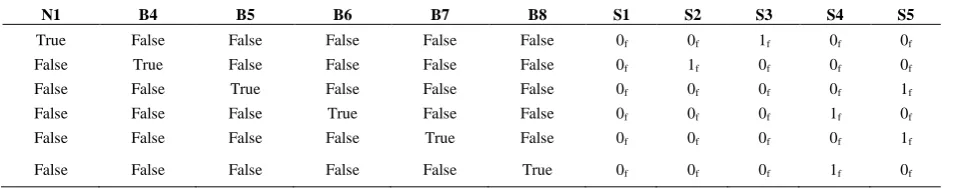
Hence, the task is to find the probabilities of patient’s death after surgery by using the correlations and the fuzzy probabilities of adverse events. Using the fuzzy Bayesian rule previously given in Equation (4), the probability that the injury severity will be catastrophic, can be calculated as given in Equation (11):
) / 5 ( ) ( ) 5
( PT S B bi
i i
b B P S T
P
(11)
TABLE 7. Conditional occurrence probability of “Patient injury”
N1 B4 B5 B6 B7 B8 S1 S2 S3 S4 S5
True False False False False False 0f 0f 1f 0f 0f
False True False False False False 0f 1f 0f 0f 0f
False False True False False False 0f 0f 0f 0f 1f
False False False True False False 0f 0f 0f 1f 0f
False False False False True False 0f 0f 0f 0f 1f
False False False False False True 0f 0f 0f 1f 0f
The probability that the severity of the injury will be catastrophic (S5) is (1.5 10-4, 10-3, 2x10⁻³). Assuming that 80% of patients having a catastrophic injury die, the probability of the death of a patient after surgery due to an adverse event is (1.2x10⁻⁴, 0.8x10⁻³ and 1.6x10⁻³).
Using the center of gravity method (Equation (6)), we obtained COG = (8.4x10⁻⁴, 1/3). The probability of the death of a patient after surgery is the x-axis. i.e. 8.4x10⁻⁴.
Several actions can be done to reduce risk and improve the safety of the patient in the operating room. For instance, we can reduce the risk of retained foreign body during operation by using an appropriate sponge counts and obtaining x-rays if needed to check for any retained foreign body. If we reduce this risk by 60%, the risk of the death of patient becomes 3.36x10⁻⁴.
If the state of one or more variable is known, the model can be updated and the probability of patient injury will change.
One of the main advantages of BNs is their ability to help us to conduct inverse interference. For example, it’s interesting to know, when a death is observed and what the posterior probability of a patient’s infection is. This can be calculated using Equation 5. In addition, if the model contains more details which integrate the main causes of adverse events, we can obtain more interesting results such as the probability of the death of the patient due to human error or lack of training or malfunction in the organization.
5. DISCUSSION
The aim of this paper has been to illustrate a methodology of risk analysis in the operating room using FBN. The FBN presented in this paper allows as including the expert’s judgment in the risk model. It provides a reliable risk picture supporting the decision making and investigating the human cognitive. The model intends to capture and measure risk in the background knowledge (namely common causes and observed adverse event with uncertainty and imprecision).
This method allows evaluating risk of patient’s safety in the context of the lack of data which is the case of a lot of hospitals in the developing countries. Fuzzy logic and the possibility theory allow to model expert knowledge about the risk, to deal with the problem of the lack of data and to take into account the inaccuracies and imprecisions.
probability measure to assess uncertainty. It requires too much precise information in the form of prior and conditional probability tables, and such information is often difficult or impossible to obtain [16].
However, FBN was implemented on a simple mono-hierarchy system. Future studies should attempt to model these two methodologies on multiple hierarchies of complex systems, which are more realistic and applicable to the real situations. When the size of the
graph is important, the model becomes
incomprehensible. We can resolve that by using Object-Oriented Bayesian Network (OOBN). OOBN is a type of BN, comprising both instance nodes and usual nodes. An instance node is a sub-network, representing another BN. Using OOBNs, a large complex BN can be constructed as a hierarchy of sub-networks with desired levels of abstract on [17]. Therefore, model construction is facilitated and communication between the model’s sub-networks is more effectively performed. OOBN has a better model readability which facilitates extending and improvement of the model. Each basic node in the presented network could be developed as a sub-network, if we conduct a causal analysis and model the different causes that may lead to the adverse event.
Remedy actions are always conducted by doctors and nurses upon hazardous occurrences. Timely rescue can largely reduce the practical risks of patient’s injury. By contrast, delayed remedies are of less use. It is therefore necessary to take into account the time. Consideration and incorporation of time-dependent in the risk assessment to represent equipment failure or human reliability is very important. This can be done through Dynamic Bayesian Network (DBN) models. DBN is an extension of BN; it is used to describe how variables influence each other over time based on the model derived from past data. A DBN can be thought as a Markov chain model with many states or a discrete time approximation of a differential equation with time steps. A Dynamic Bayesian Network methodology has been developed to evaluate stochastic deterioration models [18].
The model presented must be updated when new information is available to better estimate the risk of patient safety in the operating room. The model should be enhanced by taking into account different causes of adverse events. The use of adverse event database reporting system may be very useful for getting statistics and determining the probabilities of occurrence of some adverse events. The model allows integrating a mixture source of information (probabilities from database and expert’s opinion).
6. CONCLUSION
Safety is very essential in the healthcare system. Therefore, we should use effective and flexible method for risk analysis to improve safety. FBN methods are used to model and analyze risk in the operating room. The fuzzy logic allows us to use the data provided by expert and deal with the vagueness and imprecision of information. FBN seem more flexible and interpretable than conventional BN. This approach supports human cognition using linguistic variables which is closer to reality.
The application of this approach has been explained by the use of a simple model. The aim of this paper is to demonstrate how FBN can be used to capture complex issues such as patient’s safety risk analysis (in the eventuality of the lack of data concerning risk events) and to increase the understanding of risk problem.
7. REFERENCES
1. James, J.T., "A new, evidence-based estimate of patient harms associated with hospital care", Journal of Patient Safety, Vol. 9, No. 3, (2013), 122-128.
2. Kohn, L., Corrigan, J. and Donaldson, M., To err is humain: Building a safer health care system., Washington, DC: National Academy Press, (2000).
3. Khakzad, N., Khan, F. and Amyotte, P., "Safety analysis in process facilities: Comparison of fault tree and bayesian network approaches", Reliability Engineering & System Safety, Vol. 96, No. 8, (2011), 925-932.
4. Weber, P., Medina-Oliva, G., Simon, C. and Iung, B., "Overview on bayesian networks applications for dependability, risk analysis and maintenance areas", Engineering Applications of Artificial Intelligence, Vol. 25, No. 4, (2012), 671-682. 5. Kang, C. and Golay, M., "A bayesian belief network-based
advisory system for operational availability focused diagnosis of complex nuclear power systems", Expert Systems with Applications, Vol. 17, No. 1, (1999), 21-32.
6. Zoullouti, B., A. and M., S., N., "Risk analysis of operating room using the bayesian network model", International Journal of Applied Engineering Research, Vol. 10, No. 5, (2015), 37428-37433.
7. Markowski, A.S., Mannan, M.S., Kotynia, A. and Pawlak, H., "Application of fuzzy logic to explosion risk assessment", Journal of Loss Prevention in the Process Industries, Vol. 24, No. 6, (2011), 780-790.
8. Ross, T.J., "Fuzzy logic with engineering applications, John Wiley & Sons, (2009).
9. León-Rojas, J.-M., Masero, V. and Morales, M., "On the fuzzy bayesian inference of population annoyance level caused by noise exposure", in Proceedings of the ACM symposium on Applied Computing, ACM. (2003), 227-234.
11. Halliwell, J. and Shen, Q., "Linguistic probabilities: Theory and application", Soft Computing, Vol. 13, No. 2, (2009), 169-183.
12. Chen, S.-J. and Chen, S.-M., "Fuzzy risk analysis based on similarity measures of generalized fuzzy numbers", IEEE Transactions on Fuzzy Systems, Vol. 11, No. 1, (2003), 45-56.
13. Zhang, L., Wu, X., Skibniewski, M.J., Zhong, J. and Lu, Y., "Bayesian-network-based safety risk analysis in construction projects", Reliability Engineering & System Safety, Vol. 131, No., (2014), 29-39.
14. Yang, Z., Bonsall, S., Wall, A., Wang, J. and Usman, M., "A modified cream to human reliability quantification in marine engineering", Ocean Engineering, Vol. 58, (2013), 293-303. 15. Ferreira, L. and Borenstein, D., " A fuzzy- bayesian model for
supplier selection", Expert Systems with Applications, Vol. 39, No. 9, (2012), 7834-7844.
16. Ren, J., Jenkinson, I., Wang, J., Xu, D. and Yang, J., "An offshore risk analysis method using fuzzy bayesian network", Journal of Offshore Mechanics and Arctic Engineering, Vol. 131, No. 4, (2009), 041101.
17. Kjaerulff, U.B. and Madsen, A.L., "Bayesian networks and influence diagrams", Springer Science+ Business Media, Vol. 200, (2008), 114.
18. Nordgard, D.E. and Sand, K., "Application of bayesian networks for risk analysis of mv air insulated switch operation", Reliability Engineering & System Safety, Vol. 95, No. 12, (2010), 1358-1366.
Risk Analysis of Operating Room Using the Fuzzy Bayesian Network Model
B. Zoullouti, M. Amghar, N. Sbiti
Mohammadia School of Engineering, Mohammed V University of Rabat, Rabat, Morocco
P A P E R I N F O
Paper history: Received 22 August 2016
Received in revised form 04 October 2016 Accepted 24 December 2016
![Figure 3. Gravity G of triangular number [12]](https://thumb-us.123doks.com/thumbv2/123dok_us/211535.2015557/3.595.351.500.99.179/figure-gravity-g-triangular-number.webp)