Determining Appropriate Buses and Networks for Applying
Demand Side Management Programs by Structural Analysis
of EENS
B. Adineh*, H. Rajabi Mashhadi**(C.A.) and M. E. Hajiabadi***
Abstract: The main goal of this paper is to structurally analyze impact of DSM programs on reliability indices. A new approach is presented to structurally decompose reliability index Expected Energy Not Supplied (EENS) by using Monte Carlo simulation. EENS is decomposed into two terms. The first term indicates EENS which is caused by generation contingencies. The second term indicates EENS which is caused by transmission and generation contingencies. The proposed approach can be used to indicate appropriate buses for applying DSM. Furthermore, networks are studied at two levels; HLI and HLII. Studies show that in some networks reliability indices are affected mostly at the HLI level. While in some other networks, reliability indices are influenced mostly at the HLII level. It means that in these networks, reliability indices are affected by transmission contingencies. Then, it is shown that the implementation of load shifting is effective in some networks and buses. These are the ones which their EENS is more influenced by generation contingencies. However; it is not effective in the ones which their EENS is more influenced by transmission contingencies. The simulation results on the IEEE-RTS and Khorasan network show the efficiency of the proposed approach.
Keywords: Demand Side Management (DSM), Expected Energy Not Supplied (EENS), Monte Carlo Simulation, Reliability.
1 Introduction1
1.1 Motivation
Demand Side Management (DSM) is an efficient tool to reduce peak demand. Utilities can use DSM (see Appendix) to delay the construction of new generation resources. In fact, by reducing peak demand, DSM will have different effects such as: reducing the number of outages, improving system reliability, reducing energy costs and decreasing the harmful activities for the environment [1-2]. In general, DSM plays a significant role in operation and planning of generation, distribution and transmission systems. DSM applied to power system has a wide range of economic,
Iranian Journal of Electrical & Electronic Engineering, 2014. Paper first received 11 Aug. 2013 and in revised form 23 Nov. 2013. * The Author is with the Department of Electrical Engineering, Ferdowsi University of Mashhad, Mashhad, Iran.
E-mail: [email protected].
** The Author is with the Department of Electrical Engineering at Ferdowsi University of Mashhad and the Center of Excellence on Soft Computing and Intelligent Information Processing, Ferdowsi University of Mashhad, Mashhad, Iran.
E-mail: [email protected].
*** The Author is with the Department of Electrical and Computer Engineering, Hakim Sabzevari University, Sabzevar, Iran.
E-mail: [email protected].
environmental and reliability advantages [3-4]. Therefore, various studies have been carried out on the impact of DSM programs on generation, distribution and transmission systems [5-6]. Moreover, it is important to study the implication of DSM programs in power system reliability [7].
The planning stage of implementing DSM programs is very important in the power system. Therefore, the power system planners should consider applying several items to DSM programs and use their benefits. The fundamental challenges which power system planners should consider in planning DSM programs include:
1- What kind of DSM programs the planner will apply to the power system.
2- When the planner uses the appropriate DSM programs?
3- What type of consumer is the target group of the planner to offer DSM programs?
4- Where the planner wants to applyDSM programs. Therefore, the planners should study the effect of DSM programs on the power system and then apply these programs. To study the effectof these programs, reliability indices of power system are investigated by applying DSM programs.
134 Studies s improved by network buse prioritized to
In order t power syste System relia significantly The applicat counteract th therefore, re reliability in [9]. Referenc different load the DSM me indices differ bus loads, an directly to capacity ade DSM on ind accurate to a [7]. Referenc on system re the total loa sectors. In r estimate the system reliab The results contribution improvement optimal plan introduction [6] can impro model. The when effect system beco [11] and [12] power system to the residen studies on D the impact o be found in t
1.3 The main the impact o of the power achieve this presented.
At the fir are calculate and HLII lev the reliability level. While indices are a that in thes
show that th y applying D es. Therefore, o apply DSM p
1.2 Liter to represent th em, reliability ability indices with increas tion of deman he effects of educe the inh ndices due to ce [7] shows d sectors will easures affect rently when a nd all load sec system load equacy assess dividual load apply DSM t ces [2, 10] an eliability. Thes
ad profile tha reference [2] impacts of D bility in Mon
show that D to com t. Reference nning reserve of DSM. The ove system re
system and ive DSM pr mes more rel ] show the im m reliability in
ntial sector. H DSM, no struc
of DSM progr the literature.
3 Approach n goal of this p of DSM progr
r system. As s goal,a nov rst step, the r ed before app vels. Studies y indices are e in some ot affected mainl se networks,
Ir he reliability DSM program
, the network programs.
rature Review he effect of D y indices are s (LOLE &
ing load fore nd side mana load forecast herent increas the load fore that the bene l be varied. It t system load applying DSM ctors. It is easi or bus load sment compa sectors. It is to the individ nd [6] show th se studies are at does not i an approach DSM program nt Carlo simu DSM program mposite syst e [10] illust e margin can e DSM progra liability by m
load point rograms are liable and se mpact of DSM
ndices, when However, desp cturally analys rams on reliab
and Contrib paper is to stru rams on the r
shown in Fig vel three st reliability ind plying DSM p
show that in influenced m ther networks ly at the HLI , the reliabil
ranian Journa indices are ms over all buses should
w
DSM programs e studied [8 LOEE) incre ecast uncertain agement tends t uncertainty se in the syst
ecast uncertai efits of DSM can be seen t ds and reliabi M on system lo ier to apply D ds in generat ared to apply , however, m dual load sect he effect of D
mainly based include the l h is presented ms on compo ulation approa ms have obvi
tem reliabi trates how n vary with ams illustrated modifying the l
indices decre applied and cure. Referen programs on they are appl pite the presen sis for evaluat bility indices
utions ucturally anal reliability indi g. 1, In order ep modeling ices of netwo programs at H
some networ mostly at the H s, the reliabi II level. It me lity indices
al of Electrica not the d be s on -9]. ease nty. s to and tem inty M on that ility oad, SM ting ying more tors SM d on oad d to osite ach. ious ility the the d in oad ease the nces the lied nted ting can lyze ices r to g is orks HLI rks, HLI ility eans are inf con stru En sim div two wh sec aff Th stru det gen con Sh DS (LD is and ind con wh and app and shi Re KV sho the pro Fig
l & Electronic fluenced by ntingencies.
At the secon ucturally dec nergy Not Su mulation. In vided into two
o terms. The f hich is caused cond term ind fected by tran herefore, the
ucturally anal termine how m neration conti ntingencies.
At the third ifting (LS), w SM programs DC), it is sho effective in th d buses. The dex EENS is
ntingencies. H hich their EEN
d generation proach can be d networks fo ifting program eliability Test V network. Th
ow the efficien e appropriate ograms.
g. 1 The propos
c Engineering y transmis
nd step, a new ompose the r upplied (EENS Monte Carl o parts. Then first term indi d by the gene dicates the am nsmission and
proposed ap lyze the reliab much EENS o ingencies or tr step, first du which is used
and its impac own that the a he reliability se are the on s more influ However; it is
NS is more i contingencies e used to indi or applying D m is applied to System (IEEE he simulation ncy of the pro buses and ne
ed model.
g, Vol. 10, No. ssion and
w approach is reliability ind S) by using lo simulation EENS is dec icates the amo eration contin mount of EE d generation c pproach can bility index of of each bus is
ransmission an ue to the con
in this paper ct on Load Du application of indices of so nes which th uenced by th s not effectiv nfluenced by s. Therefore, icate the appr DSM program o the buses of
E-RTS) and K n results on th
oposed approa etworks for ap
2, June 2014 generation
s presented to dex Expected Monte Carlo n, states are omposed into ount of EENS ngencies. The ENS which is contingencies. be used to f each bus and caused by the nd generation ncept of Load as one of the uration Curve f load shifting ome networks heir reliability he generation ve in the ones transmission the proposed ropriate buses ms. Then, load f IEEE 24-bus Khorasan 400 hese networks ach to indicate pplying DSM 4 n o d o e o S e s . o d e n d e e g s y n s n d s d s 0 s e M
1.4 Paper Organization
The rest of this paper is organized as follows: Section 2 includes problem formulation. Section 3 introduces the proposed EENS decomposition approach and the new Monte Carlo flowchart which is presented to calculate reliability indices. The impact of load shifting on reliability index EENS is evaluated from two points of view in section 4. Section 5 includes the simulation results of IEEE-RTS and Khorasan 400 kV network after and before applying DSM programs. Finally, the paper is summarized and concluded in section 6.
2 Problem Formulation
2.1 Demand Side Management Programs and Their Impact on Load Duration Curve
Utilities are one of the main executers of DSM programs. The consumers can benefit from these programs; they also can manage and implement these programs. The sectors with independent activities such as private buildings and industrial constructions are really interested in DSM programs, in order to reduce their energy consumption and energy costs by implementing them. Moreover, they may help utilities in providing energy more efficiently.
DSM, in general, refers to any program adopted by utilities that changes the utilities’ Load Duration Curve. These changes include: Peak Clipping, Valley Filling, Load Shifting, Strategic Load Growth, Strategic Conservation and Flexible Load Shape, and each of these changes will have many benefits for the utilities and the consumers [13-14].
In this paper, Eq. (1) is used to study the effect of load shifting program on LDC ([4, 6, 7, 9, 10]).This equation is for 24 hours load and it studies the changes of load curve during 24 hours. P is the preferred peak demand of the system that results from the implementation of load shifting. Any load above P is reduced and shifted to off-peak hours. The amount of energy shifted to off-peak hours depends on the value of
α in Eq. (1). The variable p is the first time during the day when the original load is greater than the P (L(t)>P). The variable q is the last time during the day when the original load is greater than P. The starting time for off-peak recovery of energy is presented by t1
and the ending time for off-peak recovery of energy is presented by t2. The difference between t1 and t2 defined
as h is the amount of time which energy will be recovered. The range for α is 0 ≤α≤ 1 and depends on the amount of recovered energy required during off-peak hours (see Eq. (1)).
In this paper, on-peak and off-peak hours are considered as the preferred peak demand of the system and the valley load values, respectively. The energy reduced during a day shifted to the off-peak hours. Therefore, daily load curve and LDC of each bus and network will be modified.
(
)
{
}
{
}
1 2
1 2 1 2
1 2
( ) ( ) ( ) ( ( ))
( ( ) )
( , )( )
( ( )) 1 ( ) ( ( )) 0 ( ) ( , )( ) 1
( , )( ) 0
q
T p
L t L t L t P L t
L T P
t t t h
L t for L t P
L t for L t P
t t t for t t t
t t t for other values of t
α λ
λ λ ∧
=
= − − Ω
⎧ ⎫
−
⎪ ⎪
⎪ ⎪
+ ⎨ ⎬
⎪ ⎪
⎪ ⎪
⎩ ⎭
Ω = >
Ω = ≤
= ≤ ≤
=
∑
(1)
2.2 Power System Reliability Assessment Many indices and methods to assess the reliability of power system have been already studied. Monte Carlo simulation is usually used to assess power system reliability at HLII level. Considering generation and transmission contingencies, different configuration of the system can be occurred in Monte Carlo simulation. In this paper, in order to evaluate the reliability of power system at HLII level, the reliability index EENS is calculated for all the buses. This index shows the expected energy that is not supplied by the power system in a specified time period, usually manually [15].
To evaluate EENS corresponding to each bus, it is necessary to determine the maximum amount of load that can be supplied at ith configuration of the network Pni*. Considering a specific configuration of the
network, the following optimization problem should be solved to compute Pni*. The optimization problem
includes; power flow limits, power balance at each bus, generation and transmission constraints.
1 :
0 1,...,
( ) 0 1,...,
( )
0 1,...,
N
i n n
i i i
g n l
i
l l i j
i i
l l
i g
M i n I E A R P
s u c h t h a t
P P f f o r n N
f f o r l L
f M a x f
P f o r g G
γ θ θ
=
−∑ ×
− − = =
∑ ∑
− − = =
≤
≤ =
(2)
By solving the above linear programming problem, maximum value of Pni can be computed, considering the
Interrupted Energy Assessment Rate (IEAR). The first constraint is power balance at each bus. The second constraint demonstrates DC load flow. The third, the fourth and the fifth constraints are maximum transmission line capacities, maximum generation of generators and maximum bus load, respectively. In this equation N is the number of network buses, G is the number of generators and L is the number of lines.
3 Structural Analysis of EENS
In this paper, Monte Carlo Simulation refers to draw random samples of system states. Reliability index
F
136 EENS is then and improve Simulation power system
3.1 An Exte
In this se flowchart is reliability ind Carlo Simul shows the flowchart. T and generato characteristic is used to components recognized i islands in the each island configuration occurs again results will b flowchart is i The main the number each state ar each state an calculated at
Fig. 2 flowchart
n calculated b ement of the
for assessing m is presented
ension and Im Sim ction, the prop s introduced dex EENS can lation and L
new propose The physical
ors) are identi cs are collecte
assign rando of system. W in Monte Car
e network is d d is determi
n will be sav n in Mont C be used. One o
its high speed n advantage o
of states and re determined
nd the load f the end of the
t to calculate rel
Ir y these sampl e convention g reliability d. mprovement mulation posed Monte d to calcula n be calculated
oad Duration ed Monte C components ified and their
ed. Then, a ra om variables When a new rlo simulation
determined an ined. The r ved and if th arlo simulatio of the advanta d.
of proposed f d the number . Therefore, th flow results o e program.
liability indices
ranian Journa les. An extens nal Monte Ca performance
of Monte Ca
Carlo Simulat ate EENS. T
d by using Mo n Curve. Fig Carlo simulat of system (li r parameters andom genera
to the phys configuration n, the number nd a slack bu results of e hat configurat on, the previ ages of presen
flowchart is t of repetition he probability of each state
s.
al of Electrica sion arlo of arlo tion The onte g. 2 tion ines and ator ical n is r of s to each tion ious nted that n of y of are
Pni
ma sup cal res sim and net I a num num res onl con lin cau Th illu tran EE con two spe E E wh con tran top E E pro E E wh No det sta cal En Mo Th E E as:
l & Electronic
3. As shown in
i* and
PMD is
aximum powe pply by the sy lculated in e spect to these P
As shown i mulation can b d vertical axe twork buses i and n are the
mber of buse mber of stat spectively.
The first part ly illustrates ntingencies. I es are availab used only by g he second par
ustrates the nsmission con ENS is caus
ntingencies in Lemma1 exp o terms.
Lemma1. Fo ecific bus n, E
n
E N S = E E
here EENSG,n
ntingencies an nsmission con Proof. Eq. ( pology with N
1
N
n
E N S E
=
=
∑
Assuming I ocess, EENS o
1 1
N I
n i
E N S
= =
=
∑ ∑
here Pri is the
ot Supplied of To calculate termined in M ate at each b
lculated by mu nergy Not S
oreover, EEN herefore;
1
I n
i
E N S E
=
=
∑
Based on Eq
c Engineering
.2 EENS Dec n Fig. 3, the a not supplied er demand, w ystem. The en each configur
Pni*.
in Fig. 4, th be divided into
s are correspo n Monte Carl e total numb es, respective tes and the
t, which conta s the states It means only ble, are consid
generation co rt, which is c
states caus ntingencies si sed by gene n these states.
presses the de or the specific EENSn is decom
,
G n
E N S + E
indicates EE nd EENST,n in
ntingencies. 4) shows EEN N bus.
n
E E N S
states have of network can
1
Pri×E N Sn
∑
probability of f bus n.
e EENSn, the
Monte Carlo us is indicate ultiplying the Supplied of NSn is the
,
n i
E E N S q. (6), EENS o
g, Vol. 10, No.
composition amount of en
by the specif which PMD is
nergy not sup ration of ea he states in o two parts. T onding to the
lo simulation, er of states ely. 1 to K1
total numbe
ains 1 to K1 st
s caused by y the states, dered. As a re ontingencies in
contains K1+
sed by gen imultaneously eration and ecomposition o c network topo mposed as fol
,
T n
E E N S
ENSn caused b
ndicates EEN
NS of the spe
occurred in n be written a
f state i. ENSn
e probability simulation. E ed as EENSn
probability o that state a summation
of each bus c
2, June 2014 ergy between fic bus n with s expected to pplied will be ch bus with Monte Carlo The horizontal states and the , respectively. and the total are the total er of buses,
tates in Fig. 4, y generation in which all esult, EENS is n these states. 1 to I states, neration and y. As a result, transmission of EENS into ology and the llows:
(3) by generation NSn caused by
ecific network
(4)
Monte Carlo s:
(5) is the Energy
of states is EENS of each
n,i. EENSn,i is
f state i to the at each bus. of EENSn,i.
(6) can be written
4 n h o e h o l e . l l , , n l s . , d , n o e ) n y k ) o ) y s h s e . . ) n
E
I
n i E E N S
= =
∑
where Priis
Energy Not S As shown parts. Theref
1
1 K
n i
EEN S =
=
∑
where
,
,
G n
T n
EENS
EENS
⎧
= ⎪
⎪ ⎨
⎪ =
⎪⎩
The first influenced b summation in generation simultaneous two terms an
4 Impact o In this se on the reliab points of view bus is exami apply this pr on the netwo is presented t
Fig. 3 Calc configuration
Fig. 4 States d
, 1
Pr
I
i E N Sn i
= ×
∑
the probabili Supplied of st n in Fig. 4, s fore, EENSn ca
(
1
Pri×EN Sn
∑
(
(
1
1
1
1
Pr
Pr
K i i
I i K
EN
EN =
+
= ×
×
∑
∑
summation in by generation
ndicates the a and tr sly. Therefore nd Lemma1 is
of DSM on Ne ection, the im bility index E w. First, the im ined and appr rogram. Then orks are exam to apply this p
culating ENS i.
divided into two
i
ity of state i a tate i at bus n. states can be
an be expresse
)
(
1 ,
1 Pr
I
i i
K +
+
∑
)
)
,
,
n i
n i
NS
NS
ndicates the a n contingenci amount of EEN
ransmission e, EENSn is d
proved.
etwork Reliab mpact of load
EENS is eval mpact of load ropriate buses n, the impacts mined and app
program.
correspondin
o parts in Monte
and ENSn,i is
divided into t ed as:
)
, n i
EN S
×
amount of EE ies. The seco NS influenced
contingenc decomposed i
bility shifting progr luated from t d shifting on e
are presented s of load shift propriate netw
g to bus n
e Carlo simulat
(7) the
two
(8)
(9)
ENS ond d by cies into
ram two each d to fting work
LD pro pea imp by ene the is app EE pro wil cau ene the is d be
ind app as ind
Fig
Fig
Fig at
tion.
4.1 Im In this paper DC will be st ograms reduce ak hours to of
It is expecte proved on the transmission ergy from pea e application o not decrease plying load s ENSn will not b
ograms. Also, ll be improve used by gene ergy from pea e implication o decreased, as
improved by
4.2 Imp Studying the dices of netw propriate netw
In [16], EEN the differenc dices, as show
g. 5 LDC chang
g. 6ENS caused
g. 7ENS caused
mpact of DSM r, the impact tudied. As sh e and shift the ff-peak hours. ed that the re e buses, in wh
contingencies ak hours is sh of load shiftin d. It means hifting, as sh be improved b , it is expecte
d on the buse eration contin ak hours is m of load shiftin shown in Fig applying of D
pact of DSM o e impact of DS work is an ef
work for apply NS of a transm e between the wn in Eq. (10):
ges due to apply
d by transmissi
d by generation
M on Bus EE of DSM pro hown in Fig.
e amount of e eliability index
hich their EEN s. However, in hifted to off-p ng, but energy ENSn,i is not
hown in Fig. by the applica ed that the rel es, in which th
ngencies. In moved to off-p
ng and energy g. 7. Therefore DSM program
on Network E SM programs ffective way t ying DSM pro mission system e HLI and HL :
ying DSM progr
on contingencie
n contingencies
ENS
grams on the 5, the DSM energy during x will not be NSn is caused
n these buses, peak hours by y not supplied t changed by 6. Therefore, ation of DSM liability index heir EENSn is
these buses, peak hours by y not supplied e, EENSn will
ms.
EENS on reliability to define the ograms. m is expressed
LII reliability
rams.
es.
.
e M g e d , y d y , M x s , y d l
y e d y
138
Fig. 8Khorasa
Fig. 9IEEE R
Trans
EENS =
Once EE network h contingencie reliability w
an 400 kV netw
Reliability Test S
HLII
EENS −
ENSHLII is mu
has been es. Therefore, will not be i
Ir work.
System
HLI
EENS
−
uch greater th affected by it is expect improved by
ranian Journa han EENSHLI,
y transmiss ted that netw applying D
al of Electrica (10)
the sion work SM
pro EE aff net pro pro net det
5 Kh
pro net tot MW gen tot two cha
the app HL
and res Kh con gen
net at ene sho
net 0.4 IEE abo Tab sig RT and net con
net net Kh
l & Electronic ograms. On ENSHLI are clo
fected by g twork reliabi ograms.
In the rest of ograms on th
twork is stud termined for a
Case Studie horasan Netw In this sec ograms on th
twork will be According to al load is 222 W in 14 buse neration capac al load of 285 o networks h anged by appl
5.1 Case Stu Program In this sectio e IEEE-RTS a plying DSM p LII levels are s According to d Khorasan n spectively, as horasan netwo ntingencies m neration conti Now, load tworks at HLI
peak 0.9 p.u ergy in peak h own in Table
As shown i twork is imp 4% improvem EE-RTS is im out 30% impr
bles 1 and 2 gnificant effec TS, that has be d it has slight twork, that ntingencies.
5.2. Case St Pro In this sectio twork bus of twork is stud horasan 400
c Engineering the other h ose to each ot generation c ility is impr f this paper, th he IEEE-RTS died and appr
applying DSM
es: IEEE-RT work
ction, the im he IEEE-RTS
discussed. o Fig. 8, in K 29 MW and g
es. The IEEE city of 3450 M 50 MW [17], have differen lying load shif
udy 1: Studyi ms on Both HL
on, first EENS and Khorasan programs. EEN
shown in Tabl o Eq. (10), EE network are 1
shown in Ta ork has been more and IEEE ingencies mor shifting is im II. The result u. and α=1, w
hours has mov 2.
in Table 2, roved only 8 ment on total E
mproved 568. rovement on , it can be s ct on the net een affected b effect on the has been a
tudy2: Study ograms on Ne on the impac f the IEEE-RT
died. Tables kV network
g, Vol. 10, No. hand, once E
ther, the netw contingencies roved by ap he impact of ap
S and Khora ropriate netwo M programs.
TS Network
mpact of app S and Khora
Khorasan 400 generation cap E-RTS networ MW in 24 bu as shown in nt LDC and
fting.
ing the Impac LI and HLII
NS values are c n 400 KV ne
NS values at b le 1.
ENStrans for th
6.76 and 206 able 1. It can n affected by E-RTS has bee
re.
mplemented o s of applying which means ved to non-pe
total EENS 8.1 MWh/yr w EENS but total
.95 MWh/yr total EENS. een that load twork, such a by generation c network, such affected by
ying the Effec etwork Buses ct of load shif TS and Khor 3 and 4 sho k and IEEE
2, June 2014 EENSHLII and
work has been . Therefore, plying DSM pplying DSM asan 400 kV ork buses are
and 400 kV
plying DSM asan 400 kV
kV network, pacity is 3752 rk has a total uses and has a Fig. 9. These they will be
ct of DSM Levels calculated for etwork before both HLI and
he IEEE-RTS 67.6 MWh/yr, n be seen that transmission en affected by on these two load shifting total reduced eak hours, are of Khorasan which means l EENS of the which means According to d shifting has as the IEEE-contingencies h as Khorasan transmission
ct of DSM s
fting on each rasan 400 kV ow EENSn of
-RTS before
4 d n , M M V e
V
M V
, 2 l a e e
r e d
S , t n y o g d e n s e s o s -s n n
h V f e
applying load shifting, respectively. Buses with zero EENS not mentioned in Tables 3 and 4.
EENSG,n and EENST,n can be calculated for each bus
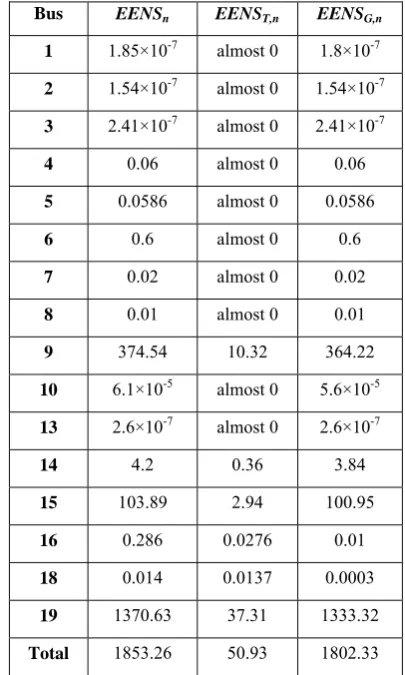
of Khorasan network and IEEE-RTS by Eq. (3). As shown in Tables 3 and 4, it can be seen that EENSG,n is
much more than EENST,n in IEEE-RTS. Therefore, these
buses are affected more by generation contingencies. But EENST,n is much more than EENSG,n in Khorasan
network. Therefore, these buses are affected more by transmission and generation contingencies.
Considering the points given, it is expected that the EENSnof Khorasan network will not be improved, but
the EENSn of IEEE-RTS will be improved after
applying DSM programs. The results of applying LS100 are shown in Tables 5 and 6. The percent improvement
Table 1 EENS of Khorasan and IEEE-RTS networks before applying DSM.
EENStrans
EENSHLI
(MWh/yr)
EENSHLII
(MWh/yr)
2067.6 almost 0
2067.6 Khorasan
Network
16.76 1836.5
1853.26 IEEE-RTS
Table 2 EENS (MWh/yr) of the Khorasan network and IEEE-RTS after and before applying LS100.
Difference After
Applying LS100 Before
Applying LS100
8.1 2059.5
2067.6 Khorasan
Network
568.95 1284.31
1853.26 IEEE-RTS
Table 3 EENS (MWh/yr) of Khorasan buses before applying load shifting.
Bus EENSn EENST,n EENSG,n ×10-7
1 3.8×10⁻⁷ 3.8×10⁻⁷ almost 0
2 0.01 0.01 almost 0
3 22.9 22.9 3.5
5 3.9×10⁻⁷ 3.9×10⁻⁷ almost 0
6 0.02 0.02 almost 0
8 0.04 0.04 almost 0
9 1153.23 1153.23 5.6
10 38.2 38.2 3.55
11 0.06 0.06 almost 0
12 189 189 3.91
13 660.04 660.04 3.55
14 4.2 4.2 almost 0
Total 2067.6 2067.6 20.11
Table 4 EENS (MWh/yr) of the IEEE-RTS buses before applying load shifting.
Bus EENSn EENST,n EENSG,n
1 1.85×10⁻⁷ almost 0 1.8×10⁻⁷
2 1.54×10⁻⁷ almost 0 1.54×10⁻⁷
3 2.41×10⁻⁷ almost 0 2.41×10⁻⁷
4 0.06 almost 0 0.06
5 0.0586 almost 0 0.0586
6 0.6 almost 0 0.6
7 0.02 almost 0 0.02
8 0.01 almost 0 0.01
9 374.54 10.32 364.22
10 6.1×10⁻⁵ almost 0 5.6×10⁻⁵
13 2.6×10⁻⁷ almost 0 2.6×10⁻⁷
14 4.2 0.36 3.84
15 103.89 2.94 100.95
16 0.286 0.0276 0.01
18 0.014 0.0137 0.0003
19 1370.63 37.31 1333.32
Total 1853.26 50.93 1802.33
of EENSn, EENST,n and EENSG,n are expressed in these
tables. As shown in Table 5, the EENSn of Khorasan has
been improved slightly and as shown in Table 6, the EENSnof IEEE-RTS has been improved a lot after
applying DSM programs. Therefore, the buses, in which their EENSG,n are much more than EENST,n, are
appropriate to apply DSM programs. On the other hand, applying DSM programs on the buses, in which their EENSG,n are much less than EENST,n, are not effective to
improve EENSn.
Table 5 EENS (MWh/yr) of the Khorasan buses before applying load shifting.
After Applying DSM Programs
Percent
Improvement (%)
Bus n1 T,n2 G,n3×10-7 n T,n G,n
3 22.9 22.9 1.69 0
almost
0
0
9 1153 1153 2.06 0 1
10 37.6 37.6 1.65 1.5 1
12 188 188 1.53 0.5 1
13 658 658 1.68 0.3 1
Total 2059 2059 8.61 0.4 1
140 Iranian Journal of Electrical & Electronic Engineering, Vol. 10, No. 2, June 2014
Table 6 EENS (MWh/yr) of the IEEE-RTS buses before applying load shifting.
After Applying DSM programs
Percent Improvement (%)
Bus N G,n T,n n T,n G,n
9 253.8 245.7 8.04 32.2 1.9 98.1
14 2.32 2.1 0.22 44.7 7.4 92.6
15 65.43 63.54 1.89 37 2.7 97.2
19 962.74 936.37 26.3 29.7 2.6 97.3
Total 1284.3 1247.7 36.5 30.7 2.5 97.4
1EENSn, 2EENST,n, 3EENSG,n
In the rest of this paper, only the network buses which have the most impact on the EENS of IEEE-RTS and Khorasan network are prioritized for applying DSM programs. In other words, the buses which have the least impact on EENS of networks are not considered.
As a result, the buses, which are appropriate to apply DSM programs, can be determined before applying these programs. Furthermore, the buses can be prioritized to apply DSM programs. Some buses have priority on the other buses. These are the ones which have more EENSG,n and their EENS is affected more by
generation contingencies. Therefore, the buses can be prioritized as: 19, 9, 15 and 14 in the IEEE-RTS to apply DSM programs.
6 Conclusion
It is very important for the power system planners to know where the DSM programs can be applied in the system. Therefore, the planners should study the effect of DSM programs on the power system and then apply these programs. To study the effect of these programs, reliability indices of power system are investigated by applying DSM programs.
Studies show that reliability indices are not improved by applying DSM programs over all the network buses. Therefore, the network buses should be prioritized to apply DSM programs.
In this paper, the appropriate network buses and appropriate networks to apply Demand Side Management programs are determined by investigating the impact of DSM programs on reliability index EENS. In order to achieve this goal, at the first step, networks are studied before applying DSM programs at two levels; HLI and HLII. Studies show that in some networks reliability indices are affected mostly at the HLI level. While in some other networks, reliability indices are influenced mostly at the HLII level. It means that in these networks, reliability indices are affected by transmission contingencies.
At the second step, a new approach is presented to structurally decompose reliability index EENS by using Monte Carlo simulation. EENS is decomposed into two
terms. The first term indicates EENS which is caused by generation contingencies. The second term indicates EENS which is caused by transmission contingencies. Therefore, the proposed approach can be used to structurally analyze the reliability index of each bus and determine how much of EENS of each bus is caused by generation or transmission contingencies.
At the third step, first due to the concept of load shifting which is used in this paper as one of the DSM programs, and its impact on the Load Duration Curve, it is shown that the application of load shifting is effective in some networks and buses. These are the ones which their reliability index EENS is more influenced by generation contingencies. However; it is not effective in the ones which their EENS is more influenced by transmission contingencies. Therefore, the proposed approach can be used to indicate appropriate buses for applying load shifting. Then, Load Shifting program has been applied on the buses of IEEE-RTS and Khorasan 400 kV network and the appropriate buses is determined to apply DSM programs before applying these programs. The simulation results on these networks show the efficiency of the proposed approach. Moreover, the proposed approach could be used to evaluate complex network with more buses for application of DSM programs.
Appendix
The nomenclature is as follows.
EENS Expected Energy Not Supplied DSM Demand Side Management LS Load Shifting
LDC Load Duration Curve
P The preferred peak demand of the system L(t) Load curve at t
ˆ( )
L t Modified load curve at t
P First time during the day when the original load is greater than P Q Last time during the day when the
original load is greater than P
1
t The starting time for off-peak recovery 2
t The ending time for off-peak recovery H The difference between t1 and t2
i n
P ∗ The maximum amount of load that can be
supplied at ith configuration of the network
i n
P
The amount of load that can be supplied at ith configuration of the networkIEAR The Interrupted Energy Assessment Rate
MD
P The maximum power demand which is
expected to supply by the network
ENS Energy Not Supplied
I The total number of the states in Monte Carlo Simulation N The total number of buses
n
EENS Expected Energy Not Supplied of bus n
, G n
EENS Expected Energy Not Supplied of bus n caused by generation system
contingencies
,
T n
EENS Expected Energy Not Supplied of bus n caused by transmission system
contingencies
EENSn,i Expected Energy Not Supplied of each
state at bus n
Pri The probability of state i
ENSn,i Energy Not Supplied of each state at bus
n
References
[1] A. S. Malik, "Modelling and Economic Analysis of DSM Programs in Generation Planning", Electric Power and Energy Systems, Vol. 23, No. 1, pp. 413-419, 2001.
[2] M. Zhou, G. Li and P. Zhang, "Impact of Demand Side Management on Composite Generation and Transmission System Reliability", Power System Conference and Exposition, 2006.
[3] F. Boshell and O. P. Veloza, "Review of developed demand side management programs including different concepts and their results", Proc. IEEE/PES Transmission and Distribution Conf. Expo., Latin America, 2008.
[4] C. W. Gellings, "The Concepts of Demand-side Management for Electric Utilities," Proceedings of the IEEE, Vol. 73, No. 10, pp. 1468-1470, 1985.
[5] T. S. Yau, R. G. Huff and H. L. Willis, "Demand-side Management Impact on the Transmission and Distribution System", IEEE Trans. on Power Systems, Vol. 5, No. 2, pp. 506-512, 1990.
[6] D. Huang, R. Billinton and W. Wangdee, "Effects of Demand Side Management on Bulk System Adequacy Evaluation", in Proc. IEEE 11th Int. Probabilistic Methods Applied to Power Systems (PMAPS) Conf, 2010.
[7] R. B. D. Huang, "Effects of Load Sector
Demand Side Management Applications in Generating Capacity Adequacy Assessment", IEEE Trans. On Power Syst., Vol. 27, No.1, pp. 335-342, 2012.
[8] A. Gomes, A. Soares and C. H. Antunes, "Impact of Demand Side Management and Micro-Generation Units on Low Voltage Disturbution Radial Networks", International Conference Electrical Power Quality and Utilisation(EPQU), 2011.
[9] D. Huang and R. Billinton, "Impact of Demand Side Management on Bulk System Reliability Evaluation Considering Load Forecast Uncertainty", IEEE Electrical Power and Energy Conference, 2011.
[10] R. Billinton and D. Lakhanpal, "Impacts of Demand-Side Management on Reliability Cost/Reliability Worth Analysis", Proc. Inst. Elect. Eng.,Gen., Transm., Distrib., Vol. 143, No. 3, pp. 225-231, 1996.
[11] A. Predenzi and A. Silvestri, "Simulation of DSM Actions Impact Prediction on Residential Daily Load Shape", UPEC, 2011.
[12] N. Zhang, L. F. Ochoa and D. S. Kirschen, "Investigating the Impact of Demand Side Management on Residential Customers", Proceedings of IEEE/PES Innovative Smart Grid Technologies ISGT Europe, 2011.
[13] B. Q. Khanh, "Analysis of DSM’s Impacts on Electric Energy Loss in Distribution System Using VPI Model", Power and Energy Society General Meeting, 2011.
[14] B. Q. Khanh, "Analysis of DSM's impacts on electric energy loss in distribution system using VPI model", Power and Energy IEEE Society General Meeting, 2011.
[15] R. Billinton and R. N. Allan, Reliability Evaluation of Power Systems, Plenum Press, 1996.
[16] J. Choi, A. Rahim, A. El-Keib, R. Thomas and R. Billinton, "A Method for Transmission System Expansion Planning Considering Probabilistic Reliability Criteria", IEEE Trans. On Power Systems, Vol. 20, No. 3, pp. 1606-1615, 2005.
[17] C. P. Wong, P. Albrecht, R. Allan, M. Bhavaraju, R. Billinton, Q. Chen, C. Fong, S. Haddad, S. Kuruganty, W. Li, R. Mukerji, D. Patton, N. Rau, D. Reppen, A. Schneider, M. Shahidehpour and C. Singh, "The IEEE Reliability Test System-1996. A report prepared by the Reliability Test System Task Force of the Application of Probability Methods Subcommittee", IEEE Trans. on Power Systems, Vol. 14, No. 3, pp. 1010-1020, Aug 1999.
142 side managem
Aachen Unive Professor of e Mashhad and Computing an University of are power sy economics, an
Behroo Iran, in degree Techno the M Univers in 2012 His are system ment programs.
Habib Mashha B.Sc. a from Mashha and th Departm Enginee Tehran, ersity of Techno electrical engin d is with the
nd Intelligent I Mashhad, Mas ystem operatio nd biological co
Ir
oz Adineh, wa n 1987. He re
from Shahro logy, Shahrood M.Sc. degree
sity of Mashha 2, both in elec eas of interes
reliability evalu
Rajabi Mash ad, Iran, in 196 and M.Sc. de the Ferdows ad, both in elec
he Ph.D. d ment of Electri ering of Te , Iran, under jo ology, Germany neering at Ferdo Center of Ex nformation Pro shhad, Iran. His on and plannin omputation.
ranian Journa s born in Quch eceived the B
od University d, Iran, in 2008 from Ferdo ad, Mashhad, I ctrical engineer st include po uation and dem
hhadi was born 67. He received egrees with ho i University ctrical engineer
egree from ical and Comp ehran Univers oint cooperation y, in 2002. He i owsi University xcellence on ocessing, Ferdo s research inter ng, power sys
al of Electrica han,
B.Sc. y of and owsi Iran, ring. ower mand
n in d the onor of ring, the puter sity, n of is as y of Soft owsi rests stem
Ma of Sab eco
l & Electronic ashhad, Mashha electrical eng bsevar, Iran. H onomics and po
c Engineering
Mohamma born in Ne received University Zahedan, degree fr Technolog in electrica is pursuing engineerin ad, Iran in 2013 gineering at H His areas of in ower system reli
g, Vol. 10, No.
ad Ebrahim H eyshabour, Iran
the B.Sc. of Sistan & Iran, in 200 rom Sharif U gy, Tehran, Iran
al engineering. g the Ph.D. degr ng at Ferdowsi
3. He is as assi Hakim Sabzeva
nterest include iability evaluati
2, June 2014
Hajiabadi was n, in 1983. He degree from & Baluchestan, 05 and M.Sc. University of n, in 2008, both . Currently, he ree in electrical University of istant Professor ari University, power system ion.
4 s e m , . f h e l f r , m