IJBCP International Journal of Basic & Clinical Pharmacology
Research Article
Correlation of body mass index, waist circumference and waist-hip
ratio to fasting blood sugar levels in non-diabetics:
an observational study
Sujay S. Patil
1*, Suchanda Gadre
1, Sangita Sukumaran
2INTRODUCTION
Excessive accumulation of fat in body is defined as obesity, which may adversely affect the health outcomes of an individual.1 Obesity is a serious health problem in both developed as well as developing countries.2 Indian’s are more susceptible to diabetes and cardio-vascular diseases with modest overweight, central obesity and decreased physical activity has led to a rapid increase in prevalence of diabetes mellitus and cardiac problems in India with major changes in diet and lifestyle.3 Many other disease conditions including certain types of cancer, hypertension, dyslipidemia, osteoarthritis, musculoskeletal problems and gall stone formation are risk factors having association with obesity.4-6
Strong linkage of obesity and medical risks is attributed to abdominal distribution of body fat, often measured by waist hip ratio (WHR) or waist circumference (WC) rather than body mass index (BMI).7,8 Both can be easily calculated and have emerged as high risk indicators and predictors of obesity induced complications, independent of height and muscle mass.9 Many studies have already shown significant association of WC and WHR with myocardial infarction in comparison with BMI.10,11 Diabetics’ epidemics will only be controlled on application of population strategies favouring avoidance of adiposity by strict caloric intake and routine physical exercise.12
ABSTRACT
Background: Obesity is a serious health problem across the world. Obesity is an independent risk factor for diabetes and cardiac problems. Waist-hip ratio and waist circumference are better predictors of obesity and associated medical risks. The aims and objectives of study are to evaluate overweight and obesity in non-diabetics and assess correlation of BMI, WC and WHR with fasting blood sugar (FBS).
Methods: A prospective study was carried out at D.Y. Patil Hospital Nerul, Navi Mumbai between November 2014- December 2014. Subjects attending the medical outpatient department (OPD) were invited to participate in this study. 200 subjects were screened, of whom 100 subjects having fasting sugar levels less than 110 mg/dL were enrolled. The subjects were matched with respect to age, BMI, waist circumference and Hip circumference and W: H ratio. BMI, WC and W:H ratio was correlated with FBS using Pearson’s correlation coefficient. Statistical significance was considered at P value<0.05.
Results: It indicated 19.6% males (10/51) and 14.28% females (7/49) were overweight and 47.05% males (24/51) and 42.85% females (21/49) were obese according to BMI. 13.72% males (7/51) and 20.40% females (10/49) were overweight and 66.66% males (34/51) and 38.77% females (19/49) were obese according to WC. 5.88% males (3/51) and 4.08% females (2/49) were overweight and 94.11% males (48/51) and 91.83% females (45/49) were obese according to WHR.
Conclusions: It can be concluded from this study that there is a positive correlation between BMI, Waist circumference, Waist: Hip Ratio and are important indicators of obesity to predict obesity.
Keywords: Obesity, WC, BMI, WHR DOI: http://dx.doi.org/10.18203/2319-2003.ijbcp20161575
1Department of Pharmacology,
D.Y. Patil University School of Medicine, Navi Mumbai, India 2
Department of Pharmacology, Terna Medical College, Navi Mumbai, India
Received: 11 April 2016 Accepted: 07 May 2016 *Correspondence to: Dr. Sujay S. Patil,
Email: drsujay88@gmail.com
METHODS
A prospective study was carried out at D.Y. Patil Hospital Nerul, Navi Mumbai between November 2014-December 2014. Subjects attending the medical outpatient department (OPD) were invited to participate in this study. We screened 200 subjects out of whom 100 subjects having fasting sugar levels less than 110 mg/dL were enrolled. The aims and objectives of study are to evaluate overweight and obesity in non-diabetics and assess correlation of BMI, WC and WHR with fasting blood sugar (FBS).
Inclusion criteria
Subjects of either gender above 20 years of age with fasting sugar levels less than 110 mg/dL
Patients willing to sign a written informed consent.
Exclusion criteria
Subjects with type 1 or type 2 Diabetes Mellitus
Subjects taking insulin, oral anti-diabetic drugs, corticosteroids, anti-depressants
Pregnant woman and nursing mothers.
After obtaining the informed consent, person’s age, sex, height, weight, waist circumference and hip circumference were recorded. The subject was quizzed about his lifestyle, his diet, physical exercise. Fasting blood sugar (FBS) was taken after a 12 hours fast. Weight was recorded to nearest 0.5 Kg and Height was recorded to nearest 0.5 cm. Body mass index (BMI) was calculated as weight (kg) divided by height squared (meter2). Waist and hip circumferences were measured using a flexible measuring tape, mid-way between the xiphoid process and the umbilicus during the mid-inspiratory phase and at maximum circumference in the hip area, respectively. Ethics committee approval was taken before starting the study.
Define criteria for BMI here was used and for waist circumference and W:H ratio.
Subjects with BMI between 18-22.9 kg/m2 were classified as normal weight, between 23-24.9 kg/m2 as overweight and above 25 kg/m2 as obese.14 WC classification of subjects were done with WC less than 80 cm as normal weight, between 80-87.9 cm as overweight and more than 88 cm as obese. WHR classification of subjects was done with WHR less than 0.80 as normal weight, between 0.80-0.84 as overweight and more than 0.85 as obese.3
The subjects were matched with respect to age, BMI, waist circumference and Hip circumference and W: H ratio. BMI, WC and W:H ratio was correlated with FBS using pearson’s correlation coefficient. Statistical significance was considered at P value<0.05.
RESULTS
Total sample size was 100 subjects. The study sample consisted of 51 males and 49 females. BMI cut-off values by world health organization on basis of current
recommendation are 18.5-24.9 kg/m2 for normal, 25.0-29.9 kg/m2 for overweight and >30 kg/m2 for
[image:2.595.310.547.233.333.2]obesity.13,14 As per Indian scenario, body mass index of 23 kg/m2 is considered overweight as compared to WHO BMI cut-off limit of 25 kg/m2.3
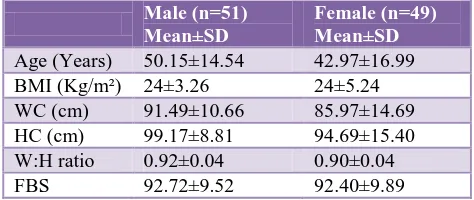
Table 1: Gender wise distribution of anthropometric measurements and fasting blood sugar levels.
Male (n=51)
Mean±SD
Female (n=49) Mean±SD
Age (Years) 50.15±14.54 42.97±16.99
BMI (Kg/m²) 24±3.26 24±5.24
WC (cm) 91.49±10.66 85.97±14.69
HC (cm) 99.17±8.81 94.69±15.40
W:H ratio 0.92±0.04 0.90±0.04
FBS 92.72±9.52 92.40±9.89
Body mass index (BMI) is a simple index of weight-for-height that is commonly used to classify overweight and obesity in adults.15 It is defined as a person's weight in kilograms divided by the square of his height in meters (kg/m2). According to Table 2, 19.6% males (10/51) and 14.28 % females (7/49) were overweight and 47.05% males (24/51) and 42.85% females (21/49) were obese (Table 2).
Table 2: Gender wise distribution of BMI class.
Male (n=51) Female (n=49)
Normal weight
(18-22.9 kg/m2) 17 (33.33%) 21 (42.85%) Over weight
(23-24.9 kg/m2) 10 (19.60%) 7 (14.28%) Obese (>25 kg/m2) 24 (47.05%) 21 (42.85%)
Table 3: Gender wise distribution of waist circumference.
Waist
circumference (cm) Male (n=51)
Female (n=49) Less than 80 cm 10 (19.60%) 20 (40.81%) Between 80-87.9 cm 7 (13.72%) 10 (20.40%) Greater than 88 cm 34 (66.66%) 19 (38.77%)
Table 4: Gender wise distribution of waist: hip ratio (WHR).
Waist hip ratio (WHR)
Male (n=51) Female (n=49)
WHR (<0.80) 0 2 (4.08%)
WHR (0.80-0.84) 3 (5.88%) 2 (4.08%)
WHR (>0.85) 48 (94.11%) 45 (91.83%)
[image:3.595.53.285.294.349.2]Waist to hip ratio (WHR) is the circumference of the waist divided by the circumference of the hips.15 According to Table 4, Subjects with W:H ratio between 0.80-0.84 were classified as overweight 5.88% males (3/51) and 4.08% females (2/49). Subjects with W:H Ratio of >0.85 were classified as Obese 94.11% males (48/51) and 91.83% females (45/49) (Table 4).
Table 5: Gender wise distribution of exercises done.
Male (n=51) Female (n=49)
Walking (%) 22 (44%) 19 (38.77%)
Others (%) 1 (1.96%) 4 (8.17%)
No exercise (%) 28 (54.90%) 25 (51.02%) *Others- Yoga, Cycling.
[image:3.595.52.287.436.538.2]About 46% of subjects were doing exercise i.e. walking, yoga or cycling (Table 5).
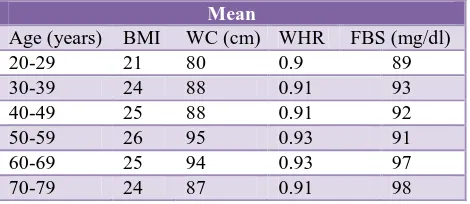
Table 6: Age wise distribution of anthropometric measurements and fasting blood sugar.
Mean
Age (years) BMI WC (cm) WHR FBS (mg/dl)
20-29 21 80 0.9 89
30-39 24 88 0.91 93
40-49 25 88 0.91 92
50-59 26 95 0.93 91
60-69 25 94 0.93 97
70-79 24 87 0.91 98
Table 6 shows that up to 69 years as age increases there was trend of increase in BMI, WC, WHR and FBS but after 70 years it showed a decrease in BMI, WC, WHR.
Table 7: Correlation coefficients of BMI with waist circumference, WHR and FBS.
Parameter Pearson’s correlation
coefficient P value
WHR 0.3 0.0024*
WC 0.66 0.0001*
FBS 0.09 0.373 (NS)
NS- not significant, *P<0.05- significant.
Table 7 explains that there was a positive correlation of BMI with WHR and WC with significant values whereas no significant correlation of BMI with FBS.
Table 8: Correlation coefficient of WC with fasting blood sugar.
Parameter Pearson’s correlation
coefficient P value
FBS 0.12 0.234 (NS)
P value: NS- (not significant).
There was no significant correlation of waist circumference with fasting blood sugar (Table 8).
Table 9: Correlation coefficient of WHR with fasting blood sugar.
Parameter Pearson’s correlation
coefficient P value
FBS 0.21 0.04*
*P<0.05- significant.
There was a positive correlation between waist to hip ratio which was statistically significant (p<0.05) (Table 9).
Combined uses of parameters like BMI, WC or WHR for assessment of generalized and abdominal obesity are better indicators for identification of patients with CVD risk.16-18
DISCUSSION
Physical activities are decreased, men have become more dependent on machines, standards of living have improved, dietary along with lifestyle changes people are putting on extra weight.
Globally the prevalence of obesity in women exceeds that in men, but in our study obesity in men exceeded from that of women.19
The Indian council of medical research has advised lower body weights for Indian men (60 kg) and women (50 kg) compared to those recommended for developed countries because of the smaller body frames of Indian people.20 BMI values on a lower side for developing countries have been advised by expert groups, 18-22.9 kg/m2 acceptable, 23-24.9 kg/m2 should be considered overweight and >25 kg/m2 as obesity.14 Recent consultation by a world health organization (WHO) expert group suggested that, different association between body mass indexes, percentage of body fat and health risk of type-2 diabetes is present among Asian’s as compared to European population.21
weight reduction is associated with lower BMI and waist: hip ratio.
Genetic predisposition to central obesity among Indian’s is attributed due to abnormal fat distribution in the body predisposing insulin resistance. Significant epidemiological evidences found that Waist: Hip ratio >0.88 in males and >0.85 in females are associated with significant risk of diabetes and cardiovascular mortality in Indian’s.3
The reason given by expert groups for the above mentioned values of men 60 kg and women 50 kg is due to body frames of Indians which demands lower BMI values for developing countries.13,14,20,22 Waist: hip ratio of more than 0.88 in males and 0.85 in females has strong risk association with diabetes and cardiovascular mortality based on epidemiological evidences carried out among Indian population. The WHO recommended waist: hip ratio of less than 0.95 in males and less than 0.90 in females is too high and not valid for Indians.3
Diabetes is setting in Indian population at a younger age (a decade earlier) having features of high intra-abdominal fat mass, high insulin resistance rates and deficient states explained briefly in ‘Thifty Gene Hypothesis’ and ‘Yajnik Paradox’.23 High tendency is noted among South Asians for abdominal obesity and related complications.24-26 Another study gave confirmation about waist - hip ratio being an important risk factor for death due to coronary heart diseases.27 So, while assessing obesity waist - hip ratio is the best of all parameters in anthropometrical measurements.2
Impaired fasting glucose patients are more prone to develop visceral fat more precisely as compared to subcutaneous fat. Obesity has a pivotal role in pathogenesis of type 2 diabetes.28
Interheart study
A case-control study having large sample size (12,000 myocardial infarction cases and 15,000 controls) found that WHR had more strong association with myocardial infarction risk as compared to WC.29
Result’s indicated 19.6% males (10/51) and 14.28% females (7/49) were overweight and 47.05% males (24/51) and 42.85% females (21/49) were obese according to BMI. 13.72% males (7/51) and 20.40% females (10/49) were overweight and 66.66% males (34/51) and 38.77% females (19/49) were obese according to WC. 5.88% males (3/51) and 4.08% females (2/49) were overweight and 94.11% males (48/51) and 91.83% females (45/49) were obese according to WHR.
CONCLUSION
It can be concluded from this study that there is a positive
ratio. All three are important indicators of obesity and can be used to predict incidence of obesity in Indian population. It is important need of the hour to set guidelines for detection of obesity in Indian population to enable early detection of obesity, so that early and prompt treatment or prevention measures can be started and huge hidden burden of further cardio vascular complications can be reduced.
Funding: No funding sources Conflict of interest: None declared
Ethical approval: The study was approved by the Institutional Ethics Committee
REFERENCES
1. World Health Organization. Obesity: preventing and managing the global epidemic. Report of a WHO consultation presented at: the World Health Organization; Geneva, Switzerland. Publication WHO/NUT/NCD/98.1; 1997.
2. Kaur S, Walia I. Body mass index, waist circumference and waist: hip ratio among nursing students. Nursing and Midwifery Research Journal. 2007;3(2):84-90.
3. Patil S, Sukumaran S, Bhate A, Mukherji A, Chandrakar S. Correlation of blood sugar with waist circumference and body mass index in an Indian. Population Global Journal of Pharmacology. 2012;6(1);8-11.
4. Manson JE, Colditz GA, Stampfer MJ. A prospective study of obesity and risk of coronary heart disease in women. N Engl J Med. 1990;322:882-9.
5. Colditz GA, Willett WC, Stampfer MJ. Weight as a risk factor for clinical diabetes in women. Am J Epidemiol. 1990;132:501-13.
6. Carman WJ, Sowers M, Hawthorne VM, Weissefd LA. Obesity as a risk factor for osteoarthritis of the hand and wrist: a prospective study. Am J Epidemiol. 1994;139:119-29.
7. Lapidus L, Bengstson C, Larsson B, Pennert K, Rybo, Sjostrom L. Distribution of adipose tissue and risk of cardiovascular disease and death: A 12-year follow up of participants in the population study of
women in Gothenberg, Sweden. BMJ.
1984;289:1257-61.
8. Lean MEJ, Han TS, Morrison CE. Waist circumference as a measure of indicating need for weigh management. BMJ. 1995;311:158-61.
9. Folsom AR, Kushi LH, Anderson KE, Mink PJ, Olson JE, Hong CP, et al. Association of general and abdominal obesity with multiple health outcomes in older women. Arch Intern Med. 2000;160:2117-128. 10. Yusuf S, Hawken S, Ounpuu S, Bautista L, Franzosi
MJ, Commerford P. Obesity and risk of myocardial infarction in 27000 participants from 52 countries- a case controlled study. Lancet. 2005;366:1640-49. 11. Welborn TA, Dhaliwal SS, Bennett SA. Waist-hip
cardiovascular death in Australia. Medical Journal of Australia. 2003;179:580-5.
12. Dudekula AB, Naik JL, Reddy KSN. Correlation between blood sugars and body mass index with blood pressure among the Type 2 diabetic adults. Asian J Exp Biol Sci. 2012;3(2):383-7.
13. India reworks obesity guidelines, BMI Lowered. Available at http: //www.igovernment.in./site/India-reworks-obesity-guidelines-BMI-lowered/. Assessed 2014.
14. Misra AP, Chowbey BM, Makkar NK, Vikram JS, Chadha WD, Shashank RJS, et al. Consensus statement for diagnosis of obesity, abdominal obesity and metabolic syndrome for Asian Indians and recommendations for physical activity, medical and surgical management. JAPI. 2009;57:163-70.
15. World Health Organization. Obesity- preventing and managing the Global Epidemic: Report of a WHO consultation on obesity. Geneva: World Health Organization; 1988.
16. Ardern Cl, Katzmarzyk PT, Janssen I, Ross R. Discrimination of health risk by combined body mass index and waist circumference. Obes Res. 2003;11(1):135-42.
17. Janiszewski PM, Janssen I, Ross R. Does waist circumference predict diabetes and cardiovascular disease beyond commonly evaluated cardio metabolic risk factors? Diabetes Care. 2007;30(12):3105-9.
18. Mesinger C, Doring A, Thorland B, Heier M, Lowel H. Body fat distribution and risk of type 2 diabetes in the general population: are there differences between men and women? The MONICA/KORA Augsburg cohort study. Am J Clin Nutr. 2006;84(3):483-9. 19. Kumanyika SK. Obesity in minor population: an
epidemiologic assessment. Obes Res. 1994;2166-83.
20. Narsingrao BS. Nutrient composition of Indian Foods. National Institute of Nutrition, Hyderabad; 1989.
21. WHO expert consultation. Appropriate body-mass index in Asian population and its implications for policy and intervention strategies. Lancet. 2004;363:157-63.
22. Ram BS, Shanti SR, Paturi VR, Sidharth D, Madhu V, Ashok KD, et al. Diet and lifestyle guidelines and desirable levels of risk factors for prevention of diabetes and its vascular complications in Indians: a scientific statement of The International College of Nutrition. J Cardiovascular Risk. 1997;4:201-8. 23. Yajnik CS, Yudkin JS. The Y-Y Paradox. The
Lancet. 2004;363(9403):163.
24. McKeigue PM, Shah B, Marmot MG. Relation of central obesity and insulin resistance with high diabetes prevalence and cardiovascular risk in South Asians. Lancet. 1991;337:382-6.
25. Gupta R, Gupta VP. Meta-analysis of coronary heart disease prevalence in India. Indian Heart J. 1996;48:241-5.
26. Ramchandran A, Snehalatha C, Latha E, Vijay V, Vishwanathan M. Rising prevalence of NIDDM in an urban population of South India. Diabetologia. 1997;40:232-7.
27. Prineas RJ, Folsom AR, Kaye SA. Central obesity and increased of cornonary artery disease mortality in older women. Ann Epidemiol. 1993;3:35-41.
28. Kamath A, Shivaprakash G, Adhikari P. Body mass index and waist circumference in Type 2 Diabetes mellitus patients attending a diabetes clinic. Int J Bio Med Res. 2011;2(3):636-8.
29. Shields M, Tremblay MS, Gorber SC, Janssen I. Abdominal obesity and cardiovascular disease risk factors within body mass index categories. Health Reports. 2012;23(2):7-15.
Cite this article as: Patil SS, Gadre S, Sukumaran S. Correlation of body mass index, waist
![Bis[hydrotris(4 chloro 3,5 dimethylpyrazolyl)borato]nickel(II)](data:image/gif;base64,R0lGODlhAQABAIAAAP///wAAACH5BAEAAAAALAAAAAABAAEAAAICRAEAOw==)