1 Dr Tanisha Jowsey, 27 April 2016
Centre for Medical and Health Sciences Education, University of Auckland
Suggested citation: Jowsey T. 2016. General purpose thematic data analysis made easy. Centre for Medical and Health Sciences Education, University of Auckland. Available from:
https://www.fmhs.auckland.ac.nz/en/som/cmhse/our-resources.html
This short document is meant as a resource for postgraduate students and analysts of medical or health science data who want to undertake general purpose thematic data analysis, and are not sure how to proceed. There are many excellent books out there that offer step-by-step guides to data analysis, and I have listed a few of my favourites at the end of this resource. However, often analysts find that reading such books can make the act of conducting thematic analysis seem more complicated than it needs to be and even confusing. They can get caught up on all sorts of intricacies, such as in-vivo coding (using a quote as the code’s name) versus thematic
summarisation of the quote into a code.
Once data is collected the analyst should have audio-data transcribed verbatim.
Thematic analysis is all about making sense of and grouping data. Image detail: Tanisha Jowsey and Hugh Brocklebank. Thematic analysis.
2
REFLEXIVITYANDBIAS
Our experiences, knowledge and views shape the way we interpret the world around us, including how we interpret data. Being aware of this is often called reflexivity. If the data analyst is also the person who collected the data then we would hope that they have considered reflexivity and bias prior to data collection, particularly if a phenomenological approach is taken.
Before embarking on data analysis the analyst should consider their own
experiences, positions, knowledge and views, and how this could inform the way they approach the data. Taking time to reflect on what impact the analyst’s own position might make on the way they collect or interpret data is an important step towards being reflective and transparent throughout the analysis process.
Useful questions to ask yourself:
• What are my views on this subject?
• Could I have biases towards certain issues within this subject?
• If so, how can I account for or mitigate such biases?
For example, I am somewhat obsessed with time. So when I approach data, knowing this about myself, if I identify key themes in the data about time I check in with another experienced data analyst (or the research participants) to check whether they see these themes too or whether only I am seeing these things because of my special interest in them.
GROUPINGDATA
As reading through the transcripts, the analyst asks these questions of the data: • What is this about?
• What does it mean?
• What are the common facets/issues/dimensions/topics/themes here? (for example, these might be emotions, circumstances, others involved (teams, staff interactions, attitudes of others), strategies, learning, barriers,
3 These kinds of questions would be applied to each little chunk of data (quotes), so as you are reading through the page you might notice that there are three or four topics covered by the participant.
Now you have completed the first run through the transcript data and have identified a few common facets/issue/dimensions/topics/themes.
IDENTIFYINGTHEMES
The next step is to group data of the same facets/issue/dimensions/topics/themes together, and then read all that data together.
For example, at different points in their interviews, four of the analyst’s participants discuss having their blood pressure taken. The analyst has written the term ‘blood pressure’ beside the sections in the transcript where BP is mentioned. Now each of these quotes concerning BP are lumped together.
If the analyst is using a software package to this, such as QSR NVivo 10, they would create a code (node) and might call it ‘Blood pressure.’ They code each quote to the Blood pressure node.
If the analyst has a small dataset (of 6-10 interviews that are each about 15 minutes long) they might prefer to do this analysis by hand. In which case, they simply write the name of the node by the quote, cut out the quote and place it by other quotes of the same node. This can be difficult when a quote is clearly about more than one facet/issue/dimension/topic/theme; in which case print out multiple copies of the quote to code to each.
There are eight quotes coded to blood pressure. Now the analysis looks for patterns in those eight quotes. Two of the quotes are about the equipment used. Six of the quotes are about seeking permission from the patient to take their blood pressure. So the analyst creates two sub-nodes; ‘equipment’ and ‘seeking permission’, see figure 1. Sometimes it might be a bit unclear how the two sub-nodes differ; in which case write up a definition for each. The definition might include when to code and when not to. The definition outlines where the analyst thinks the boarders of the facet/issue/dimension/topic/theme may lie. This can always be revised later as analysis progresses.
Figure 1. Blood pressure theme and subthemes example
Seeking permission (n=6)
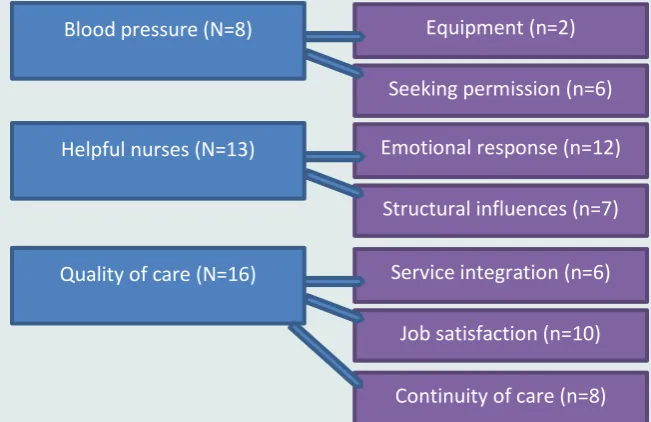
4 The analyst continues this process of coding until they have coded all the data, see figure 2.
Figure 2. Themes and subthemes example
Some quotes may be just as much about one node as they are about another node, in which case the analyst codes them to both nodes. This is called ‘double coding.’
NUMBERS
I have listed some numbers in the Figures above. The capital N represents number of participants who covered this topic. The lower case n represents the number of quotes about the topic. Do these numbers suggest that Quality of care was deemed more important than Blood pressure? Perhaps these numbers reflect the questions asked, or the characteristics of the participants. We don’t really have enough
information in Figure 2 to be sure about what the numbers mean. Sometimes we do see clear patterns in the numbers that can support our thinking during the thematic analysis. In Figure 2, we might take the numbers to support the rearrangement of themes into one overarching theme – Quality of care. All other major themes and sub-themes might be rearranged under that.
Don’t get caught up on numbers. If you find yourself at 3am puzzling over the nine participants who said X versus the 16 participants who reported Y then you may have accidentally slipped into a content analysis, where different proportions of the content are deemed important, and the number of times a word is used could
Continuity of care (n=8) Job satisfaction (n=10)
Quality of care (N=16) Service integration (n=6)
Structural influences (n=7)
Helpful nurses (N=13) Emotional response (n=12)
Seeking permission (n=6)
5 indicate its importance. If you think this may have happened, practice some
mindfulness, drink warm milk, and go to sleep.
DATACHECK
The next step is reading through the data again against the codes. With the themes in mind read through the data again and ask these questions:
• Are all the main themes present? • Am I missing anything?
• When I read through the list of codes and sub-codes do I have a sense of what this data is generally about?
More coding may be required at this point to address any gaps. If it seems like the themes capture the essence of what participants have discussed then move on to the next step.
WHITTLETHEDATADOWNINTOTHEMES
The analyst has a lot of codes now, and for fear of missing anything, has possibly even over-coded. The task now is to whittle it down to the essential pieces of information.
Here are some useful questions to ask of the data at this point: • So what?
• Why are they telling me this?
• How does this relate to what other participants are saying? • What other issues (themes) does this relate to?
If the analyst is the same person who collected the data, and if they have taken down memos (written summary notes during or shortly after data collection) then it can be a useful exercise to return to these memos and check whether the same central
themes identified in the memos are consistent with the themes identified during this phase of analysis.
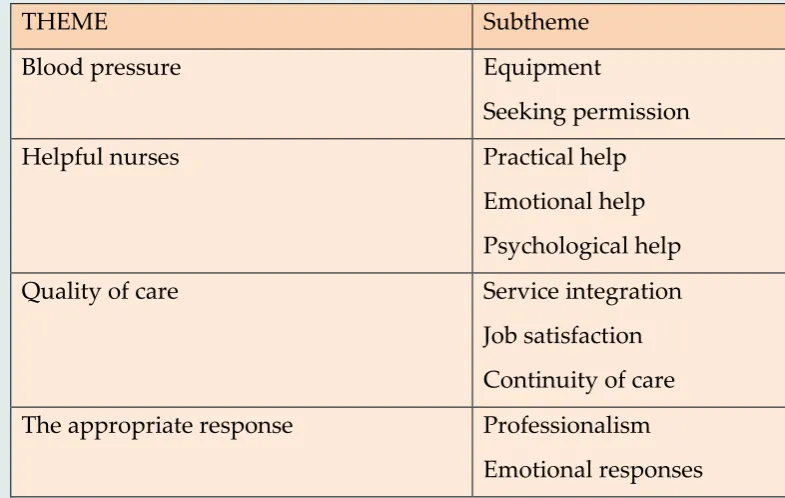
6 It sounds easy to say that I put them into a table, but this is not easy at all. The
process can take a long time to get right. Some subthemes may turn up under more than one theme at first. Does this mean that the two themes are connected? Or does it mean that the subtheme might actually be a major theme? It usually works out a lot clearer to the reader if the analyst is able to state that while the themes are all inter-related that certain themes are strongly associated with particular attributed or sub-themes.
Table 1. Example of themes and subthemes in a table
THEME Subtheme
Blood pressure Equipment
Seeking permission
Helpful nurses Practical help
Emotional help Psychological help
Quality of care Service integration
Job satisfaction Continuity of care
The appropriate response Professionalism
Emotional responses
WRITEUPTHEFINDINGS
7 Example of written findings:
Blood Pressure
Participants reported that blood pressure was important to them. They were particularly concerned with the types of equipment used to measure blood pressure. When they were unfamiliar with equipment they reported feeling “lost,” “unsure,” “lacking confidence,” and “unprofessional.” One participant said, “when we got the new machine in it made a funny noise and I couldn’t figure it out. I didn’t want to use it until I could figure it out.” Participants also reported that they felt it was important to seek the patient’s permission prior to taking the patient’s blood pressure. They said:
“I always ask permission first” (Lucy, Senior nurse, 48 years old) “I just check it’s okay with them so they know what I’m doing. That way there’s no surprises” (Max, nurse, 35 years old)
The analyst should demonstrate saturation of the ideas by providing multiple quotes for each theme, but not so many that the reader is left overwhelmed with data, or worse, left to do some of the analysis for themselves.
The analyst follows the table systematically. They write the theme, describe its area, including sub-themes, provide quotes to illustrate, demonstrate saturation, and summarise the way that this theme relates to other themes. Then move on to the next theme and do the same again.
CONCLUSIONS
The analyst should conclude with drawing together the major themes and the way that each major theme connects with other themes, and how they contribute to our understanding of the topic.
Useful questions:
• How do the major themes relate to one another?
• So what? What is the ‘take home’ message of my analysis?
8
BUDDYCHECK
At any of these data analysis and writing stages it can be productive, supportive, and constructive to bounce your ideas off of another person. It is usually most helpful to find someone who is experienced in qualitative data analysis to do this with. For best results I ask my buddy to read the data through and then we have a discussion about what we each see in the data. I explain what I think the key themes are and what each theme comprises of. My buddy asks me questions about the limits of the theme, how it connects with other themes, and what it all means.
MEMBERCHECK
Some qualitative researchers advocate for a ‘member check’ as well (whereby the analyst checks with participants whether they are on the right track with their analysis). Sometimes this can be a very helpful thing to do. Sometimes it can be a bit tricky when participants have strong agendas and are forceful in asserting their agendas. Also participants may want to ‘soften’ or change statements or analysis of what they have said because when they see it written down they perceive it as seeming too harsh or strongly opinionated. Allowing participants to make
significant changes (to change the meaning) is not recommended because doing so may blunt or skew the analysis.
Set expectations
The analyst should ensure that they make it clear to the participants what their goals are in the member check and how the participants can be most helpful towards meeting those goals.
When should you do a member check?
The member check, if undertaken, should be conducted after a table of themes is created, when the analyst is fairly confident that the table captures the key aspects of the data.
9 If you still have many questions you might need to do some more reading of existing literature concerning undertaking thematic analysis. You might benefit from looking at strong examples of thematic analysis in the literature.
Here are two thematic analysis articles that I have worked on where you can see real data and results:
Yates KM, Webster CS, Jowsey T, Weller JM. In situ simulation training in
emergency departments: what patients really want to know. BMJ Simulation and Technology Enhanced Learning. 2015 Jul 1;1(1):33-9.
Jeon YH, Jowsey T, Yen L, Glasgow NJ, Essue B, Kljakovic M, Pearce-Brown C, Mirzaei M, Usherwood T, Jan S, Kraus SG. Achieving a balanced life in the face of chronic illness. Australian Journal of Primary Health. 2010 Apr 7;16(1):66-74.
USEFUL RESOURCES ABOUT UNDERTAKING THEMATIC ANALYSIS
Aronson, J. (1994). A pragmatic view of thematic analysis. The Qualitative Report, 2(1), 1-3.
Bazeley, P. (2013). Qualitative data analysis: Practical strategies: Sage.
Braun, V., & Clarke, V. (2013). Successful qualitative research: A practical guide for beginners: Sage.
Fereday, J., & Muir-Cochrane, E. (2008). Demonstrating rigor using thematic analysis: A hybrid approach of inductive and deductive coding and theme development. International Journal of Qualitative Methods, 5(1), 80-92.
Morse, J. M., & Field, P. A. (1995). Qualitative Research Methods for Health Professionals (2 ed.). California, USA.: Sage Publications.
Saldaña, J. (2012). The coding manual for qualitative researchers: Sage.
Savin-Baden, M., & Major, C. H. (2013). Qualitative research: The essential guide to theory and practice. Oxford: Routledge.
Thomas DR. A general inductive approach for analyzing qualitative evaluation data. American journal of evaluation. 2006 Jun 1;27(2):237-46.
Acknowledgements
I would like to thank Andrea Thompson,