Over the past few years, South Africa (SA) has seen a dramatic increase in the provision of antiretroviral therapy (ART) to persons living with HIV and AIDS (PLWHA). Approximately 4.4 million persons are receiving ART in SA (71% of persons who know their HIV status), and the goal is to increase this figure to 90% of all PLWHA by 2020.[1,2] Most PLWHA (85%) receive their medications
through public sector facilities.[3] While this places a substantial
burden on heath sector logistics and the health budget,[4] it has
decreased the annual number of deaths from HIV and AIDS and improved the quality of life of many PLWHA.[5,6]
Many factors can affect a patient’s adherence to ART, including adherence self-efficacy, satisfaction with the health service provider, and concerns about ART. Substance use, especially alcohol use, also influences PLWHA’s adherence to ART.[7-9] Non-adherence to
ART contributes to patients having a higher viral load.[10] SA has
been identified as a country with one of the highest levels of heavy drinking globally.[11] A recent general population survey in one
metropolitan area in the country, Tshwane, found that over 90% of
drinking occasions, defined as 8 drinks of 15 mL (12 g) for men and 6 drinks for women.[12]
However, fairly little is known about the drinking behaviours of patients on ART in SA,[13] including in the Tshwane metropole
in Gauteng Province. One cross-sectional survey, conducted in two HIV clinics in Tshwane, found that the Alcohol Use Disorders Identification Test (AUDIT)[14] scores of half the male and
three-quarters of the female drinkers were indicative of hazardous or harmful drinking. For a third of the participants adherence to ART fell below the generally acceptable level of 95%, and there was a trend towards a lower proportion of participants with high ART adherence as the quantity of alcohol use increased.[15] Research conducted in
other parts of the country has found even higher levels of problem drinking in this patient population. For example, a study among HIV clinic attendees in Cape Town (most of whom were on ART) found hazardous or harmful alcohol consumption in ~9 out of 10 drinkers screened with the AUDIT.[16]
It has been proposed that hazardous alcohol consumption or
Characteristics and drinking behaviour of patients on
antiretroviral therapy who drink and attend HIV clinics
in Tshwane, South Africa: Implications for intervention
C D Parry,1,2 PhD; M Londani,3 MSc; P A Shuper,4,5,6 PhD; B Myers,1,7 PhD;C T Kekwaletswe,3 PhD; S Nkosi,3 MA; N K Morojele,3,8,9 PhD
1Alcohol, Tobacco and Other Drug Research Unit, South African Medical Research Council, Cape Town, South Africa 2Department of Psychiatry, Faculty of Medicine and Health Sciences, Stellenbosch University, Cape Town, South Africa 3Alcohol, Tobacco and Other Drug Research Unit, South African Medical Research Council, Pretoria, South Africa 4Institute for Mental Health Policy Research,Centre for Addiction and Mental Health, Toronto, Canada
5Dalla Lana School of Public Health, University of Toronto, Canada
6Institute for Collaboration on Health, Intervention, and Policy, University of Connecticut, Mansfield, Conn., USA 7Department of Psychiatry and Mental Health, Faculty of Health Sciences, University of Cape Town, South Africa 8School of Public Health, Faculty of Health Sciences, University of the Witwatersrand, Johannesburg, South Africa 9School of Public Health and Family Medicine, Faculty of Health Sciences, University of Cape Town, South Africa
Corresponding author: C D Parry ([email protected])
Background. Patients on antiretroviral therapy (ART) who drink alcohol are at risk of poor medication adherence and negative health outcomes.
Objectives. To explore the drinking behaviour of patients on ART and assess the associations between drinking, adherence to ART and viral load, and in particular factors associated with binge drinking (≥6 drinks per occasion) at least monthly.
Methods. We recruited 623 HIV patients from six hospitals in the Tshwane metropole who scored positive on the Alcohol Use Disorders Identification Test (AUDIT-C) but were ‘non-dependent’ drinkers into a randomised controlled trial. This article reports on baseline data. Results. Of the patients, 51% reported drinking in the past week, 60% of men and 33% of women consumed ≥6 standard drinks on a typical drinking day, and 19% of men and 5% of women were identified as drinking at harmful levels. Over a quarter reported having a friend or relative, or a doctor or other healthcare worker, express concern about their drinking or suggest that they cut down. AUDIT total scores were significantly negatively correlated with self-reported adherence to ART and positively correlated with viral load. Number of years on ART was not significantly associated with binge drinking. Persons who were employed part time (odds ratio (OR) 1.474) or were self-employed (OR 2.135) were more likely to binge-drink than unemployed persons. Beer drinkers (OR 1.716) were more at risk for binge drinking than non-beer drinkers, and persons who drank monthly or less (OR 0.053) or 2 - 4 times a month (OR 0.168) were less at risk for bingeing than those who drank ≥4 times per week.
Conclusions. The high volume of alcohol consumed per occasion by patients on ART, especially beer and spirits drinkers, is a concern. Interventions that address structural drivers of heavy drinking and target HIV patients at risk of heavy drinking are needed.
if frequency of such consumption is once a week or more, and by 6.4 years with daily consumption.[17] Compared with beer and
wine, consumption of spirits has been found to be associated with poor virological and immunological control in patients on ART. [18]
Given these findings, it would be useful to identify how often patients on ART in SA drink, how much they drink, and what they are consuming. Better information is also needed regarding the effect of alcohol use on viral load and ART adherence. Another important question to investigate is whether length of time on ART is predictive of drinking behaviour. This point is important because research has shown that increased drinking, at least in women on ART, is associated with a decreased likelihood of adherence and viral suppression.[19] Frequency and quantity of alcohol consumption may
well increase over time as patients start to feel better on ART. All this information may help inform treatment and management guidelines for patients on ART who drink in a part of the world not known for its moderate consumption of alcohol.[11]
In 2014, the South African Medical Research Council funded a randomised controlled trial to determine the efficacy of an alcohol-focused intervention for improving adherence to ART and HIV treatment outcomes.[20] For the present study we used baseline data
from this study to: (i) describe the drinking behaviour of patients who drink while on ART and selected health consequences; (ii) assess the associations between binge drinking and adherence to ART and viral load; (iii) assess whether patients who had been on ART longer were more at risk for negative drinking outcomes; and (iv) in particular, assess whether binge drinking among PLWHA on ART is associated with particular demographic characteristics, their frequency of drinking, and the type of alcohol consumed.
Methods
Design
The methodology of the larger study is described in detail elsewhere.[20]
The data reported on in this article come from cross-sectional baseline data collected after participants were first recruited into the study.
Participants and procedures
Study participants were recruited at ART clinics in four district and two tertiary hospitals in Tshwane. Inclusion criteria were as follows: being HIV-positive; being on ART for at least 3 months; not currently being on treatment for tuberculosis; being ≥18 years old; being a current (past year) harmful/hazardous drinker (not dependent) as measured by the AUDIT-C[21] (AUDIT-C score ≥4 for men and ≥3 for women, but total
AUDIT[14] score <23); being resident in/around Tshwane; not being
enrolled in another trial; and not having extremely poor general health/ functional status (Karnofsky clinical score >50).[22,23]
Fieldworkers approached all patients seen at the ART clinics for eligibility screening. The patients were requested to give consent for both the initial screening and, if eligible, participation in the main study. The questionnaires were administered by trained fieldworkers in a private space and blood was collected by phlebotomists to assess viral load. Viral loads between 51 and 999 copies/mL are deemed detectable and viral loads >1 000 copies/mL as indicative of risk of treatment failure.
Participants received a grocery voucher of ZAR80 (~USD6.50) for their time and participation in these interviews. Ethical approval for the study was granted by the Ethics Committee of the South African Medical Research Council (ref. no. EC003-2/). Permission for the study was obtained from the hospitals, the health districts and Gauteng Province. The larger trial was registered by the Pan African Clinical Trials Register (ref. no. PACTR201405000815100).
In total, 3 054 PLWHA were screened across the six facilities and 2 085 (442 men and 1 643 women) were screened out because they did not meet the drinking criteria for inclusion in the study. This means that they scored below or above the cut-off levels on the AUDIT-C/AUDIT. Of the 3 054 PLWA screened, 848 were found to be eligible for participation. Of these, 623 were finally enrolled at baseline. Of the patients who were eligible, 225 were not enrolled for a variety of reasons: not answering their phones; no longer being interested in participation; they had relocated; they confirmed but did not arrive for their appointment; or they could not get time off work. One patient died, one was wrongly enrolled, and one withdrew before completing the baseline assessment.
Assessment tools
Among the questions in the survey instrument[20] were demographic
questions (age, gender, marital status, education, employment, sources of income, monthly income) and years on ART. We included the full 10 items of the AUDIT.[14] Particular attention was given to
three quantity frequency questions from the AUDIT, but focusing on the past 3 months rather than the past 12 months so that we could compare the AUDIT results at the 3-month and 6-month follow-up points with baseline: ‘How often do you have a drink containing alcohol?’, ‘How many standard drinks containing alcohol do you have on a typical day when drinking?’, and ‘How often do you have 6 or more drinks on one occasion?’ In addition, we asked the subjects when they last consumed alcohol in the past 3 months, the types of alcohol usually consumed (past-month drinkers), and the largest number of drinks consumed on a single day. With regard to consequences of drinking, we focused on the last seven items from the AUDIT (see Table 3). The instrument also included various questions about adherence to ART, including the visual analogue scale (VAS), which assesses general levels of adherence over a 30-day timeframe and requires respondents to place a mark on a visual scale going from 0% to 100%.[24]
Data analysis
Data analysis included the provision of descriptive statistics, frequency tables and cross-tabulations with χ2 tests of association.
Spearman’s rank correlation was used to assess correlations between total AUDIT scores and viral load, adherence to ART and years on ART because of the non-normality of the variables of interest. In order to identify factors associated with monthly or more frequent binge drinking (≥6 drinks on at least one occasion), variables found in bivariate analyses to be significantly associated at p<0.05 with binge drinking were entered into multiple logistic regression using forward stepwise selection of independent variables according to the Wald method. For this analysis we used Stata vce(cluster site) (Stata Statistical Software release 14; StataCorp, USA) in order to control for the cluster sampling of the six hospitals. All other analyses were performed using SPSS v25 (IBM, USA) and did not control for cluster sampling of the hospitals.
Results
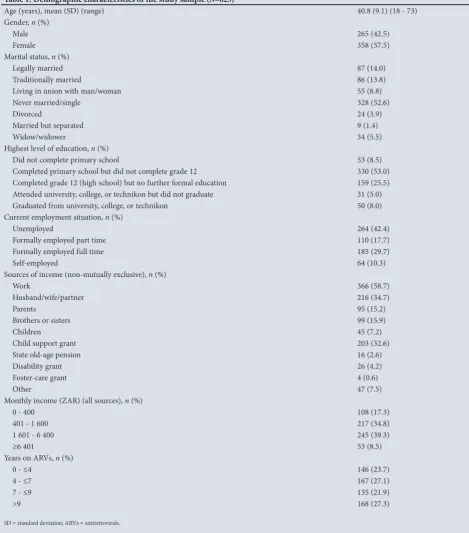
Demographic characteristics and years on ART
Drinking behaviour
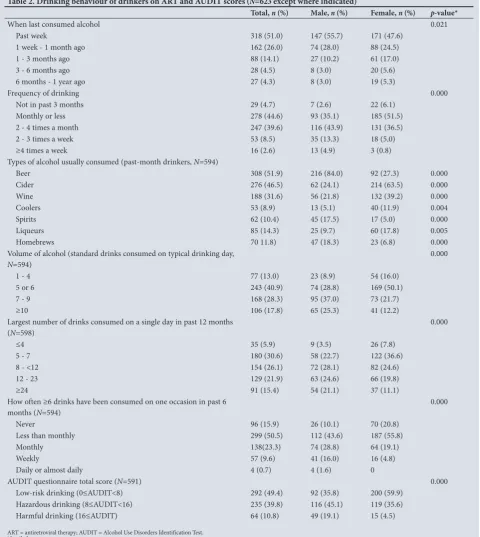
Just over half of the study participants (51%) had consumed alcohol in the past week, with a high proportion reporting that they typically drank beer (52%), cider (47%) and wine (32%) (Table 2). Even though frequency of consumption was relatively low, the volumes consumed on a typical drinking day were very high, with 87% reporting consuming at least 5 drinks and 18% reporting drinking as many as 10 drinks per occasion. The largest number of drinks consumed on a single day in the past 12 months was also high, with 37% reporting drinking a minimum of 12 drinks. More than a third
(37%) reported at least monthly binge drinking, defined as drinking at least 6 drinks on one occasion in the past 6 months.
[image:3.595.70.540.110.644.2]Based on their AUDIT scores, just under half of the study participants were defined as low-risk drinkers, while 40% could be categorised as hazardous drinkers and 11% as harmful drinkers. Significant gender differences were noted with regard to drinking behaviour, with men more likely to have drunk alcohol more recently and to drink at greater volumes. In contrast to men, who were likely to consume beer, spirits and homebrews, women typically consumed cider, wine, coolers and liqueurs. AUDIT total scores ranged from Table 1. Demographic characteristics of the study sample (N=623)
Age (years), mean (SD) (range) 40.8 (9.1) (18 - 73)
Gender, n (%)
Male 265 (42.5)
Female 358 (57.5)
Marital status, n (%)
Legally married 87 (14.0)
Traditionally married 86 (13.8)
Living in union with man/woman 55 (8.8)
Never married/single 328 (52.6)
Divorced 24 (3.9)
Married but separated 9 (1.4)
Widow/widower 34 (5.5)
Highest level of education, n (%)
Did not complete primary school 53 (8.5)
Completed primary school but did not complete grade 12 330 (53.0)
Completed grade 12 (high school) but no further formal education 159 (25.5)
Attended university, college, or technikon but did not graduate 31 (5.0)
Graduated from university, college, or technikon 50 (8.0)
Current employment situation, n (%)
Unemployed 264 (42.4)
Formally employed part time 110 (17.7)
Formally employed full time 185 (29.7)
Self-employed 64 (10.3)
Sources of income (non-mutually exclusive), n (%)
Work 366 (58.7)
Husband/wife/partner 216 (34.7)
Parents 95 (15.2)
Brothers or sisters 99 (15.9)
Children 45 (7.2)
Child support grant 203 (32.6)
State old-age pension 16 (2.6)
Disability grant 26 (4.2)
Foster-care grant 4 (0.6)
Other 47 (7.5)
Monthly income (ZAR) (all sources), n (%)
0 - 400 108 (17.3)
401 - 1 600 217 (34.8)
1 601 - 6 400 245 (39.3)
≥6 401 53 (8.5)
Years on ARVs, n (%)
0 - ≤4 146 (23.7)
4 - ≤7 167 (27.1)
7 - ≤9 135 (21.9)
>9 168 (27.3)
2 to 28, with a mean (SD) of 8.88 (4.74). Greater proportions of women than men were classified as lower-risk drinkers according to the AUDIT, and greater proportions of men than women were categorised as hazardous and harmful drinkers (Table 2).
Selected consequences of drinking
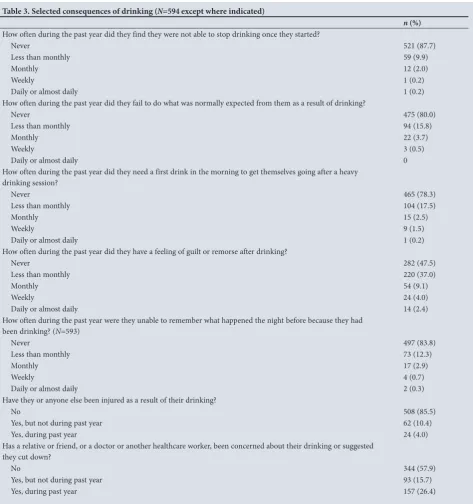
The last seven items of the AUDIT questionnaire revealed a number of negative consequences associated with drinking among study participants (Table 3). Of particular note was the high proportion
(16%) reporting having feelings of guilt or remorse at least monthly after drinking. In addition, over a quarter (26%) reported having had a relative or friend, or a doctor or other healthcare worker, express concern about their drinking during the past year or suggest that they cut down.
Viral load, self-reported adherence to ART, years on
ART and association with total scores on the AUDIT
[image:4.595.49.530.218.756.2]Fourteen percent of study participants showed evidence of not being
Table 2. Drinking behaviour of drinkers on ART and AUDIT scores (N=623 except where indicated)
Total, n (%) Male, n (%) Female, n (%) p-value*
When last consumed alcohol 0.021
Past week 318 (51.0) 147 (55.7) 171 (47.6)
1 week - 1 month ago 162 (26.0) 74 (28.0) 88 (24.5)
1 - 3 months ago 88 (14.1) 27 (10.2) 61 (17.0)
3 - 6 months ago 28 (4.5) 8 (3.0) 20 (5.6)
6 months - 1 year ago 27 (4.3) 8 (3.0) 19 (5.3)
Frequency of drinking 0.000
Not in past 3 months 29 (4.7) 7 (2.6) 22 (6.1)
Monthly or less 278 (44.6) 93 (35.1) 185 (51.5)
2 - 4 times a month 247 (39.6) 116 (43.9) 131 (36.5)
2 - 3 times a week 53 (8.5) 35 (13.3) 18 (5.0)
≥4 times a week 16 (2.6) 13 (4.9) 3 (0.8)
Types of alcohol usually consumed (past-month drinkers, N=594)
Beer 308 (51.9) 216 (84.0) 92 (27.3) 0.000
Cider 276 (46.5) 62 (24.1) 214 (63.5) 0.000
Wine 188 (31.6) 56 (21.8) 132 (39.2) 0.000
Coolers 53 (8.9) 13 (5.1) 40 (11.9) 0.004
Spirits 62 (10.4) 45 (17.5) 17 (5.0) 0.000
Liqueurs 85 (14.3) 25 (9.7) 60 (17.8) 0.005
Homebrews 70 11.8) 47 (18.3) 23 (6.8) 0.000
Volume of alcohol (standard drinks consumed on typical drinking day,
N=594) 0.000
1 - 4 77 (13.0) 23 (8.9) 54 (16.0)
5 or 6 243 (40.9) 74 (28.8) 169 (50.1)
7 - 9 168 (28.3) 95 (37.0) 73 (21.7)
≥10 106 (17.8) 65 (25.3) 41 (12.2)
Largest number of drinks consumed on a single day in past 12 months
(N=598) 0.000
≤4 35 (5.9) 9 (3.5) 26 (7.8)
5 - 7 180 (30.6) 58 (22.7) 122 (36.6)
8 - <12 154 (26.1) 72 (28.1) 82 (24.6)
12 - 23 129 (21.9) 63 (24.6) 66 (19.8)
≥24 91 (15.4) 54 (21.1) 37 (11.1)
How often ≥6 drinks have been consumed on one occasion in past 6 months (N=594)
0.000
Never 96 (15.9) 26 (10.1) 70 (20.8)
Less than monthly 299 (50.5) 112 (43.6) 187 (55.8)
Monthly 138(23.3) 74 (28.8) 64 (19.1)
Weekly 57 (9.6) 41 (16.0) 16 (4.8)
Daily or almost daily 4 (0.7) 4 (1.6) 0
AUDIT questionnaire total score (N=591) 0.000
Low-risk drinking (0≤AUDIT<8) 292 (49.4) 92 (35.8) 200 (59.9)
Hazardous drinking (8≤AUDIT<16) 235 (39.8) 116 (45.1) 119 (35.6)
Harmful drinking (16≤AUDIT) 64 (10.8) 49 (19.1) 15 (4.5)
virally suppressed, i.e. had viral loads >1 000 copies/mL (14.5% of men and 13.4% of women). Just under 10% (9.6%, 13.3% of men and 6.8% of women) had detectable viral loads (i.e. 51 - 999 copies/ mL). Women were significantly more likely than men to be virally suppressed (χ2=7.29; p=0.026). Self-reported adherence to ART
over the past month using the VAS averaged 92.4% (SD 13.49, range 0 - 100).
A statistically significant but small positive correlation was found between participants’ viral loads and their total AUDIT score (Spearman’s r=0.112; p=0.010). In contrast, a statistically significant negative correlation (Spearman’s r=–0.227) was found between VAS adherence scores and total scores on the AUDIT. Years on ART was not found to be statistically correlated with total AUDIT scores (Spearman’s r=–0.065; p=0.117).
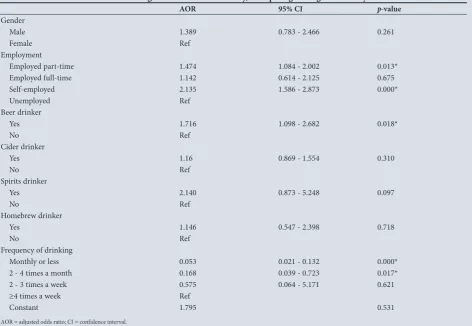
Variables associated with monthly binge drinking
The following variables were found in bivariate analyses to be associated with monthly binge drinking: gender, i.e. being male
(p=0.000); current employment situation, i.e. being employed
(p=0.000); drinking beer (p=0.000), cider (p=0.002), spirits
(p=0.000) or homebrews (p=0.034); and drinking frequency
[image:5.595.72.546.98.603.2](p=0.000) (Table 4). The results of the multiple logistic regression model are presented in Table 5. Persons who were employed part time or were self-employed were 47% and 114% more likely to binge drink than unemployed persons. Beer drinkers were 72% more likely than non-beer drinkers to engage in monthly binge drinking. Persons who drank monthly or less often were 5.3% as likely to engage in monthly binge drinking as persons who drank ≥4 times per week, and persons who only drank 2 - 4 times per month were Table 3. Selected consequences of drinking (N=594 except where indicated)
n (%) How often during the past year did they find they were not able to stop drinking once they started?
Never 521 (87.7)
Less than monthly 59 (9.9)
Monthly 12 (2.0)
Weekly 1 (0.2)
Daily or almost daily 1 (0.2)
How often during the past year did they fail to do what was normally expected from them as a result of drinking?
Never 475 (80.0)
Less than monthly 94 (15.8)
Monthly 22 (3.7)
Weekly 3 (0.5)
Daily or almost daily 0
How often during the past year did they need a first drink in the morning to get themselves going after a heavy drinking session?
Never 465 (78.3)
Less than monthly 104 (17.5)
Monthly 15 (2.5)
Weekly 9 (1.5)
Daily or almost daily 1 (0.2)
How often during the past year did they have a feeling of guilt or remorse after drinking?
Never 282 (47.5)
Less than monthly 220 (37.0)
Monthly 54 (9.1)
Weekly 24 (4.0)
Daily or almost daily 14 (2.4)
How often during the past year were they unable to remember what happened the night before because they had been drinking? (N=593)
Never 497 (83.8)
Less than monthly 73 (12.3)
Monthly 17 (2.9)
Weekly 4 (0.7)
Daily or almost daily 2 (0.3)
Have they or anyone else been injured as a result of their drinking?
No 508 (85.5)
Yes, but not during past year 62 (10.4)
Yes, during past year 24 (4.0)
Has a relative or friend, or a doctor or another healthcare worker, been concerned about their drinking or suggested they cut down?
No 344 (57.9)
Yes, but not during past year 93 (15.7)
only 17% as likely to engage in monthly binge drinking as persons who drank ≥4 times per week.
Discussion
[image:6.595.53.528.111.344.2]dependent drinkers on ART attending HIV clinics in Tshwane, SA. In broad terms, being employed increased the risk for ART patients who drink of being binge drinkers. Consumers of beer were significantly more likely to be binge drinkers than patients whose Table 4. Variables associated with drinking ≥6 drinks at least monthly, bivariate analyses
χ2-value df p-value*
Gender 34.08 1 0.000
Age 1.14 3 0.769
Marital status† 1.80 1 0.180
Highest education 2.32 4 0.678
Current employment situation 18.33 3 0.000
Monthly income (all sources) 5.49 3 0.139
Type of alcohol consumed
Beer 33.29 1 0.000
Cider 9.61 1 0.002
Wine 0.00 1 0.979
Coolers 0.74 1 0.391
Spirits 21.08 1 0.000
Liqueurs 0.72 1 0.395
Homebrews 4.48 1 0.034
Frequency of drinking 100.13 3 0.000
Years on ARVs‡ 2.908 3 0.406
df = degrees of freedom; ARVs = antiretrovirals. *2-sided test.
†Legally or traditionally married and living with spouse. ‡0 - <4, 4 - ≤7, 7 - ≤9, >9 years.
Table 5. Variables associated with drinking ≥6 drinks at least monthly, multiple logistic regression analyses†
AOR 95% CI p-value
Gender
Male 1.389 0.783 - 2.466 0.261
Female Ref
Employment
Employed part-time 1.474 1.084 - 2.002 0.013*
Employed full-time 1.142 0.614 - 2.125 0.675
Self-employed 2.135 1.586 - 2.873 0.000*
Unemployed Ref
Beer drinker
Yes 1.716 1.098 - 2.682 0.018*
No Ref
Cider drinker
Yes 1.16 0.869 - 1.554 0.310
No Ref
Spirits drinker
Yes 2.140 0.873 - 5.248 0.097
No Ref
Homebrew drinker
Yes 1.146 0.547 - 2.398 0.718
No Ref
Frequency of drinking
Monthly or less 0.053 0.021 - 0.132 0.000*
2 - 4 times a month 0.168 0.039 - 0.723 0.017*
2 - 3 times a week 0.575 0.064 - 5.171 0.621
≥4 times a week Ref
Constant 1.795 0.531
AOR = adjusted odds ratio; CI = confidence interval. *p<0.05.
†Variables entered in following order: drinking frequency, gender, spirits drinker, beer drinker. Employment situation, cider drinker and homebrew drinker did not enter the model (binary
[image:6.595.56.529.365.691.2]risk of binge drinking, with patients who drank monthly or less or only 2 - 4 times a month being less at risk of bingeing than patients who drank ≥4 times per week. In terms of HIV treatment-related consequences of drinking, AUDIT total scores were significantly negatively correlated with self-reported adherence to ART and positively correlated with viral load.
Just over half of the hazardous/harmful drinkers attending ART clinics in Tshwane reported drinking in the past week, with beer, wine and cider being the most common drinks usually consumed. These findings mirror what was found among drinkers in a representative community survey of adult drinkers in Tshwane in 2014, where 49% reported drinking at least weekly and 46% reported beer as their most commonly consumed drink, followed by cider (20%), spirits (15%) and wine (14%).[25] Ten percent of participants in the current
study reported weekly or more regular consumption of ≥6 drinks on an occasion, and 1.6% of men reported daily binge drinking at this level. This is of concern given that research has found that hazardous alcohol consumption decreases overall survival of PLWHA by >3 years if frequency of such consumption is once per week or more, and by 6.4 years with daily consumption.[17] There are various
mechanisms through which drinking by PLWHA on ART may increase the risk of mortality, the most obvious being that drinking, and especially binge drinking, has a negative effect on compliance with ART regimens. HIV and alcohol consumption both modulate innate and adaptive immunity, and drinking by PLWHA increases the possibility of viral replication and the likelihood of contracting opportunistic infections and developing other co-morbid conditions.
[7] In addition, the medications used to treat opportunistic infections
and other comorbid conditions interact with alcohol. Both ART medications and alcohol are metabolised by the liver, and alcohol-related liver toxicity results in compromised liver function. ART medications may therefore not work optimally in heavy drinkers, and they are also at increased risk of toxicity from ART.[7,26]
The finding that AUDIT total scores were negatively correlated with adherence and positively correlated with viral load was to be expected.[7,26] Eighty-six percent of study participants (86.6%
of women and 85.6% of men) were virally suppressed. National percentages in SA for viral suppression among PLWHA currently on ART are 88% for both genders,[2] ~2% higher than in our sample of
PLWHA on ART who were non-dependent drinkers.
This finding raises concerns both at a patient level, given the effect of viral load on the infectivity of PLWHA and the generally acceptable level of ART adherence of 95%,[7,15,26] and at a societal
level, given the national investment in ART in SA and the risk that resistance to ART will be increased.[1] It is possible that some of our
study participants could have had high viral loads because they were not yet stabilised on the correct ART regimen, but given that more than three-quarters of the study participants had been on ART for at least 4 years, this is a less likely explanation for these findings than alcohol consumption.[26] It was, however, encouraging that years on
ART was not found to be associated with binge drinking, suggesting that patients on ART do not increase their levels of drinking as their health starts to improve on ART.
The finding that that some groups of employed individuals on ART are more likely to engage in binge drinking than unemployed persons could be due to the fact that they had more disposable income. This hypothesis is supported by the trend that problematic drinking was higher among employed persons in the 2008 South
African HIV, Incidence, Behaviour and Communication Survey.[27]
The finding that beer drinkers on ART had significantly higher odds of binge drinking than non-drinkers of beer is also to be expected,
marketing of beer, and the particular kinds of marketing in SA that link consumption of beer to social and financial success.[28,29] In 2016,
of total above-the-line advertising on alcohol in SA, 47% was spent on beer.[30] In addition, beer in SA is mostly sold in large containers
holding in excess of two standard drinks, i.e. quart (750 mL) and 660 mL returnable bottles. In 2017 South African Breweries Ltd introduced a 500 mL can of Carling Black Label beer sold at the same price as its 440 mL cans.[31] The same company in 2017 also launched
its ‘Ama 1 litre’ Black Label bottle of beer. Increasing container size has had the effect of making beer more affordable, and it has also been argued that excise tax increases on beer in SA are differentially passed on to consumers according to packaging type, with a large proportion of the increase in excise taxes each year being carried by wealthier consumers of 340 mL cans of beer and the converse occurring for larger container sizes.[32] Moving to larger container
sizes is likely to have the effect of encouraging the purchasing of beer in larger container sizes. While there is little information on the effect of selling beer in containers of different sizes, research has shown that selling wine in larger containers is associated with increased consumption[33] and symptoms of alcohol problems as measured by
the CAGE questionnaire.[34]
Not only did the present study reveal high levels of binge drinking among many PLWHA on ART who were attending ART clinics in Tshwane, but ~16% of participants in the study reported feeling guilt or remorse after drinking and 1 in 4 indicated that during the past 12 months a relative or friend, or a doctor or another healthcare worker, had been concerned about their drinking or suggested they cut down. However, it is possible that this concern could have been because they were on ART. These findings support the goals of the main study,[20]
i.e. to test the efficacy of a blended motivational interviewing and problem-solving alcohol-focused intervention for hazardous and harmful drinking among PLWHA on ART, and the findings of an earlier pilot study.[13]
Formative work undertaken as part of the roll-out of this project found that a third of drinkers on ART in selected HIV clinics in Tshwane reported hazardous drinking and 10% harmful drinking, and that a further 10% were possibly dependent on alcohol.[17] It
furthermore pointed to the need for more routine screening of patients on ART to assess problem alcohol use.[17] The findings of
the present substudy confirm the need to ask HIV patients on ART questions about binge drinking and frequency of alcohol use, and specifically about their use of beer. The findings regarding the link between alcohol use (AUDIT total scores) and adherence to ART and viral load require further investigation to unpack the nature of the link and, if needed, interventions likely to be effective in improving ART adherence and decreasing viral load among HIV patients on ART who drink. These topics will be addressed in forthcoming articles.
Study limitations
or that not adhering to medications (perhaps because they make people feel worse) results in HIV patients drinking more, rather than the other way around. However, from a biological perspective these explanations are less likely than poor adherence and high viral load being an outcome of higher levels of alcohol consumption.[26]
We also only looked at ‘usual’ or alcoholic beverage of choice, and did not take into account the fact that people often drink more than one beverage type. To do this would probably have required a larger sample size, but may have produced more nuanced findings. Finally, the data reported on in this study relied on self-reported drinking and on a single measure of adherence, the VAS.[24] Neither of these
methods is optimal, but a biomarker for alcohol (dried blood spots to test for phosphatidylethanol, a biomarker of alcohol use) was collected as part of the study,[20] and we used three other self-report
measures of adherence. Furthermore, although adherence was based on self-report, we did have viral load data, an objective outcome that is an indicator of adherence. In addition, supplementary research was undertaken to assess ART concentrations/exposure as measures of adherence using hair and blood. These will be reported on as part of further analyses of the dataset.
Conclusions
The high levels of binge drinking by ART patients in this sample from Tshwane, SA, especially among beer and spirits drinkers, are of concern given the effect of heavy drinking on ART adherence and viral load that may undermine the national investment in ART. There appears to be a ‘perfect storm’ that continues to fuel the HIV epidemic in SA, in that there are heavy users of alcohol who have poor adherence to ART, and who therefore have increased viral loads. The findings support goals of the larger randomised controlled study[20] to intervene to reduce drinking levels among patients on
ART and the frequency of their drinking.
Declaration. None.
Acknowledgements. We acknowledge funding from the South African
Medical Research Council (Flagship Research) for the study referred to and for our (CDP, ML, BM, CTK, SN, NKM) time in preparing this manuscript. We also acknowledge (incentive) funding from the South African National Research Foundation (CDP). We are grateful to the field staff for collecting data for this study, to Frans Masango, Elizabeth Mamarigane, Shumani Makatu and Ruth Bokaba for supervising the data collection procedures, and to Elmarie Nel, Eileen Rich and Naledi Kitleli for supervising field personnel and assisting with research-related administrative processes. We also thank the staff at each of the clinic sites for granting permission for the study to be carried out. Finally, we thank the HIV patients at each site who gave their time to take part in the research.
Author contributions. CDP is the principal investigator (PI) on this project
and wrote the first draft of the manuscript with the assistance of ML, who conducted the statistical analyses, and all other authors, who wrote sections of the manuscripts and commented on the entire manuscript. NKM is the co-PI on the project and also oversaw the collection of the data with CK and SN.
Funding. None.
Conflicts of interest. None.
1. Joint United Nations Programme on HIV and AIDS (UNAIDS). Prevention Gap Report. Geneva: UNAIDS, 2014. https://www.unaids.org/en/resources/campaigns/2014/2014gapreport/gapreport (accessed 26 August 2019).
2. Human Sciences Research Council. The Fifth South African National HIV Prevalence, Incidence, Behaviour and Communication Survey, 2017: Preliminary Results. Pretoria: HSRC, 2018. http://www. hsrc.ac.za/uploads/pageContent/9234/SABSSMV_Impact_Assessment_Summary_ZA_ADS_cleared_ PDFA4.pdf (accessed 26 August 2019).
3. Johnson LF. Access to antiretroviral treatment in South Africa, 2004 - 2011. South Afr J HIV Med 2012;13(1):22-27.
4. South African National AIDS Council. South Africa’s National Strategic Plan for HIV, TB and STIs 2017 - 2022. Pretoria: SANAC, 2017. https://sanac.org.za//wp-content/uploads/2017/06/NSP_FullDocument_ FINAL.pdf (accessed 26 August 2019).
5. Reniers G, Blom S, Calvert C, et al. Trends in the burden of HIV mortality after roll-out of antiretroviral therapy in KwaZulu-Natal, South Africa: An observational community cohort study. Lancet HIV 2016;4(3):e113-e121. https://doi.org/10.1016/S2352-3018(16)30225-9
6. Dorrington RE, Bradshaw D, Laubscher R, Nannan N. Rapid Mortality Surveillance Report 2015. Cape Town: South African Medical Research Council, 2016. http://www.mrc.ac.za/sites/default/files/ files/2017-02-06/RapidMortalitySurveillanceReport2015.pdf (accessed 26 August 2019).
7. Schneider M, Neuman M, Chersich M, Parry C. Alcohol and antiretroviral therapy – a lethal cocktail. J AIDS Clin Res 2012;S1:005. https://doi.org/10.4172/2155-6113.S1-005
8. Langebeek N, Gisolf EH, Reiss P, et al. Predictors and correlates of adherence to combination antiretroviral therapy (ART) for chronic HIV infection: A meta-analysis. BMC Med 2014;12:142. https:// doi.org/10.1186/s12916-014-0142-1
9. Hendershot CS, Stoner SA, Pantalone DW, Simoni JM. Alcohol use and antiretroviral adherence: Review and meta-analysis. J Acquir Immune Defic Syndr 2009;52(2):180-202. https://doi.org/10.1097/ QAI.0b013e3181b18b6e
10. Baum MK, Rafie C, Lai S, et al. Alcohol use accelerates HIV disease progression. AIDS Res Hum Retroviruses 2010;26(5):511-518. https://doi.org/10.1089/aid.2009.0211
11. World Health Organization. Global Status Report on Alcohol and Health. Luxembourg: WHO Press, 2014. https://apps.who.int/iris/bitstream/handle/10665/112736/9789240692763_eng.pdf?sequence=1 (accessed 26 August 2019).
12. Coung PV, Casswell S, Parker K, et al. Cross country comparison of proportion of alcohol consumed in harmful drinking occasions using the International Alcohol Control (IAC) study. Drug Alcohol Rev 2018;37(S2):S45-S52. https://doi.org/10.1111/dar.12665
13. Parry CDH, Kekwaletswe C, Shuper PA, Nkosi S, Myers BJ, Morojele NK. Heavy alcohol use in patients on highly active antiretroviral therapy: What responses are needed? S Afr Med J 2016;106(6):567-568. https://doi.org/10.7196/SAMJ.2016.v106i6.10639
14. Babor TF, Higgins-Biddle JC, Saunders JB, Monteiro MG. The Alcohol Use Disorders Identification Test: Guidelines for Use in Primary Care. Geneva: World Health Organization, Department of Mental Health and Substance Abuse Dependence, 2001. http://whqlibdoc.who.int/hq/2001/WHO_MSD_ MSB_01.6a. pdf (accessed 6 May 2016).
15. Kekwaletswe CT, Morojele NK. Alcohol use, antiretroviral therapy adherence, and preferences regarding an alcohol-focused adherence intervention in patients with human immunodeficiency virus. Patient Prefer Adherence 2014;8:401-413. https://doi.org/10.2147/PPA.S55547
16. Kader R, Seedat S, Govender R, Parry CD. Hazardous and harmful use of alcohol and/or other drugs and health status among South African patients attending HIV clinics. AIDS Behav 2014;18(3):525-534. https://doi.org/10.1007/s10461-013-0587-9
17. Braithwaite RS, Conigliaro J, Roberts MS, et al. Estimating the impact of alcohol consumption on survival for HIV+ individuals. AIDS Care 2007;19(4):459-466. https://doi.org/10.1080/09540120601095734 18. Miguez-Burbano MJ, Lewis JE, Fishman J, Asthana D, Malow RM. The influence of different types of
alcoholic beverages on disrupting highly active antiretroviral treatment (HAART) outcome. Alcohol Alcohol 2009;44(4):366-371. https://doi.org/10.1093/alcalc/agp024
19. Barai N, Monroe A, Lesko C, et al. The association between changes in alcohol use and changes in antiretroviral therapy adherence and viral suppression among women living with HIV. AIDS Behav 2017;21(7):1836-1845. https://doi.org/10.1007/s10461-016-1580-x
20. Parry, CDH, Morojele NK, Myers BJ, et al. Efficacy of an alcohol-focused intervention for improving adherence to antiretroviral therapy (ART) and HIV treatment outcomes – a randomised controlled trial protocol. BMC Infect Dis 2014;14:500. https://doi.org/10.1186/1471-2334-14-500
21. Bush K, Kivlahan DR, McDonell MB, Fihn SD, Bradley KA. The AUDIT alcohol consumption questions (AUDIT-C): An effective brief screening test for problem drinking. Arch Intern Med 1998;158(16):1789-1795. https://doi.org/10.1001/archinte.158.16.1789
22. Karnofsky DA Burchenal JH. The clinical evaluation of chemotherapeutic agents in cancer. In: MacLeod CM, ed. Evaluation of Chemotherapeutic Agents. New York: Columbia University Press, 1949:191-205. 23. Mor V, Laliberte L, Morris JN, Wiemann M. The Karnofsky Performance Status Scale: An examination
of its reliability and validity in a research setting. Cancer 1984:53(9):2002-2007. https://doi. org/10.1002/1097-0142(19840501)53:9<2002::AID-CNCR2820530933>3.0.CO;2-W
24. Giordano TP, Guzman D, Clark R, Charlebois ED, Bangsberg DR. Measuring adherence to antiretroviral therapy in a diverse population using a visual analogue scale. HIV Clin Trials 2004;5(2):74-79. https://doi. org/10.1310/JFXH-G3X2-EYM6-D6UG
25. Parry CDH, Trangenstein P, Lombard C, Jernigan D, Morojele N. Screening for alcohol problems among adults in South Africa: Findings from the International Alcohol Control Study. Int J Ment Health Addict 2019;17(1):56-72. https://doi.org/10.1007/s11469-017-9865-5
26. Neuman M, Schneider M, Nanau R, Parry CDH. HIV-antiretroviral therapy induced liver, gastrointestinal and pancreatic injury. Int J Hepatol 2012; article ID 760706. https://doi.org/10.1155/2012/760706 27. Peltzer K, Davids A, Njuho P. Alcohol use and problem drinking in South Africa: Findings from a
national population-based survey. Afr J Psychiatry 2011;14(1):30-37.
28. Van Walbeek, C, Daly M. Alcohol Advertising in South Africa: A Trend and Comparative Analysis. Cape Town: School of Economics, University of Cape Town, 2012.
29. Parry CDH, Harker Burnhams N, London L. A total ban on alcohol advertising: Presenting the public health case. S Afr Med J 2012;102(7):602-604.
30. Short R, Magni S, Adonis K, Mpanza K, Mamabolo K, Michalow J. Evaluating the Economic, Health and Social Impacts of the Proposed Liquor Amendment Bill, 2017. Pretoria: Genesis Analytics, 2017. 31. Euromonitor International. Beer in South Africa: Executive Summary. May 2017. http://www.
euromonitorcom/beer-in-South-Africa/report (accessed 28 April 2018).
32. Russell C, van Walbeek C. How does a change in the excise tax on beer impact beer retail prices in South Africa. SALDRU Working Paper No. 162. Cape Town: South African Development and Labour Research Unit, 2016. http://opensaldru.uct.ac.za/bitstream/handle/11090/810/2016_162_Saldruwp. pdf?sequence=1 (accessed 28 April 2018).
33. Pechey R, Couturier D-L, Hollands GJ, Mantzari E, Munafo MR, Marteau TM. Does wine glass size influence sales for on-site consumption? A multiple treatment reversal design. BMC Public Health 2016;16:390. https://doi.org/10.1186_s12889-016-3068-z
34. McLoughlin JA, Little F, Mazok C, Parry C, London L. Prevalence of and associations with papsak wine consumption among farm workers in the Western Cape province, South Africa. J Stud Alcohol Drugs 2013;74(6):879-888. https://doi.org/10.15288/jsad.2013.74.879