JIEM, 2020 – 13(2): 321-331 – Online ISSN: 2013-0953 – Print ISSN: 2013-8423 https://doi.org/10.3926/jiem.3047
Method Engineering to Increase Labor Productivity and
Eliminate Downtime
Mildrend Montoya-Reyes1 , Alvaro González-Angeles1 , Ismael Mendoza-Muñoz1 , Margarita Gil-Samaniego-Ramos1 , Juan Ling-López2
1Facultad de Ingeniería, Universidad Autónoma de Baja California (Mexico) 2Universidad Politécnica, Baja California (Mexico)
[email protected], [email protected], [email protected],
[email protected], [email protected]
Received: October 2019
Accepted: April 2020
Abstract:
Purpose: The purpose of this work is to present a method based on the application of method engineering, in order to eliminate downtime and improve the manufacturing cell.
Design/methodology/approach: The research strategy employed was a case study applied to a manufacturing company to explore the causes of excessive dead time and low productivity. The methodology used was divided in five steps. The first corresponds to the analysis of the lathe and grinding process; the second is the elaboration of the man-machine diagram to identify dead times; the third is the application of the improvement proposal; the fourth is the redistribution of the cell to optimize the process; the fifth is to conclude from the results obtained.
Findings: With the proposed method, the downtime was reduced by 41% and only 50% of the available labor is required, therefore, it is concluded that the method can be used to redesign manufacturing cells.
Research limitations/implications: This research was limited to analyzing and improving human-machine interaction, since work is not just the human-machine, or the individual alone, or the individual manipulating the machine, therefore, no other tools were used to improve the time of machines operation.
Practical implications: Designing a manufacturing cell that allows the operator to do his job with less fatigue and not adapt the operator to the job, as commonly happens.
Social implications: Companies must show a greater interest in occupational health by including human capital in their optimization plans to avoid future harm to workers.
Originality/value: The key contribution of this paper focused on developing a novel and practical methodology to design or re-design manufacturing cells to improve productivity considering the human factor, inspired by the main concepts of method engineering.
Keywords:ethical climate, ethical work climate, late payments, payment discipline
To cite this article:
1. Introduction
Methods Engineering provides a competitive position to the industry, through the application of time and movement studies to simplify and establish standard times that allow to optimize resources, reduce costs and increase productivity, for this, work centers must be continuously analyzed in order to find a better way to manufacture the product.
The design of the method to perform an operation when a new product is being put into production, or the improvement of a method that is already in force, is a very important part of the study of times and movements(Al-Saleh, 2011), its original use that combines the work of Taylor and Gilbreths refers to a method to improve efficiency and establish employee productivity standards in which a task is divided into steps, the sequence of movements that the subject performs to achieve these steps they are observed to detect redundant movements and the precise time taken for each movement is measured (Liang, Ilchenko, Eliyahu & Dale, 2015).
It is important to use the data generated within the manufacturing process to improve the process and ensure resource efficiency (Schuh, Reuter & Hauptvogel, 2015). Several techniques, methods or tools can be applied to improve production results (Jozsef
&
Blaga, 2014). The process diagram is a device for recording a process in a compact manner, to better understand and improve it. The diagram graphically depicts the separate steps or events that occur during a series of actions (Barnes, 1980). The elimination of unnecessary work and the design of methods and procedures are the most important objectives of the study of movement and time (Shikdar&
Das, 2003).Data collected through traditional stopwatch methods have been useful for measuring the time consumption of different work tasks and estimating productivity (Contreras, Freitas, Ribeiro, Stringer & Clark, 2017). The man-machine diagram shows a graphic representation of the sequence of elements that make up the operations in which men and machines intervene, allows to know the time taken by each one. Based on this knowledge, the efficiency of men and machines can be determined in order to make the most of both factors.
The manufacturing cycle time includes the operating time, the loading / unloading time, the configuration time and the downtime of the machine. The sum of loading / unloading times, configuration and machine idleness is called downtime. To shorten the batch processing time, downtime should be reduced as a priority (Han, Lee & Choi, 2013).
The proper arrangement of machinery in a manufacturing environment can have a positive impact on the productivity of a company (Nyemba & Mbohwa, 2017), (Saptari, Lai & Salleh, 2012). The efficient use of labor is also essential to keep a manufacturing company competitive due to the rapid increase in labor costs (Han et al., 2013).
There are some works in the literature where they present a conceptual framework that illustrates the basic principles to reduce production times and identifies the factors that influence it (Johnson, 2003). For their part, Han et al. (2013) studied the reduction of cycle time for batch production, finding that the efficient use of labor is essential to keep manufacturing companies competitive, so in many companies medium and small a worker can simultaneously operate several machines. Bălteanu and Bâldea (2017), in their study Improving an assembly flow for a specific component, reduced production times using the Kaizen method and introducing a more ergonomic arrangement to workstations.
The objective of this study was to reduce the downtime of the manufacturing cell composed of lathe and grinding to increase labor productivity and optimize the cell through the application of engineering methods.
2. Materials and Methods
For the development of the project, the main stages of a method engineering program were used as a basis as a process improvement model (Gómez, Raúl & Pimiento, 2012), shown in Figure 2.
Figure 1. Basic approaches to operations analysis (Niebel & Freivalds, 2014)
Figure 2. Program of Method Engineering (Niebel & Freivalds, 2014)
To obtain and present the data, a time study with chronometer was performed and the operation diagram was used to identify the operations and the times in seconds that are required (Magu, Khanna & Seetharaman, 2015; Cuatrecasas-Arbos, Fortuny-Santos
&
Vintro-Sanchez, 2011). The dead times were identified with the man-machine diagram, with the analysis of this diagram a proposed method was developed with a new distribution of the manufacturing cell (Johnson 2003; Puvanasvaran, Mei & Alagendran, 2013; Ismail, Ghani, Ab Rahman, Deros & Haron, 2014), the standard time was calculated and finally, the partial productivity of the workforce was determined (León, Castillo & Molano, 2015).3. Results
Figure 3. Turbocharger shaft
The manufacturing cell has an anti-fatigue mat and material handling is carried out by means of trays, at the end of the turbocharger shaft grinding operation it is placed in baskets.
For this operation, a lathe and a grinding machine are used for each machine with a measuring station and an operator. The operator should focus on loading and unloading, change the tool when it has reached its useful life, adjust the machining variables when necessary, clean the parts that have burrs and fill in the corresponding documentation, such as changes in the tool, verification of configuration and the rejection report.
The rest of the shaft body is machined on the lathe. When the piece finishes machining and measuring, it goes to the grinding operation. There it is verified that the axis has the specific diameters, so this measuring station is the most complete and critical in the turbocharger manufacturing process.
The working conditions of the manufacturing cell are: fresh environment, good lighting and even more lighting in the measurement areas.
The operators use earplugs and gloves, they have visual aids to approve or reject a piece. They also are provided with mouth covers, (but most do not use them), wear footwear with a metallic cap for added protection and for each operation they have a plan with the measures of the pieces that are critical to the process and critical to the customer of each operation.
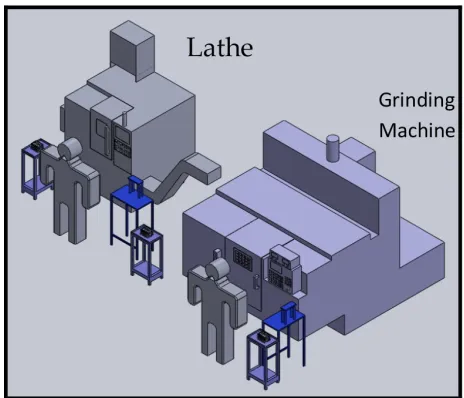
A linear distribution is used for the lathe and grinding machines, both of them have a small measuring table and one operator per machine, as shown in Figure 4.
Figure 4. Linear distribution of the lathe process and grinding process
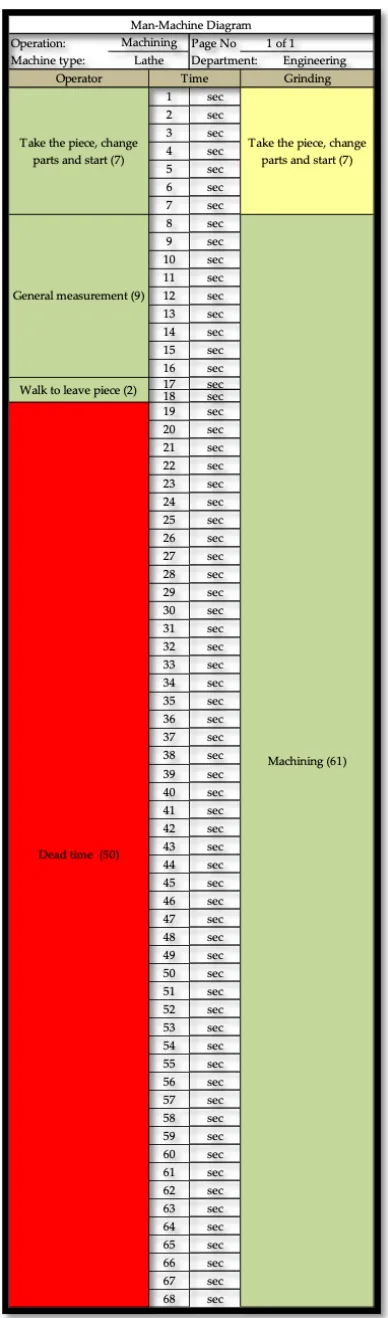
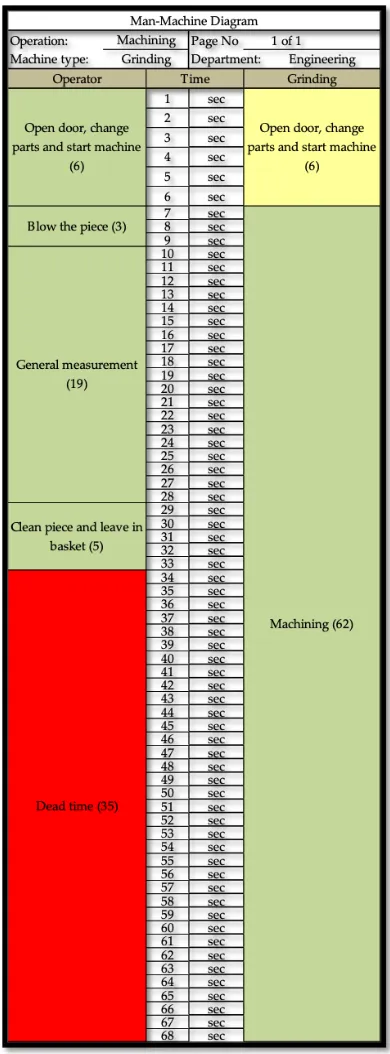
The man-machine diagram of the lathe process (
T
able 1) and the grinding process (T
able 2) was prepared, where you can see the operations performed in each process, as well as the total time.Table 2. Man-machine diagram of grinding process
Lathe Grinding
Operation 18 sec. 33 sec.
Operatordead time 50 sec. 35 sec.
Total time 68 sec. 68 sec.
% Operator downtime 74% 51%
It was proposed to redistribute the work center in a cell in L, to shorten distances and that only one operator is responsible for both processes, as shown in Figure 5.
Figure 5. Distribution of the Cell in L
Redistribution was carried out at the workstations; the new work instructions were explained to the operator and the man-machine diagram of a single operator was developed using the lathe and grinding machine as shown in Table 4.
According to the new proposal, the cycle time continues in 68 seconds, that is, in the same time both processes are applied to an axis, but only with an operator and there is an operator dead time of 15 seconds. For the calculation of the standard time, the Westinghouse system was used, which considers four evaluation factors: ability, effort, conditions and consistency, a performance factor of 1.1 was determined, multiplied by the average time of 68 seconds, obtaining a normal time of 74.8 sec. this value is multiplied by the 22% supplement and a standard time of 90 seconds was obtained.
The partial measure of productivity with respect to manpower was calculated, see formula 1. Formula 2 shows the productivity of the previous process and formula 3 shows productivity with a single operator.
Formula 1. Partial productivity of manpower.
Partial productivity of manpower= Q u a l i t y o f p r o d u c t s
(
N u m b e r o f w o r k e r s x H o u r s e m p l o y e d)
Calculation of the partial productivity of the workforce with two operators.
Partial productivity of manpower=1280 pieces per day
(8 operators x 8 hours)=20%
Calculation of the partial productivity of the workforce with one operator.
Partial productivity of manpower=1280 pieces per day
(4 operators x 8 hours)=40%
Table 4. Man-machine diagram of the lathe process and grinding process
4. Conclusions
Applying method engineering appropriately results in the ability to produce more with less, more jobs for more people for a greater number of hours per year and can increase the number of manufacturers of goods and services, while increasing the potential of purchase of all consumers.
The idea that there is always a better way needs to be continually encouraged in the development of new methods that improve productivity, quality, delivery, job safety and worker well-being.
Being able to determine standard times is an essential tool to achieve productivity, as well as analyzing work methods to eliminate activities that do not add value to reduce standard time by doing better operations and if you also work in a way together in making work adapt to the worker instead of forcing the worker to adapt to the work, avoiding and preventing injuries and damages, notable increases in productivity can be obtained. According to the increase in productivity, the lower the production costs will be and therefore, an increase in the competitiveness of the market will be generated.
The nine basic approaches to the analysis of operations allow a very clear and simple way to understand the current situation of the manufacturing cell without leaving aside relevant information to generate a diagnosis, however, the main stages of the method engineering program, focuses on the search of improvements to optimize processes, together both methodologies strengthen the study of manufacturing cells.
The man-machine diagram shows a graphic representation of the sequence of elements that make up the operations in which men and machines intervene, it allows knowing the time spent by each one; that is, to know the time invested by men and that used by machines. Based on this knowledge, the efficiency of men and machines can be determined in order to take full advantage of both factors.
The diagram is used to study, analyze, and improve a single workstation at a time. In addition, time is essential to carry out the balance of the activities of the man and his machine.
With the man-machine diagram, it was detected that the operators in the lathe and grinding process had a 63% dead time. When making the proposal to use a distribution of the cell in “L” and that only one operator would be in charge of both processes, it allowed a reduction of the dead time of 41% and an increase of the partial productivity of the workforce of 20% now only one operator is required per manufacturing cell, reducing the payroll by 50%. It should be noted that there were no layoffs; workers were reassigned to other work areas.
However, there is still a dead time of 15 sec. of the operator, for this it is important to follow up the analysis of operations to continue improving the processes, operation times and distributions of the work area, fundamental factors that contribute to the productivity of a company. Since operators work standing up, it is recommended to use 15/16 '' anti-fatigue mats not only in front of each machine but in each production cell, as well as placing a leg rest on the measuring table, to form a 90° angle by bending the knee, and looking for alternatives to rotate shifts, so that the operator does not have to stand up 12 hours for long periods of time. To improve the noise level, it is important to have a program for extractor ignition and duration, as well as to maintain it so that it does not generate more noise.
4.1. Recommendation for Future Scope
Evaluate the production cells with an ergonomic approach, through anthropometric measurements and the calculation of percentiles to determine the areas of opportunity, regarding their design and that favor the occupational health of the operator.
Acknowledgements
Authors are greatly grateful to the Universidad Autónoma de Baja California for facilitating access and use of their facilities and equipment to carry out this research.
Declaration of Conflicting Interests
Funding
The authors received no financial support for the research, authorship, and/or publication of this article.
References
Al-Saleh, K.S. (2011). Productivity Improvement of a Motor Vehicle Inspection Station Using Motion and Time Study Techniques. Journal of King Saud University - Engineering Sciences, 23(1), 33-41.
https://doi.org/10.1016/j.jksues.2010.01.001
Bălteanu, A., & Bâldea, M. (2017). Improvement for an assembly flow for a given. Fiability& Durability / FiabilitatesiDurabilitate, 1, 178-184.
Barnes, R.M.. (1980). Motion and Time Study: Design and Measurement of Work (7th ed.). Wiley.
https://www.wiley.com/en-us/Motion+and+Time+Study%3A+Design+and+Measurement+of+Work%2C+7th+Edition-p-9780471059059
Contreras, M., Freitas, R., Ribeiro, L., Stringer, J., & Clark, C. (2017). Multi-Camera Surveillance Systems for Time and Motion Studies of Timber Harvesting Equipment. Computers and Electronics in Agriculture, 135, 208-215. https://doi.org/10.1016/j.compag.2017.02.005
Cuatrecasas-Arbos, L., Fortuny-Santos, J., & Vintro-Sanchez, C. (2011). The Operations-Time Chart: A Graphical Tool to Evaluate the Performance of Production Systems - From Batch-and-Queue to Lean Manufacturing. Computers and Industrial Engineering, 61(3), 663-675. https://doi.org/10.1016/j.cie.2011.04.022
Gómez, L.S., Raúl, N., & Pimiento, O. (2012). En El Rediseño. Estudios Gerenciales, 28(125), 13-22.
https://doi.org/10.1016/S0123-5923(12)70003-7
Han, K.H., Lee, G., & Choi, S.H. (2013). Manufacturing Cycle Time Reduction for Batch Production in a Shared Worker Environment. International Journal of Production Research, 51(1), 1-8.
https://doi.org/10.1080/00207543.2011.631604
Ismail, A., Ghani, J.A., Ab Rahman, M.N., Deros, B.M., & Haron, C.H.C. (2014). Application of Lean Six Sigma Tools for Cycle Time Reduction in Manufacturing: Case Study in Biopharmaceutical Industry. Arabian Journal for Science and Engineering, 39(2), 1449-1463. https://doi.org/10.1007/s13369-013-0678-y
Johnson, D.J. (2003). A Framework for Reducing Manufacturing Throughput Time. Journal of Manufacturing Systems, 22(4), 283-298. https://doi.org/10.1016/S0278-6125(03)80009-2
Jozsef, B., & Blaga, P. (2014). Production Quality Control in the Process of Coating in an Electrostatic Field. Procedia Technology, 12, 476-482. https://doi.org/10.1016/j.protcy.2013.12.517
León, G.E.G., Castillo, D.C.M., & Molano, M.C.S. (2015). Medición Del Trabajo de Una Línea de Producción de Yogurt - Empresa La Hacienda Productos Alimenticios. I3+, 2(2), 62-81. https://doi.org/10.24267/23462329.112
Liang, W., Ilchenko, V.S., Eliyahu, D., & Dale, E. (2015). External Cavity Semiconductor Laser Optimized for Frequency Metrology. Conference on Lasers and Electro-Optics Europe - Technical Digest 2015-Augus (614), 292-299. https://doi.org/10.1364/CLEO_AT.2015.ATh1K.6
Magu, P., Khanna, K., & Seetharaman, P. (2015). Path Process Chart – A Technique for Conducting Time and Motion Study. Procedia Manufacturing, 3(Ahfe), 6475-6482. https://doi.org/10.1016/j.promfg.2015.07.929
Niebel, B.W., & Freivalds, A. (2014). Ingeniería industrial de niebel métodos, estándares y diseño del trabajo (12th ed.). McGraw-Hill. https://www.academia.edu/7731445/Ingeniería_Industrial_12ma_Niebel_y_Freivalds
Nyemba, W.R., & Mbohwa, C. (2017). Process Mapping and Optimization of the Process Flows of a Furniture Manufacturing Company in Zimbabwe Using Machine Distance Matrices. Procedia Manufacturing, 8(October 2016), 447-54. https://doi.org/10.1016/j.promfg.2017.02.057
Saptari, A., Lai, W.S., & Salleh M.R. (2012). Jig Design, Assembly Line Design and Work Station Design and Their Effects to Productivity. Jordan Journal of Mechanical and Industrial Engineering, 66(1), 37-39.
Schuh, G., Reuter, C., & Hauptvogel, A. (2015). Increasing Collaboration Productivity for Sustainable Production Systems. Procedia CIRP, 29, 191-96. https://doi.org/10.1016/j.procir.2015.02.010
Shikdar, A.A., & Das, B. (2003). The Relationship between Worker Satisfaction and Productivity in a Repetitive Industrial Task. Applied Ergonomics, 34(6), 603-610. https://doi.org/10.1016/S0003-6870(03)00057-7
Journal of Industrial Engineering and Management, 2020 (www.jiem.org)
Article’s contents are provided on an Attribution-Non Commercial 4.0 Creative commons International License. Readers are allowed to copy, distribute and communicate article’s contents, provided the author’s and Journal of Industrial Engineering and