2
Heat Engines
INTRODUCTION
If you examined the pressure-volume behavior of a gas (as in Experiment 1), you would have performed one of the thermodynamic processes involved in the cycle found in the operation of a heat engine. This process is known as an isothermal expansion – so named because the data were collected slowly enough that the temperature of the gas in the system remained constant.
In this experiment, you will examine some thermodynamic processes to understand how the internal energy of the system (Eint or U) is affected by exchanges of energy between the system and the surroundings.
OBJECTIVES
In this experiment, you will
Design and create a thermodynamic system consisting of a flask, tubing, syringe, and pressure sensor.
Relate the terms isothermal, isochoric, isobaric and adiabatic to various thermodynamic processes, and how to move your thermodynamic system through these processes.
Collect pressure, volume and temperature data for three of these processes.
Analyze the various P-V processes to keep track of the work (W) done by or on the enclosed gas and the heat (Q) transferred between the gas and the surroundings.
Use the first law of thermodynamics to account for the change in internal energy in each of these processes.
Determine the total work done by enclosed gas in various thermodynamic cyclic processes.
MATERIALS
Vernier data-collection interface 125 mL Erlenmeyer flask Logger Pro or LabQuest App 400 mL beaker
Vernier Gas Pressure Sensor supply of hot and cold water Vernier Stainless Steel Temperature Probe
PRE-LAB INVESTIGATION
Find, in your physics text or an on-line source, definitions of the terms isothermal, isochoric, isobaric and adiabatic as they relate to ideal gases and heat engines. On the axes below, sketch the line or curve connecting the initial state (P1,V1) and the final state (P2 ,V2) for each of these
processes. For three of these processes, make
Evaluation
V2 > V1.In which of these processes does the enclosed gas do no work on the surroundings? Explain.
PART 1 DETERMINE THE VOLUME OF THE SYSTEM
PROCEDURE
1. Connect the Gas Pressure Sensor to the interface and start the data-collection program. Rather than Time-based mode, you will collect data in Events with Entry mode in this experiment. Change the data-collection mode and enter volume as the Column Name and
mL as the Units.
2. Insert the stopper that comes with the gas pressure sensor into the flask; use the tubing to connect it to the sensor. Set the syringe volume to zero and attach it to the other connector on the stopper (see Figure 1).
3. Start data collection. Click or tap Keep and enter 0 as the volume.
4. Repeat Step 3, increasing the volume 2–3 mL each time, until you are close to a volume of 20 mL. Stop data collection, and then store this run.
EVALUATION OF DATA
Clearly the volume of the gas in the system is much greater than the syringe readings you recorded. The following steps will enable you to determine the actual volume. Before you begin this analysis, estimate the volume of gas in the system when the syringe reading was zero.
1. From your knowledge of Boyle’s Law, recognize that the product of pressure and the volume is a constant (PV=A). It follows that a plot of V vs. 1/P should be linear. Test this by making a new calculated column for the inverse of pressure.
2. Change what is plotted on the graph so that you have a graph of volume vs. 1/pressure. Apply a linear fit to these data.
3. The actual volume of the gas, V, is the sum of the syringe reading, v, and the gas in the flask and tubing, B. With this in mind, rearrange the equation for the linear fit to determine the
PART 2 INVESTIGATING THERMODYNAMIC CYCLES
In a thermodynamic cycle, the final values of pressure, volume and temperature are the same as those in the beginning (Pf = Pi , Vf = Vi, Tf = Ti ). It is important, as you perform the processes
in the cycles described below, that you identify each of the processes and reflect on how the internal energy (Eint or U) of the system changes due to heating or cooling (Q) or by the work done by or on the gas in the system (W).
PROCEDURE
A four–process cycle
1. Connect the Temperature Probe to the interface and choose New from the File menu. As before, change the data-collection mode to Events with Entry. Enter Volume as the Name and mL as the Units.
2. Set the syringe volume to zero and connect it to the stoppered flask. Place the flask in the 400 mL beaker as shown in Figure 2.
3. Begin data collection. Click or tap Keep and, in the volume field, enter the value you determined in Part 1 for the system volume.
4. Add hot water (60–75°C) to the beaker until the flask is immersed as much as possible. Friction between the seal on the plunger and the wall of the syringe will keep the gas from expanding. When the temperature and pressure readings are reasonably stable, click or tap Keep and enter the same volume as you did in Step 3.
5. As quickly as you can, perform the isothermal expansion you did in Part 1, keeping the volume readings. If the temperature drops more than a couple of degrees before your final volume reading, you should stop the run, cool the flask back to room temperature, and repeat Steps 2–5.
6. Cool the flask to your starting temperature without changing the volume. When the temperature and pressure readings are stable, select Keep, and enter the system volume.
7. Now, perform an isothermal compression of the gas in a series of 2–3 mL steps, this time decreasing the syringe volume and keeping the readings as you enter the volumes. What should be the reading on the pressure sensor when the syringe volume returns to zero? Stop data collection.
8. If you are using Logger Pro, choose Text Annotation from the Insert menu to label each of the four processes in your thermodynamic cycle. If you are using LabQuest App, either print your graph and label the processes by hand, or import your data into Logger Pro to label them. Save your file.
A three–process cycle
Consider how you might get back to the original values of P and V after performing the first two processes of the previous cycle.
1. Choose New from the File menu. Repeat Steps 2–5 from the previous process.
2. Make the necessary adjustments to the experimental conditions to reach the initial values of pressure and volume. When these values have been reached, stop collecting data. Consider the energy transfers between system and surroundings via Q and W during this last process in the cycle.
3. If you are using Logger Pro, choose Text Annotation from the Insert menu to label each of the three processes in your thermodynamic cycle. If you are using LabQuest App, either print your graph and label the processes by hand, or import your data into Logger Pro to label them. Save your experiment file.
EVALUATION OF DATA
A four–process cycle
1. Open your data file for the 4–process cycle. Label each of the processes in the cycle and determine the signs of Q, W and Eint. For this experiment use the convention that a positive value of Q or Wincreases the internal energy of the system. Record your answers in a table like the one below.
Step Process Q W Eint
1
2
3
4
2. What does the area under the PV curve in the isothermal processes represent? Explain why the sign of this quantity is different in these two processes.
3. Explain how the internal energy of the system remains constant during the isothermal processes.
4. Choose Integral from the Analyze menu to determine the net work done by the system during the cycle. Convert the volume from mL to m3 in order to obtain the value in joules.
A three–process cycle
1. Open your data file for the 3-process cycle. Label each of the processes in the cycle and determine the signs of Q, W and Eint. For this experiment use the convention that a positive value of Q or Wincreases the internal energy of the system. Record your answers in a table like the one below.
Step Process Q W Eint
3. Choose Integral from the Analyze menu to determine the net work done by the system during the cycle. As before, convert your value to joules.
EXTENSIONS
1. Suppose that you performed the following cycle: 1–isothermal expansion at room temperature, 2–isochoric heating, 3–isothermal compression at higher temperature, 4–isochoric return to room temperature. How would the net work done by the gas in the system compare to that in the first cycle?
2. Using your text or a web-based resource, describe how a Carnot cycle differs from the 4-step cycle you performed. Use a table like the ones above to keep track of the signs of Q, W, and
Eint in each of the steps.
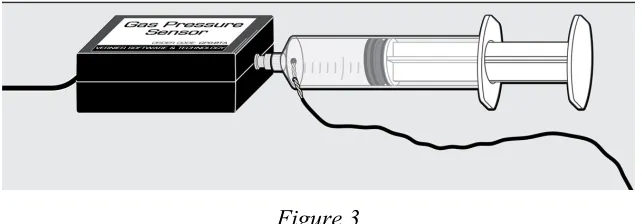
3. If you have the opportunity to experiment with a syringe that has been modified as shown in Figure 3, observe the effect that a rapid expansion or compression has on the temperature of the gas in the syringe. Note that a surface temperature sensor has been inserted through a small hole drilled in the body of the syringe. The hole was later sealed with epoxy.
Figure 3
Vernier Lab Safety Instructions Disclaimer
THIS IS AN EVALUATION COPY OF THE VERNIER STUDENT LAB.
This copy does not include:
Essential instructor information including discussions on how to lead students
to a successful activity
Sample data
Important tips for successfully doing these labs Answers to questions and extensions