A study on Friction and Wear Comparative Analysis of Three
PTFE Composite
Prof. Mahesh C. Swami,
Assistant. Professor, M.S.Bidve Engineering College, Latur,Maharashtra,India
Ms. Aarti A. Dyade,
ME Student, M.S.Bidve Engineering College, Latur,Maharashtra,India
I.INTRODUCTION
Polytetrafluroethylene (PTFE) is a synthetic Fluoropolymer of tetrafluoroethylenethat have numerous applications. The best known brand name of PTFE-based formulas isTeflon-byDuPontCo. Who discovered the compound.PTFE is a fluorocarbon solid, as it is a high weight Compound Consisting wholly of carbon and fluorine. PTFE is hydrophobic neither Water nor Water-containing substances wet PTFE, as Fluorocarbons demonstrate mitigated London Due to the high Electronegativity of fluorine. PTFEhas one of the lowest coefficients of friction against anysolid.PTFE is used as a non-stick coating for pans and other Cookware. It is very non-reactive, partly because of the strength of carbon–fluorine bonds and so it is often used in containers and pipework for Reactive and corrosive chemicals. Where used as a Lubricant, PTFE reduces friction, wear and energy Consumption of machinery. It is also commonly used as a graft material in surgical interventions. But the problem is that in industrial applications, owing to its low friction and high wear rate [1]MehmetTuranDemircin [2] have learned the effect of sliding velocity, bearing pressure and temperature on friction and wear using PA66 (Polyamide 66), PA66 + 18% PTFE (Polyamide 66 + 18% Polytetrafluroethylene) and PA66 + 20%GFR + 25% PTFE (Polyamide 66 + 20% glass fiber + 25% Polytetrafluroethylene) journal bearings at room temperature.. The best wear behavior was found at the PA66 + 20% GFR + 25% PTFE journal bearing.Dinghan Xiang [3]haspresented that A new (A) 16 MnNb steel–PTFE containing 60% Another solid lubricant(B) embedded C86300 bronze–PTFE containing 35% Friction and wear experiments were performed Results showed that the composite A exhibited low coefficient of dry friction and long wear life as compared to that of the composite B.ArashGolchin[4].have explained the four PTFE composites were tested using reciprocating the
Tribometer
at
pressure 1 to 8 Mpa and temperature 25to 85oc.PTFE containing bronze filled, carbon filled and pure PTFE are supply lower break away friction and having excellent properties. Deepakbagale [5], have explained the wear rate of plain PTFE, and carbon and bronze filler. The wear rate decreases due to addition of above filler elements.J.R.Vail [6], have explainedthe comparison between expanded PTFE and powder filledABSTRACT :
The present research work is aimed at developing a new material for industrial application. The progress and developments in materials technology have resulted in several new materials. Polytetrafluroethylene (PTFE) is one of them. From literature review it is found that conventional bearing material (Babbitt and bronze) leads to high wear rate as well as high coefficient of friction. Now a day’s pure PTFE (Polytetrafluroethylene) is widely used as bearing material which is self-lubricating and subjects to lower coefficient of friction, but problem with PTFE is that, it subjects to high wear rate, which can be reduced by adding suitable fillers. In this study, the effects of varying load, sliding distance, sliding velocity and filler content in PTFE are experimentally examine using a Pin –on –Disc Tribometer. A comparative analysis of three composites ( PTFE + 30% Carbon , PTFE + 30% bronze and PTFE+30%Glass) is presented showing how properties of PTFE can be improved by addition of filler content. The expected results taking into consideration the large number of factors, friction &wear characteristics and optimum bearing construction can be achieved.PTFE- PEEK composites .He found that expanded PTFEwere better than powder filled PTFE and also constant coefficient of friction
.
II.OBJECTIVE
The objective of this research work is to generate the sustainable bearing materials for that we need to find out the effect of following composite materials on wear rate.
1. To find the effect of 30%Bronze filler in PTFE on wear rate.
2. To find the effect of 30%Carbon filler in PTFE on wear rate.
3. To find the effect of 30%glass filler in PTFE on wear rate.
4. To Study the wear behavior of the selected materials and the effect of various parameters like load, velocity of sliding and sliding distance on wear rate.
III.EXPERIMENTAL SET UP
The test is conducted using a pin on disc Tribometer TR 20LE wear and friction monitor machine. It facilitates study of Friction and wear characteristics in sliding contact underdesired conditions.as shown in fig1.
Fig1: Experimental set up of friction and wear test rig
Specifications
1. Sample pin size: diameter 3mm -12mm, Length25-30mm 2. Sample disc size: diameter 165 X 8mm thick
3. Wear track diameter: 50mm-100mm 4. Disc rotation speed: 200-2000rpm 5. Normal load: 0-200 N
6. Frictional force: 0-200N, least count 0.1N 7. Wear (LVDT): +/-2 mm, least count 1micron
IV.OPERATION PROCEDURE
1. Connect the power input cable to 230V; 50Hz, and 5 Amps supply. Thoroughly clean specimen, remove burs form the circumference using emery paper.
2. Place the specimen pin between the jaws and adjust the height of the pin with respect to the wear disc using height adjustment block.
Controller
Dead weight
Computer
3. Set required track radius by moving the sliding plate graduated scale on base plate.
4. Open the software winducom 2006 by double clicking on the winducom software icon in the comp. 5. Place required weights on loading pan.
6. Set the speed and test duration on controller 7. Press the enter button in the PC window
8. The test stop automatically after the elapse of preset time or count and reading are directly save in the PC.
Above procedure is repeated for various load and sliding distance for test specimen.
Fig2: Specimen with rotating disc
Table I: Position for PTFE composite materials Material Chemical configuration in Wt. %
I 30% Carbon filled PTFE II 30% Bronze filled PTFE III 30% Glass filled PTFE
V.DESIGN OF EXPERIMENT
Design of experiment is used to determine the impact of factors on the response variable. With quantitative factors, which vary on a continuous scale we can obtain information about the variable's behavior even for factor levels that have not been experimentally determined. The Taguchi method is used to improve the quality of products and processes. Improved quality results when a higher level of performance is consistently obtained [7].
TableII: Allocation of level to the variable as applicable to pin on disc machine Levels Low Medium High
Load (kg) 3 4 5 Speed (rpm) 300 300 300 Sliding distance
(mm)
30 40 50
Materials PTFE+ 30% Carbon PTFE+ 30% bronze PTFE+ 30% glass
Table III: Allocation of level to the variable as applicable to virtually Levels Low Medium High Load (kg) (A) 3 4 5 Velocity of sliding (m/s)
(B)
0.94 1.2566 1.570 Specimen
Pin holder
Sliding distance (mm) (C) 30 40 50
Code -1 0 1
VI.RESULT AND DISCUSSION
Fig3: Wear v/s Time
Fig4: Coefficient of friction v/s Time
The above graph shows the material of PTFE containing 30% carbon having low coefficient of friction as compared to PTFE containing 30% Bronze, and 30% glass but the wear is high i.e. 24 .
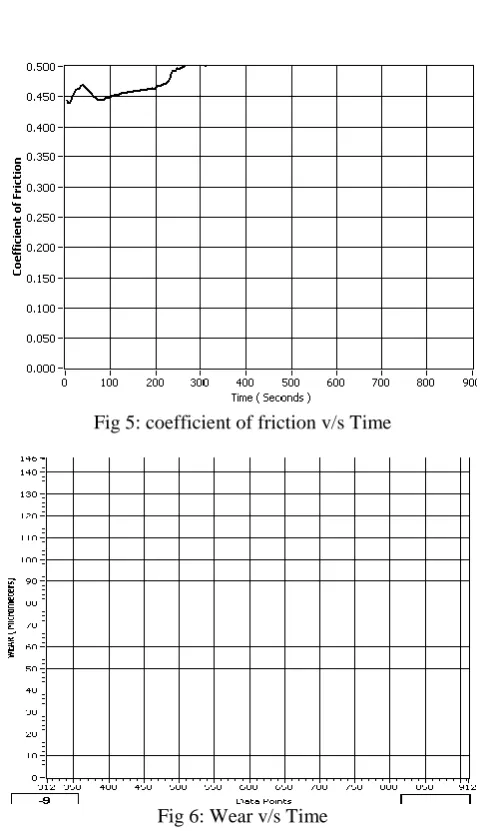
Fig 5: coefficient of friction v/s Time
Fig 6: Wear v/s Time
The above graph shows coefficient of friction increases as shown in fig 5.w.r.t.time but wear is decreased as shown in fig 6.w.r.t.to time of material PTFE containing 30% Bronze under same operating condition but at 50mm sliding distance.
Fig8: Wear v/s Time
The above graph shows the material PTFE containing 30% glass having high wear i.e. 46 as compared to PTFE containing 30% carbon and 30% bronze also coefficient of friction increases and then decreases under similar operating condition. Furtheranalysis will be dousing ‘design expert 9 software’.
VII.CONCLUSION
From experimentation it is found that material I have high coefficient of friction than material II&III.
Material II have low wear than material I&III. And the material III have high wear as compared to material I &II. Due to the addition of filler material in PTFE it is found that wear resistance increases
.
ACKNOWLEDGMENT
The author has greatly thankful totheDr.N.K.Nath and Prof.S.SJamblefor his valuable contribution in developing this research work.
REFERENCES
[1]. S.K.Biswas and KalyaniVijayan, ―Friction and wear of PTFE -a review, Wear 158 (1992) 193-211. [2]. MehmetTuranDemirci, Hayrettin Duzcukoglu- Wear behaviors of Polytetrafluroethylene and glass fiber
reinforced Polyamide 66 journal bearings Materials and Design 57 (2014) 560–567
[3]. DinghanXiang, Kunlun Shan- Friction and wear behavior of self-lubricating and heavily loaded metal– PTFE composites.
[4]. ArashGolchin GregoryF.Simmons, Sergei B.Glavatskih- Break-away friction of PTFE materials in lubricated conditions Tribology International 48 (2012) 54–62.
[5]. DeepakBagale-Wear analysis of PTFE composite under dry conditions using Design-Expert January 2013 vol 3
[6]. J.R.Vail, B.A.Krick, K.R.Marchman, W.Gregory Sawyer-Polytetrafluroethylene fiber reinforced polyetheretherketone (PEEK) composites. Wear 270 (2011)737-741
[7]. 7.S.Basavarajappay and G.Chandramohan, Wear Studies on Metal Matrix Composites: A Taguchi Approach, J. Mater. Sci. Technol. 21 (2005) 845-850.