UNIVERSITÀ DEGLI STUDI DI TRENTO
CIMeC – Center for Mind/Brain Science
Doctoral school in Cognitive and Brain Science
XXIX cycle
Ph.D. dissertation
How input modality and visual
experience affect the representation
of categories in the brain
Stefania Mattioni
“Nothing is in the intellect that was not first in the senses”
“Nella mente non c'è niente che non sia già stato nei sensi”
“Il n'est rien dans notre intelligence qui ne soit passé par nos sens.”
Table of contents
SUMMARY 1
1BACKGROUND 3
1.1 FUNCTIONAL TUNING OF OCCIPITAL REGIONS IN EARLY BLIND PEOPLE 4
1.1.1 CROSSMODAL PLASTICITY IN EARLY BLINDNESS 5
1.1.2 CROSSMODAL PLASTICITY IS NOT A STOCHASTIC PROCESS 7
1.2 WHAT THE “BLIND BRAIN” CAN TELL ABOUT THE CONCEPTUAL-CATEGORICAL SYSTEM 12
1.2.1 CHANGING POINT OF VIEW 13
1.2.2 TERMINOLOGY 13
1.2.3 THE CONCEPTUAL SYSTEM: FROM SENSORY-BASED CATEGORIZATION TO SEMANTIC
KNOWLEDGE 15
1.2.4 HOW CAN BLINDNESS ENLIGHTEN US ABOUT THE NATURE OF THE VENTRAL
OCCIPITO-TEMPORAL CORTEX 24
1.3 THE INTERCONNECTION BETWEEN PLASTICITY IN OCCIPITAL AND TEMPORAL CORTICES OF
EARLY BLIND: THE LARGE-SCALE IMBALANCE THEORY 29
1.3.1 THE BRAIN AS AN INTERCONNECTED SYSTEM 30
1.3.2 INTRA-MODAL PLASTICITY IN THE EXTRA-OCCIPITAL CORTICES OF EARLY BLIND INDIVIDUALS 30
1.3.3 CROSS-MODAL AND INTRA-MODAL PLASTICITY: TWO FACES OF THE SAME COIN? 33 1.4 INVESTIGATE THE BRAIN WITH THE FMRI: FROM THE ORIGINS TO INNOVATIVE
MULTIVARIATE ANALYSES 35
1.4.1 PHYSICAL PRINCIPLES BEHIND MAGNETIC RESONANCE 36
1.4.2 FROM MAGNETIC RESONANCE TO MAGNETIC RESONANCE IMAGING 38
1.4.3 SCANNING THE ACTIVITY OF THE BRAIN: FUNCTIONAL MRI 40
1.4.4 DATA PREPROCESSING 42
1.4.5 GENERAL LINEAR MODEL 45
1.4.6 UNIVARIATE ANALYSES 45
1.4.7 MULTIVARIATE PATTERN ANALYSES (MVPA) 47
1.4.8 USING MULTIVARIATE ANALYSES TO INVESTIGATE AMODAL REGIONS IN THE BRAIN 50
1.5 SUMMARY AND GOAL OF THIS DISSERTATION 55
2 HOW INPUT MODALITY AND VISUAL EXPERIENCE AFFECT THE NEURAL
2.1 ABSTRACT 58
2.2 INTRODUCTION 59
2.3 MATERIAL AND METHODS 62
2.3.1 PARTICIPANTS 62
2.3.2 STIMULI 62
2.3.3 PROCEDURE 63
2.3.4 FMRI DATA ACQUISITION AND ANALYSES 65
2.4 RESULTS 75
2.4.1 BEHAVIOURAL RATINGS RESULTS 75
2.4.2 WHOLE–BRAIN SEARCHLIGHT ANALYSES 75
2.4.3 VOTC REGIONS OF INTEREST (ROIS) 80
2.5 DISCUSSION 84
2.6 CONCLUSION 90
2.7 SUPPLEMENTAL INFORMATION 91
3 THE BALANCED ACT OF CROSSMODAL AND INTRAMODAL PLASTICITY: ENHANCED REPRESENTATION OF AUDITORY CATEGORIES IN THE OCCIPITAL CORTEX OF EARLY BLIND PEOPLE LINKS TO REDUCED TEMPORAL CODING 95
3.1 ABSTRACT 96
3.2 INTRODUCTION 97
3.3 MATERIAL AND METHODS 100
3.3.1 PARTICIPANT 100
3.3.2 STIMULI AND PROCEDURE 100
3.3.3 FMRI DATA ACQUISITION AND ANALYSES 100
3.4 RESULTS 105
3.4.1 MVPA RESULTS 105
3.5 DISCUSSION 109
3.6 CONCLUSION 114
4 GENERAL DISCUSSION 115
4.1 RECALL OF THE GENERAL AIMS OF THE DISSERTATION 116
4.2 THE SEMANTIC NETWORK AND THE NEURAL FORMAT OF THE CONCEPTUAL
REPRESENTATIONS 117
4.2.1 THE ROLE OF PMTG IN THE MULTIMODAL SEMANTIC PROCESSING 117 4.2.2 VOTC INVOLVEMENT IN SEMANTIC CATEGORIZATION IN SIGHTED AND IN BLIND INDIVIDUALS
4.2.3 ARE THERE AMODAL REGIONS IN THE BRAIN? 121
4.3 CROSSMODAL PLASTICITY AND THE WAY IT EXPRESSES IN THE BLIND BRAIN 123
4.3.1 THE INCREASED INVOLVEMENT OF THE EB OCCIPITAL CORTEX IN PROCESSING AUDITORY
CATEGORIES. 123
4.3.2 THE REORGANIZED OCCIPITAL CORTEX IN EB: WHAT IS IT CODING FOR? 125 4.3.3 AN INTEGRATING VIEW OF INTRA-MODAL AND CROSS-MODAL PLASTICITY IN BLINDNESS: THE
LARGE-SCALE UNBALANCE THEORY 128
4.4 DIFFERENT ROLES OF LEFT AND RIGHT HEMISPHERES IN PROCESSING DIFFERENT
CATEGORIES 132
4.5 CONCLUSION AND FUTURE DIRECTIONS 141
Figures and tables
FIGURE 1.1:GLUCOSE METABOLISM AT REST IN SIGHTED AND BLIND INDIVIDUALS. ... 6
FIGURE 1.2:SCHEMATIC REPRESENTATION OF FUNCTIONAL REORGANIZATION FOLLOWING EARLY VISUAL DEPRIVATION. ... 8
FIGURE 1.3:MODELS OF SEVERAL NEURONAL POPULATIONS CHARACTERIZING DIFFERENT BRAIN AREAS. ... 14
FIGURE 1.4:THE CONVERGENCE ZONES AND THE SEMANTIC NETWORK. ... 19
FIGURE1.5:REPRESENTATION OF PROTONS IN THE NUCLEUS OF A HYDROGEN ATOM SEQUENTIALLY EXPOSED TO AN EXTERNAL MAGNETIC FIELD AND TO A RADIOFREQUENCY PULSE. ... 37
FIGURE 1.6:REPRESENTATION OF AN MRI SLICE ACQUISITION PROCEDURE. ... 39
FIGURE 1.7:REPRESENTATION OF THE FIRST ATTEMPT TO REGISTER THE BLOOD FLOW DURING COGNITIVE TASKS, EMPLOYED BY ANGELO MOSSO AT THE END OF 19TH CENTURY. ... 41
FIGURE 1.8:PREPROCESSING PIPELINE OF FMRI DATA ... 42
FIGURE 1.9:REPRESENTATION OF UNIVARIATE AND MULTIVARIATE FMRI DATA ANALYSES. ... 49
FIGURE 1.10:COMPARING REPRESENTATIONAL SPACE BETWEEN SUBJECTS . ... 51
FIGURE 2.1:MATERIAL, METHODS AND ANALYSES. ... 67
FIGURE 2.2:EXTERNAL MODELS FOR RSA. ... 70
FIGURE 2.3:MVPA RESULTS. ... 76
FIGURE 2.4:RSA RESULTS. ... 79
FIGURE 2.5–SI: PREDICTIONS AND RESULTS ABOUT THE REPRESENTATIONAL FORMAT OF DIFFERENT ROIS. ... 92
FIGURE 2.6–SI:MVPA RESULTS IN ROIS USING LDA CLASSIFIER ... 92
FIGURE 2.7–SI:COMPARISON OF THE MEAN PMTG NEURAL DSMS FROM THE 3 GROUPS. ... 93
FIGURE 2.8–SI:RSA RESULTS WITH EXTERNAL MODELS IN SIGHTED CONTROL-VISUAL EXP. ... 94
FIGURE 3.0.1:EXAMPLE OF BRAIN PARCELS USED AS ROIS. ... 102
FIGURE 3.0.2: MVPA AND CORRELATION RESULTS. ... 106
FIGURE 3.0.3: REPRESENTATIONAL SIMILARITY ANALYSIS RESULTS.. ... 107
FIGURE 4.1:SCHEMATIC ILLUSTRATION OF THE OCCIPITAL AND TEMPORAL CORTICES REPRESENTATIONAL FORMAT BASED ON OUR DATA AND ON STUDIES FROM THE PREVIOUS LITERATURE ... 137
TABLE 2.1–SI:CHARACTERISTICS OF EARLY BLIND PARTICIPANTS. ... 91
TABLE 2.2–SI:CATEGORIES AND STIMULI. ... 91
Summary
The general aim of the present dissertation was to participate in the progress of our understanding of how sensory input and sensory experience impact on how the human brain implements categorical knowledge. The goal was twofold: (1) understand whether there are brain regions that encode information about different categories regardless of input modality and sensory experience (study 1); (2) deepen the investigation of the mechanisms that drive cross-modal and intra-modal plasticity following early blindness and the way they express during the processing of different categories presented as real-world sounds (study 2).
To address these fundamental questions, we used fMRI to characterize the brain responses to different conceptual categories presented acoustically in sighted and early blind individuals, and visually in a separate sighted group.
1
1.1
Functional tuning of occipital regions in early
blind peopl
e
“Forty years ago, […] we had no idea of the plasticity of the brain. We thought that every part of the brain was predetermined genetically, and that was that. Now we know that enormous changes of function are possible. The miracle of plasticity and redeployment of the nervous system excites me very much.”
1.1.1
Crossmodal plasticity in early blindness
The quality of being plastic refers to the ability of being molded and changing in shape. In 1904, Cajal for the first time suggested that the brain could be a plastic system (Ramon, Y., & Cajal, S.,1904). About 60 years later, Hubel and Wiesel were the first to compellingly demonstrate it, showing that the development of the visual cortex in kittens can be modified by alterations in visual experience (Wiesel and Hubel, 1963). This was the first of many works about neuroplasticity.
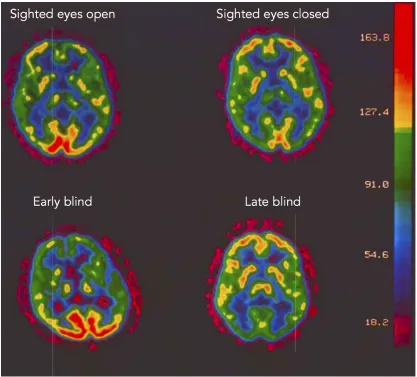
The study of congenitally blind individuals represents one of the most exquisite models to investigate brain plasticity since the visual deprivation leads to dramatic functional and structural reorganization in the brain (Bock and Fine, 2014; Collignon et al., 2012; Kupers and Ptito, 2013; Merabet and Pascual-Leone, 2010). For years the occipital lobe of blind individuals had been thought to be unused since it does not receive any visual input. However, in the 90s, some innovative studies (Veraart et al., 1988, 1990; De Volder et al., 1997) observed a high neural activity in the occipital areas of blind individuals (see figure1.1).
with sound localization accuracy across the entire group of blind subjects (Gougoux et al., 2005).
Figure 1.1: Glucose metabolism at rest in sighted and blind individuals. The mean glucose utilization maps are displayed in a sighted subject with eyes open (top-left); in a sighted subject with eyes closed (top-right); in an early blind subject (bottom-left) and in a late blind subject (bottom-right). Early blind subject show an increased glucose metabolism in the occipital cortex compared to sighted subjects with eyes closed and to late blind subjects. Adapted from Veraart et al. 1990.
neuropsychological perspective, this functional relevance is supported by a single case study of a congenitally blind patient that developed Braille alexia after bilateral occipital stroke (Hamilton et al., 2000). Taken together these results show that in case of early blindness the occipital cortex is able to change its functional profile and to rewire itself toward the processing of inputs from non-visual sensory modalities.
1.1.2
Crossmodal plasticity is not a stochastic
process
As a consequence of the discovery of the occipital involvement in early blind individuals during non-visual tasks, a new question emerged: does the crossmodal reorganization in blindness follow some specific organizational principles?
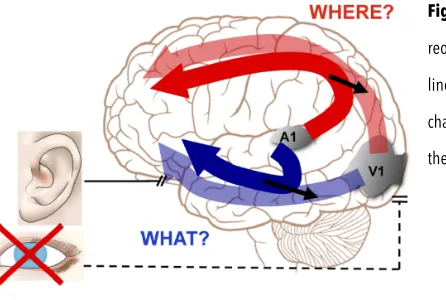
Figure 1.2: Schematic representation of functional reorganization following early visual deprivation. Several lines of evidence suggest that the dual stream structure that characterizes both visual and auditory cortex is preserved in the rewired sensory cortices of blind individuals.
Interestingly, several studies about crossmodal plasticity in blindness showed that the reorganization of these brain regions seems to follow similar principles of functional specificity (see figure 1.2). In other words, even if these regions are rewired toward non-visual processing, they still maintain their selective functional preference (Dormal et al., 2012).
processing in early blind (Collignon et al., 2007, 2009a).
As mentioned before, the ventral pathway is mostly involved in object recognition processing and it is considered as the neural substrate of the visual categorization system. Indeed, several areas have been isolated in the ventral pathway of sighted subjects based on their stronger response to stimuli from a specific category as compared to stimuli from other categories (for a review see Grill-Spector and Weiner, 2014). These clustered areas are selective for specific categories of visual stimuli such as the visual word form areas (VWFA) for written words (McCandliss et al., 2003), the lateral occipital complex (LOC) for manipulable objects and tools (Grill-Spector et al., 1998; Malach et al., 1995), the parahippocampal place area (PPA) for scenes and big objects (Epstein and Kanwisher, 1998), the extrastriate body area (EBA), for body parts (Downing et al., 2001) and the fusiform face area (FFA) for faces (Kanwisher et al., 1997; Tong et al., 2000). Similarly to the dorsal stream, there is evidence of a recruitment of the ventral visual pathway for auditory and tactile stimuli in blind individuals. Also in this case these regions seem to maintain a functional specialization similar to the one observed in sighted.
The recruitment of VWFA in blind subjects has been shown for braille reading words (Bedny, 2017; Reich et al., 2011; Sadato et al., 1998). Moreover, occipital activity has been reported also for embossed letters, excluding the possibility that this effect could be driven by the enhanced skills acquired by blind people in braille reading (Burton et al., 2006; But see Bedny, 2017).
Selective activation of LOC in early blind was reported during tactile exploration of objects (Amedi et al., 2010) during shape imagery task triggered by objects’s sounds (De Volder et al., 2001) and for the processing of object’s shape using visual-to-audition sensory substitution device (SSD, Amedi et al., 2007; Merabet et al., 2008). Moreover, LOC also activates in early blinds in response to auditory words of manipulable objects (Peelen et al., 2013a).
2011b). Striem-amit & Amedi were also able to isolate EBA in the ventral stream of blind individuals for silhouette of body parts using a visual-to-auditory SSD (Striem-Amit and Amedi, 2014).
Going beyond the functional reorganization of the discrete regions, a recent study investigated the macroscopic functional organization of VOTC during categorical processing of auditory and visual stimuli in sighted and in blinds individuals (Hurk et al., 2017). They found that it is possible to predict the global pattern of activity generated by different categories presented visually in sighted using the global pattern of activity generated by the same categories presented acoustically in early blind.
Taken together, these findings suggest that the dual-stream organization might be preserved in the rewired sensory cortices of early blind individuals (Dormal and Collignon, 2011). Hence, the crossmodal plasticity seems to manifest in these regions rewiring them toward non-visual sensory modalities but maintaining the category-selective structure similar to the one existing in sighted individuals for visual processing.
(Bi et al., 2016).
1.2
What the “blind brain” can tell about t
he
conceptual
-
categorical system
“What we do see depends mainly on what we look for. […] In the same field the farmer will notice the crop, the geologists the fossils, botanists the flowers, artists the colouring, sportmen the cover for the game. Though we may all look at the same things, it does not all follow that we should see them.”
– Jhon Lubbock – The beauties of nature and the wonders of the world we live in
1.2.1
Changing point of view
Approximately a decade after the appearance of the first studies describing that the occipital cortex of early blind people reacts to non-visual inputs, some researchers started to look at these data in a wider framework. They realized that the case of early visual deprivation could represent an exquisitely informative model not only to investigate the crossmodal plasticity phenomenon but also to better understand the development of the functional organization of the brain in general. In the light of this new perspective, a new wave of studies on blindness paved the way for important debates about the sensory nature of several brain regions, the format of the conceptual system, and the implementation of semantics in the brain. As we will see below, the study of congenitally blind individuals have provided novel and stimulating insights not only on the cross-modal reorganization that inevitably occurs when vision is absent since birth, but, most importantly on how sensory experience shape the functional development and organization of the brain (Ricciardi et al., 2014).
1.2.2
Terminology
Before entering the core of the debate, it might be useful to have a brief excursus on the different terms that have been employed in the literature related to this topic. As it often happens in long-lasting debates, a rich, and not always coherent, lexicon has been used. In order to avoid the possibility of misunderstandings and lack of clarity it is important as a first step to define the key-terms of the debate and to clarify the meaning that I assigned to them during the entire dissertation.
Unimodal regions. The prefix uni- comes from the latin unus and means
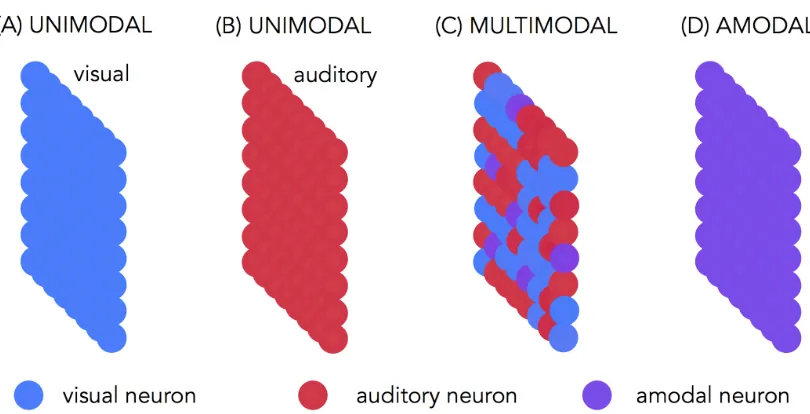
one. These are brain areas that receive and process sensory information from one specific sensory modality (see figure 1.3A and 1.3B).
presence of the “α” privative, a letter that in the ancient Greek was placed in front of a word to reverse its meaning. In this case, where -modal means related to a specific sensory modality, the introduction of the a- transforms this word into its contrary, which is unrelated to any sensory modality. In the second term, the prefix
supra- comes from the Latin super- which means above, in this case above any
sensory modality. Finally, the prefix meta- derives from the Greek “μετα-”, with the meaning of beyond; placed before a word is referring to an abstraction from it, in this case an abstraction from the sensory modalities. In this dissertation, these three words will be used in an interchangeable way referring to brain regions that are abstracted from sensory modalities; in other words to the areas involved in the conceptual analysis of the stimuli regardless of the modality in which the stimuli are presented (see figure 1.3D).
Multimodal regions. With this term, I refer to brain regions that participate to the processing of stimuli from multiple sensory modalities. These areas are not abstracted from the sensory modalities but at the same time they are not exclusively involved in the analysis of stimuli coming from only one modality (see figure 1.3C).
Crossmodal plasticity. This is a phenomenon of adaptive reorganization of a brain region following sensory deprivation. Cross- (from the Latin crux) means passing from one side to the other, in this case from one sensory modality to another. One specific case, as described above, is the reorganization of the occipital cortex of blind individuals: this region typically involved in visual processing starts to respond to non-visual stimulation in visually deprived people. Regions affected by crossmodal plasticity are sensory related areas (either unimodal or multimodal) that rewired themselves to a different modality from the one(s) they normally respond to.
1.2.3
The conceptual system: from sensory-based
categorization to semantic knowledge
“All men by nature desire to know”, wrote Aristotle in the IV century BC, and he also added that knowledge is based on order: he is the first author in the occidental culture introducing the concept of “category” (κατηγορία) as a system to
organize the knowledge. It is indeed undeniable that we have an automatic and spontaneous impulse in categorization. Eleanor Rosch proposes two general principles that underlie categorization system: the first is to provide maximum information with the least cognitive effort and the second is to build a more structured perception of the world (Rosch et al., 1976). To work properly, this system should be able to generalize across exemplars of a category while maintaining specificity to distinguish among exemplars from different categories (Grill-Spector and Weiner, 2014).
These high-level areas are mostly involved in process global shape, rather than local and low-level characteristics of the visual stimuli (Grill-Spector and Weiner, 2014). Moreover, clustered regions inside VOTC show a preference for particular categories of visual objects, such as faces (Kanwisher et al., 1997; Tong et al., 2000), scenes and big objects (Epstein and Kanwisher, 1998), bodies (Downing et al., 2001), written words (McCandliss et al., 2003) and manipulable objects and tools (Grill-Spector et al., 1998; Malach et al., 1995).
Similarly, in the auditory domain the processing starts with the physical analysis of the stimulus such as pitch, frequency and spectral centroid, in the core of the temporal cortex (A1) and becomes gradually more disengaged from the low-level aspects of the sound with the distance from A1, toward the belt and the parabelt regions (Giordano et al., 2013; Peelle et al., 2010), where information about the object categorization, such as human voices (Belin et al., 2004), instrumental sounds (Leaver and Rauschecker, 2010) and objects (Dormal et al., 2017; Lewis et al., 2011a) are processed.
Beyond this sensory related analysis of the stimuli, some regions in the brain might integrate the information into a more general concept. There is an extended literature about how different semantic categories are represented in the brain, however the principal theories can be included in three main groups: the modality-specific theory, the convergence zone(s) theories and the domain-modality-specific theory.
The modality-specific theory
will require the activation of the perceptual and motor system that is usually active when someone performs the action of grasping. As Allport describes in one of the first structured description of the theory: “this model is, of course, in radical opposition to the view, apparently held by many psychologists, that ‘semantic memory’ is represented in some abstract, modality-independent, ‘conceptual’ domain remote from the mechanisms of perception and motor organization”
(Allport, 1985).
(Gallese and Lakoff, 2005; Meteyard et al., 2012). Following this view, two different sensorial representations might underlie a similar conceptual knowledge in blind and sighted people.
The convergence zone(s) theories
A distinct body of research investigating the conceptual system from a different perspective reporting a cortical network that is involved in processing meaningful stimuli from multiple modalities. Based on these data they suggested the presence in the brain of “convergence zones”, a sort of high-level conjunction regions where concepts are processed in a more abstracted fashion (Barsalou et al., 2003; Damasio, 1989). A goal of this theory is to integrate the two lines of evidence as recently remarked by Binder: “the evidence supports a hierarchical model of knowledge representation in which modal systems provide a mechanism for concept acquisition and serve to ground individual concepts in external reality, whereas broadly conjunctive, supramodal representations play an equally important role in concept association and situation knowledge” (Binder, 2016). In the last two decades, a vast number of studies tried to identify and localize these convergence areas in the brain with different results probably due to the large number of tasks, material and analyses implemented (Binder et al., 2009; Hart et al., 2007; Patterson et al., 2007).
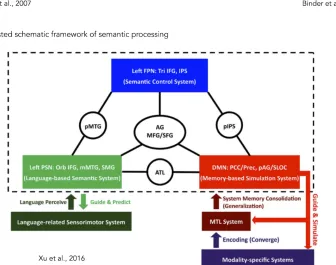
Figure 1.4: The convergence zones and the semantic network. (A) The distributed-plus-hub model. The modality- specific regions are connected between them (green lines) but are also connected to (red lines), and communicate through, a shared, amodal ‘hub’ (red area) in the anterior temporal lobes. At the hub stage associations between different attributes (e.g. shape and name, shape and action, or shape and colour) are all processed by a common set of neurons, regardless of the task. In the right side of the same panel there is the schematic illustration of the same model. Adapted from Patterson et al., 2007. (B) The large-scale semantic network of the human brain emerged from a metanalysis of 120 functional neuroimaging studies on the topic. Adapted from Binder et al., 2009. (C) Neuro-functional model for semantic processing derived from the investigation of its intrinsic functional connectivity pattern (illustrated in the dashed line box) and a broad range of neuropsychological and functional neuroimaging findings. Three stable modules corresponding to the default mode network (red rectangle), the left perisylvian network (green rectangle), and the left fronto-parietal network (blue rectangle) were individuated. The connector hubs bridging these systems are illustrated in circles. Adapted from Xu et al., 2016.
meta-analysis comprising 120 studies related to this topic, only taking into account works employing verbal material and including a comparison task that provided controls for orthographic, phonological, and general cognitive demands to the semantic task (Binder et al., 2009). They were able to isolate a left-lateralized network consisting of seven “nodes”: (1) the inferior parietal cortex (angular gyrus and portions of the supramarginal gyrus); (2) the middle and inferior temporal gyri, extending into the anterior temporal lobe; (3) the ventromedial temporal cortex (fusiform and parahippocampal gyri); (4) the dorsomedial prefrontal cortex (superior frontal gyrus and posterior middle frontal gyrus); (5) the ventromedial prefrontal cortex; (6) the inferior frontal gyrus (mainly pars orbitalis); and (7) the posterior cingulate gyrus (PCC) and precuneus (see figure 1.4B).
modules, the left ATL linked the modules DMN and PSN, the left pIPS connected modules DMN and FPN and the left pMTG resulted as the connector hub of modules PSN and FPN.
2011). Recently Gainotti (2014) extended this proposition from ATL to the whole-brain implementation of the conceptual network in general, promoting the idea that the left hemisphere is more involved in verbal knowledge, whereas the right hemisphere would participate more in non-verbal sensory-motor knowledge (Gainotti, 2014). This hypothesis is based on studies on both brain-damaged and healthy subjects. Several behavioral studies on patients with right or left-brain lesions showed that left brain damages selectively affect the verbal memory code, while right hemisphere injuries preferentially impair the pictorial code (Gainotti et al., 1994; Grossman et al., 2001; Whitehouse, 1981). In line with these results, several neuroimaging studies showed a similar effect also in healthy individuals. Indeed, several studies comparing the categorical processing of verbal material with non-verbal material (visual and/or acoustical) showed the emergence of a left lateralized network when the verbal stimuli were contrasted against the non-verbal stimuli (Humphries et al., 2001; Thierry and Price, 2006; Thierry et al., 2003). Coherently, in the same studies the opposite contrast of non-verbal stimuli versus words preferentially highlighted a right lateralized network (Gainotti, 2014).
Taken together, these evidences speak in favor of a semantic system based on several convergence zones organized in a distributed network. These semantic nodes seem to play different roles according to the modalities with which the information reaches the brain, with a possible major distinction between verbal and non-verbal stimuli represented in the left and right hemispheres, respectively (Gainotti, 2014).
The domain-specific theory
such as living animate (e.g. animals), living inanimate (e.g. plants), humans and tools (Mahon and Caramazza, 2009). Indeed, neuropsychological cases of selective impairment have been reported for multiple input modalities (mostly visual and linguistic) for those categories such as animals (Caramazza and Shelton, 1998), vegetables and fruit (Hart et al., 1985; Samson and Pillon, 2003), conspecifics (e.g. human; Miceli et al., 2000) and non-living items such as objects and tools (Laiacona and Capitani, 2001; Sacchett and Humphreys, 1992).
Mahon & Caramazza specified that “one important aspect of the performance profile of patients with category-specific semantic impairment is that the impairment is to conceptual knowledge and not (only) to modality-specific input or output representations” (Caramazza and Shelton, 1998; Mahon and Caramazza, 2009). This model suggests that the neural substrate of each domain of knowledge comprises a network of regions where the most relevant information for a given category converges, and this integration of information is mediated by an innately determined connectivity pattern (Mahon and Caramazza, 2009). An extreme expression of this theory resulted in the proposition of a metamodal organization of the brain based on metamodal operators, namely local neural networks, defined by a given computation that is applied regardless of the sensory input received (Pascual-Leone and Hamilton, 2001). Based on this hypothesis a new line of studies developed in order to show that some brain regions traditionally considered purely sensory-related might in fact be more abstracted than previously thought. In particular, the Ventral Occipito-Temporal Cortex (VOTC), a region traditionally considered to be organized by semantic categorization within the visual modality only, has been proposed to host more abstract (amodal) representation of domain-specific knowledge (Mahon and Caramazza, 2009).
1.2.4
How can blindness enlighten us about the
nature of the Ventral Occipito-Temporal
Cortex
A set of fMRI studies in healthy individuals demonstrated involvement of VOTC in non-visual, mostly tactile, object processing (Amedi et al., 2002, 2007, 2001; Pietrini et al., 2004; Snow et al., 2014; Zhang, 2004). These studies triggered the idea that VOTC, traditionally considered a purely visual area, could in fact host a more amodal representation of object knowledge than previously thought. More precisely, it was proposed that the lateral occipital cortex might represent object shape in an abstracted format (Amedi et al., 2002, 2007). However, the main critique received by this proposal was the possible implication of mental visual imagery, a process known to elicit occipital activation in sighted individuals in the absence of visual stimulation (Kosslyn et al., 1993; Slotnick et al., 2005). Therefore, it could be possible that the occipital activation reported in sighted individuals was simply the by-product of the visual imagery triggered by the non-visual stimulation. In line with this possibility, De Volder and collaborators (2001) reported reliable and selective activations in bilateral LOC when sighted participants listened to object sounds and were explicitly asked to mentally visualize the shape of the corresponding objects (De Volder et al., 2001).
Most of the above-mentioned studies considered their results as strong evidence that the nature of VOTC is amodal and completely abstracted from sensory inputs. Here some examples:
“These results demonstrate that the representation of objects in the ventral visual pathway is not simply a representation of visual images but, rather, is a representation of more abstract features of object form” (Pietrini et al., 2004)
“[…] These findings establish the PPA/RSC network as critical in modality-independent spatial computations and provide important evidence for a theory of high-level abstract spatial information processing in the human brain” (Wolbers et al., 2011b).
“To the best of our judgment, this provides the strongest support so far for the metamodal theory. Hence, the VWFA should also be referred to as the tactile word form area, or more generally as the (metamodal) word form area (Reich et al., 2011).
“Thus, the EBA preference is present without visual experience and with little exposure to external body-shape information, supporting the view that the brain has a sensory-independent, task-selective supramodal organization rather than a sensory-specific organization” (Striem-Amit and Amedi, 2014).
“This is in accordance with previous results from our team suggesting that there is nothing visual about the VWFA […]. This suggestion is in line with the theories of the metamodal/supramodal organization of the brain” (Abboud et al., 2015).
the large-scale organization of high-order visual cortex may not be primarily shaped by visual input” (He et al., 2013b).
“A great deal of the brain cortical functional architecture appears to be programmed to occur even in the absence of any visual experience and able to process non-visual sensory information, a property that can be defined as supramodality. It is important to emphasize that such supramodal cortical organization is not merely the consequence of the plastic rearrangements – that of course also occur in the brain of individuals deprived of sight and are generally called cross-modal plasticity – but is a characteristic of the (human) brain itself, as it is indeed present also in sighted individuals” (Ricciardi et al., 2014).
These statements, all taken from authoritative paper in the field, suggest that many regions previously considered part of the sensory visual system might be sensory-abstracted instead. Nevertheless, there are several aspects that make this hypothesis still debatable and I will argue that we lack definitive evidences to claim that VOTC, or part of it, is abstracted from the visual modality.
al., 2011; Striem-Amit and Amedi, 2014) did only include a group of early blind performing the task in the non-visual modality without including a sighted control group performing the same task in the same non-visual modality. By showing that EB activated the same VOTC clusters when compared to the sighted performing the same task in the visual modality (e.g. in Reich et al. 2011 activity of VWFA for written words in sighted and braille words in blind), they concluded that these data are in support of a meta-modal organization of VOTC. Nevertheless, the same data can be interpreted in support of a sensory-related nature of VOTC, visual in sighted and rewired toward non-visual modalities in case of early visual deprivation, as we discussed in the previous chapter.
The second controversial point is the evidence that low-level visual features of the stimuli, such as spatial frequency, eccentricity or shape, can explain the category selectivity ability of VOTC (Andrews et al., 2010; Baldassi et al., 2013; Rice et al., 2014). Moreover, a recent study on the monkeys’ newborn visual system reported that the typical hierarchical and topographic organization is present at birth suggesting that it constitutes a proto-organization for the entire primate visual system (Arcaro and Livingstone, 2017). Recently, Bracci et al. (Bracci et al., 2017) proposed the feature-based categorical coding hypothesis according to which regions in the ventral stream do encode information about categories but in a format at least partially based on the visual features of the stimuli. Moreover, lesions to the VOTC are known to produce visual agnosia while preserving the processing of the same material by the other senses or based on linguistic material (Farah, 1991; Miceli et al., 2001; Rossion et al., 2003; Vandenbulcke et al., 2006; Warrington and McCarthy, 1994) supporting the idea that this region has a selective role in visual recognition (Grill-Spector and Weiner, 2014).
distracting visual inputs (Laurienti et al., 2002).
1.3
The
interconnection between plasticity in
occipital and temporal cortices
of early blind:
the large
-
scale imbalance theory
“A system is in equilibrium when the forces constituting it are arranged in such a way as to compensate each other, like the two weights pulling at the arms of a pair of scales.”
1.3.1
The brain as an interconnected system
The British philosopher Alan Watts in one of his works said: “[…] Everything in nature depends on everything else. So it’s interconnected. And so the many patterns of interconnections, lock it all together into a unity, which is much too complicated for us to think about, except in very simple, crude ways” (extract from “Conversation with myself”, 1971). This concept of unity as result of interconnection between the parts is easily applicable to the brain. The unity of the human brain, made by approximately 86 billions of neurons (Herculano-Houzel, 2009), is indeed
“much too complicated for us to think about” and this complexity resulted in a fragmented study of its functioning.
When we look at the literature about the blind brain we immediately realize that the great majority of the studies focused on the reorganization of the occipital cortex, neglecting in most of the cases the remaining regions of the brain. This kind of “selective” approach allowed neuroscientists to simplify the complex phenomenon of brain plasticity and to gather conspicuous amount of information about a specific component of this phenomenon (probably the most fascinating), which is how the visual cortex reorganizes in blind individuals. On the other hand, this approach prevented a more global investigation. Little is known on the way blindness affects the rest of the brain and whether the reorganization of the visual cortex occurs with (and it is connected to) changes in other brain regions. However, in the last decade some attempts in this direction have been done moving the study of brain plasticity toward a more global framework.
1.3.2
Intra-modal plasticity in the extra-occipital
cortices of early blind individuals
The mainstream hypothesis in the approach of this topic is based on the experience-dependent plasticity theory (for a review see May, 2011). Many studies, indeed, demonstrated that enhanced skills or training in specific domain would impact in the structure and function of the brain. One of the most famous studies showing the experience-dependent plasticity, reported the expansion of the hippocampus (a subcortical structure known to be involved in space navigation tasks) in a group of London taxi drivers (Maguire et al., 2000). A study on the same line showed a grey matter increase in the V5/MT+ and in parietal regions in a group of subjects that underwent a training of juggling (Draganski et al., 2004). Moreover, several studies reported musical proficiency to be associated with volume enlargement of motor and auditory areas and their anatomical connections (Bengtsson et al., 2005; Gaser and Schlaug, 2003; Sluming et al., 2002). Starting from this perspective, we can assume that people with enhanced abilities in a specific domain would also show an expansion and a refinement in the brain region that controls that skill.
Blind individuals seem to compensate for their lack of vision by relying more on their auditory and tactile senses. Several studies showed enhanced abilities compared to sighted controls in many non-visual tasks (for a review see Kupers and Ptito, 2013) such as tactile letter recognition at the fingertips (Craig, 1999), tactile gratings orientation discrimination (Boven et al., 2000; Goldreich and Kanics, 2003), tactile acuity at the fingertips (Legge et al., 2008) voice processing (Föcker et al., 2012; Gougoux et al., 2009) speech discrimination (Dietrich et al., 2013; Starlinger and Niemeyer, 1981), sound localization (Jiang et al., 2016; Lewald and Getzmann, 2013; Röder et al., 1999) and odor discrimination and identification (Cuevas et al., 2009; Murphy et al., 2016). As I introduced above, some studies showed a causal relation between the occipital activity in early blind subjects and their enhanced non-visual skills (Amedi et al., 2007; Cohen et al., 1997; Collignon et al., 2007, 2009b; Gougoux et al., 2005; Kupers et al., 2007).
in EB (Gougoux et al., 2009). Studies on visually deprived animals from birth actually produced results in line with this hypothesis (for a review see Rauschecker, 1995). Enucleated cats and mice showed significant change in the somatosensory system: in both species, the facial vibrissae were longer and thicker. Moreover, in mice there was a concomitant increase in the size of the regions representing the vibrissae in the brain (Rauschecker and Tian, 1992). Similar results emerged also about the temporal cortex of visually deprived macaques (Meng et al., 2015; Petrus et al., 2014; Wang et al., 2017). For instance, a recent study reported increased volume and enhanced activation in the auditory cortex of visually deprived macaques compared to sighted controls during auditory stimulation (Wang et al., 2017). A first generation of studies on blind humans reported similar results promoting the idea that, also in humans, visual deprivation elicits an enhanced activity and a refinement of the non-visual sensory cortices. For example, a TMS study on blind braille readers reported an expansion of the sensory-motor cortical representation of the reading finger (Pascual-leone and Torres, 1993). Studies on the sense of smell showed that the superior olfactory performance in congenitally blind individuals is associated with an increased volume of the olfactory bulb (Rombaux et al., 2010) and that, during odor processing, they stronger activated higher order olfactory areas (Kupers et al., 2011). Works using event related potentials (ERP) reported electrophysiological changes in the auditory cortex of early blind, showing a lower peak latency of the waves Nb and P1 compared to a sighted control group (Manjunath et al., 1998; Naveen et al., 1997, 1998). An additional MEG study demonstrated that the tonotopic map in the core area of the temporal cortex expands in response to high and low frequency tones in blind compared to sighted individuals. A main problem with this study is that the blind group included both early and late blind participants (Elbert et al., 2002), two types of blindness that have been showed to trigger different kind of reorganization (Collignon et al., 2013).
tasks. An fMRI study showed a lower signal volume in EB compared to SC within the temporal cortex when contrasting high versus low tones (Stevens and Weaver, 2009). In the same vein, Burton and colleagues (Burton et al., 2002b) showed lower somatosensory activation for braille reading in blind compared to sighted individuals. A further study focused on the morphological alterations in congenital blind reported an increased cortical thickness in visual regions of EB but a thinning in their auditory and somatosensory cortices compared to SC (Park et al., 2009). Similar kinds of results were found during the processing of different sounds categories. A decreased activity of parietal and frontal regions of blind compared to matched sighted controls emerged while they were listening to human action sounds (Lewis et al., 2011a).
A possible explanation for this second line of findings could be that the lower demand for temporal cortex during processing of auditory stimuli in early blind is related to the enhanced activity in their occipital cortex for the processing of the same stimuli. In other words, the intra- and the cross-modal plasticity could be, in fact, part of the same global plasticity mechanism.
1.3.3
Cross-modal and intra-modal plasticity: two
faces of the same coin?
Not many studies so far tried to integrate the two mechanisms of intra- and cross- modal plasticity into a more global and unitary view.
1.4
Investigate the brain with the fMRI: from the
origins to innovative multivariate
analyses
“What we observe is not nature itself, but nature exposed to our method of questioning.”
1.4.1
Physical
principles
behind
magnetic
resonance
Magnetic resonance imaging (MRI) makes use of strong magnetic fields to create images of biological tissues. The main parts of MRI consist of a superconductive magnet to generate a static magnetic field, radiofrequency coils to register the magnetic resonance (MR) signal, gradient coils to obtain spatial information in the MR signal and shimming coils to guarantee as much as possible the uniformity of the magnetic field.
To understand how to create a brain image from these elements we need to rely on a set of physical principles.
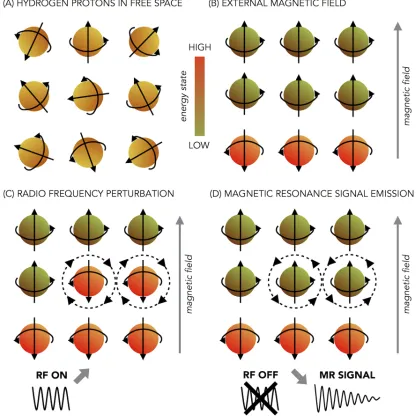
All matter is composed of atoms, which contain three types of particles: protons, neutron and electrons. Approximately the 70% of the human body is composed by water that is made by hydrogen nuclei. These nuclei consist of single protons. One important characteristic of the protons of hydrogen is that they possess the nuclear magnetic resonance property and because of that they can be studied using magnetic resonance. Under normal conditions, thermal energy makes each proton to spin around itself generating an electrical current. This electrical current induces a magnetic field. However, under normal condition the spins of the hydrogen protons are oriented randomly and therefore cancel each other out (see figure 1.5A). We need to apply a strong magnetic field to increase their net magnetization. When placed within an external magnetic field, protons change their orientations in two possible directions: parallel or antiparallel to the magnetic field. The parallel alignment requires a lower amount of energy and it is slightly more stable, for this reason there will always be more protons in the parallel compared to the antiparallel state (see figure 1.5B).
Figure 1.5: Representation of protons in the nucleus of a hydrogen atom (orange and green dots) sequentially exposed to an external magnetic field and to a radiofrequency pulse. The black straight arrows represent the orientation of the protons’ spinning. The grey arrow represents the external magnetic field. (A) In the absence of external magnetic field the protons are randomly oriented (light orange dots). (B) When an external magnetic field is applied the protons align in the parallel low-energy state (green dots) or in anti-parallel high-energy state (dark orange dots). (C) When exposed to a radiofrequency (RF) pulse some of the protons in the low-energy state will absorb the energy from the RF pulse and switch to the high-energy state (few green dots become dark orange dots). (D) When the RF pulse is removed the protons that switched their alignment release the absorbed energy generating the Magnetic Resonance (MR) signal that we want to register and they go back to their initial low-energy state (few light orange dots become green again).
the resonant frequency, some low energy spins will absorb that energy and change to the high-energy state (see figure 1.5C). After the energy source is removed, some spins will return to the low-energy state by releasing that energy (see figure 1.5D).
This phase can be decomposed into two main relaxation processes. The excited protons in the high-energy anti-parallel state that go back to the low-energy parallel state cause the longitudinal relaxation and T1 is the time constant associated
with it. The second type of relaxation is the transverse one. An intrinsic cause for the transverse relaxation is represented by the loss of phase coherence of the protons due to the interaction between each other and T2 is the time constant that describes
this decay. However, an additional extrinsic cause for the transverse relaxation is the inhomogeneity of the external magnetic field, which increases the loss of phase coherence of the protons. T2* is the time constant that describes the decay of the
transverse magnetization due to both the intrinsic and the extrinsic sources.
Measurement of these emitted energies, or MR signal, provides the data that go into our images.
1.4.2
From magnetic resonance to magnetic
resonance imaging
Importantly, the MR signal differs according to the different biological tissues (e.g. white matter, grey matter). Several pulse sequences are available, each one emphasizing different properties of the brain tissues.
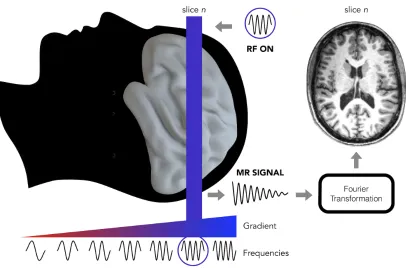
Figure 1.6: Representation of an MRI slice acquisition procedure. A gradient coil (represented by the red-to-blue triangle under the brain) makes the magnetic field strength gradually changing from one spatial location to the other. Consequently, also the resonant frequency (represented by the sinusoidal lines under the gradient) of the protons will be different at each location. To register a specific slice of the brain we need to send a RF pulse with the resonant frequency that characterizes that specific portion of the space. Only the protons with the same frequency as the RF pulses frequency will absorb and release the energy of the RF pulse allowing the registration of the MR signal only from the selected slice. Finally, using the Fourier transformation, we obtain the image of the selected brain slice (right panel).
images since they are based upon the T1 value of the tissues. As we will see in the
next paragraph, T2*-weighted images are used for BOLD-contrast fMRI; this kind of
contrast is provided by pulse sequences with long TR and medium TE.
1.4.3
Scanning the activity of the brain: functional
MRI
The possibility to scan the functioning human brain represents an important step in the progress of the human’s brain investigation. The origin of the functional MRI lies on the brilliant idea that we can infer the brain activity looking at the changes in blood circulation. Angelo Mosso, a pioneer in functional brain imaging, proposed this technique in the book “Circulation of blood in the human brain”1,
published in 1879-80.
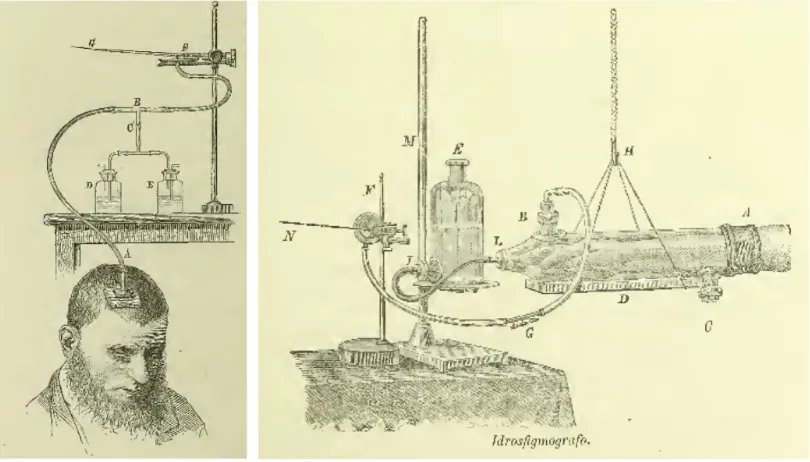
In his work he described how, using innovative (at that time) equipment and techniques (see figure 1.7A), he could register the blood flow in the brain and look at its changes while the person was performing cognitive tasks such as mathematical calculations (see figure 1.7B).
After this first attempt, several others came in succession for more than one century, till the machine that we currently use: the functional magnetic resonance imaging (fMRI). Almost nothing remains of Mosso’s machine, but the main principle on which the fMRI is based stays the same: infer brain activity from the blood flow.
This indirect measurement of the brain activity is based on the idea that information processing activity of neurons increases their metabolism and they need enhanced level of energy. It is, indeed, the vascular system that supplies neurons with glucose and oxygen. Oxygen is attached to hemoglobin molecules and it is exchanged for carbon dioxide. Importantly oxygenated and deoxygenated hemoglobin have different magnetic properties: oxy-hemoglobin is diamagnetic while deoxy-hemoglobin is paramagnetic; the latter is therefore susceptible to magnetization when placed within a magnetic field.
Figure 1.7: Representation of the first attempt to register the blood flow during cognitive tasks, employed by Angelo Mosso at the end of 19th century. (A) Machineries employed to register the blood flow at brain level (on the right panel) and at the wrist level (on the left panel) as a control region. (B) Brain blood flow (upper line) and wrist blood flow (lower line) during a mathematical task (i.e. multiplication). The symbol α and the arrow represent the onset of the task, the symbol ω represents the moment in which the subject gives the answer. The blood flow in the wrist does not show any change; while it increases in the brain suggesting a correlation between brain activity, blood flow and cognitive task performance.
presentation of an event and this peak is followed by an undershoot due to the decrease of MR signal amplitude.
The sequence most frequently used to measure BOLD-signal is a T2*-weighted echo-planar imaging (EPI) sequence (Mansfield et al., 1994). This technique allows the collection of an entire two-dimensional image by changing spatial gradients rapidly following a single electromagnetic pulse from a transmitter coil. It is the fastest acquisition method in MRI (100 ms / slice). We implemented this sequence in the data acquisition of the fMRI experiments that I present in the chapters 2 and 3.
1.4.4
Data preprocessing
The preprocessing step consists in a series of computational procedures that are applied to the fMRI data after image reconstruction and before the statistical analyses. The main aim of this step is to increase the signal to noise ratio. In other words, data preprocessing enhances BOLD signal and reduces the variability unrelated to the task in order to clean the data before the statistical testing. The main steps in the processing pipeline are: slice time correction, head motion correction, coregistration, normalization and spatial filtering (see figure 1.8).
Figure 1.8: Preprocessing pipeline of fMRI data.
Slice time correction.
Head motion correction.
Functional MRI analyses assume that each voxel represents a unique part of the brain; if the subject's head moves, this assumption is not respected.
Since the brain is the same in every image, we can use the rigid body transformation to coregister the images within each subject.
Coregistration
In order to have more precise spatial coordinates, coregistration is used to map functional and structural images of the same subject.
Normalization
The human brain has a huge anatomical variability in both size and shape. The aim of normalization is to compensate for these differences by coregistering the data into a common space. The most commonly used spaces are Talairach (Talairach and Tournoux, 1988) and MNI spaces.
Even if normalization is a powerful technique that allows groups comparison and enhance the statistical power of fMRI analyses, there is a main disadvantage that should be taken into account especially when we work with specific populations, such as in our case with blind individuals.
All normalization approaches are based on samples derived from standard population of fMRI subjects: educated young adults healthy and neurologically normal. The brain of other individuals, especially in the case of special populations, might differ in many properties from the brain of this standard population. For examples, blindness is associated with significant changes in the structure of the brain itself, particularly within the occipital cortex (Dormal et al., 2016; Jiang et al., 2016; Pan et al., 2007; Park et al., 2009). In order to avoid this problem, when working with special populations there are several possibilities that could be used in place of the standard normalization step.
normalization we used a customized template created by the DARTEL (Diffeomorphic Anatomical Registration Through Exponentiated Lie Algebra, (Ashburner, 2007) toolbox. DARTEL normalization takes the grey and white matter templates from each subject to create an averaged template that will be used for the normalization. The aim of this process is to increase the coregistration efficiency between individuals. The creation of a study-specific template using DARTEL should reduce deformations errors that are more likely to arise when co-registering single subject images to an unusually shaped template (Ashburner, 2007).
The second possibility consists in avoiding the normalization step. In study 2 we used the brain parcellation technique to avoid normalization preprocessing. In each subject, we used the anatomical scan to reconstruct the cortical surface of each hemisphere using FreeSurfer (http://surfer.nmr.mgh.harvard.edu). The cortical anatomic segmentation can be performed according to different atlas such as the Desikan-Killiany (Desikan et al., 2006) and the Destrieux (Destrieux et al., 2010) atlas. Finally, it is possible to select the regions of interest (ROIs) individually defined in each subject.
Of course, these alternative techniques are not perfect and have their own disadvantages such as time consumption or, in the case of individually defined ROIs, the difficulty to run whole brain group analyses.
Spatial filtering.
1.4.5
General Linear Model
The general linear model (GLM) was introduced for the first time in the field of functional neuroimaging in 1995 (Friston et al., 1995) and after this first paper an increasing number of researchers embraced this technique to analyze their fMRI data. Nowadays the GLM is still highly used for fMRI analyses and most of the fMRI studies published in the neuroimaging field use this technique (Poline and Brett, 2012).
The GLM approach treats the data as a linear combination of model functions and uncorrelated noise. The goal of the GLM is to find the best weight for each model function to best explain the acquired data and to minimize the value of the noise. The standard GLM equation is given by
Y = X * β + ε
where Y refers to the observed data, that in the case of fMRI is the BOLD signal at various time points at a single voxel; X represents the several components that explain the observed data (e.g. the experimental conditions) and are included in the design matrix; β are the parameters that define the contribution of each component of the design matrix to the value of Y; finally ε refers to the error and
represents the difference between the observed data Y and that predicted by the model Xβ. Basically the GLM wants to quantify, starting from a finished product (brain activity), the participation of each component (experimental conditions) in shaping the finished product.
1.4.6
Univariate analyses
1.9, viewing pictures of living stimuli (condition 1) and viewing pictures of non-living stimuli (condition 2).
In this case we can test at each voxel if the activity for the living pictures is significantly higher than the activity for the non-living stimuli simply subtracting theβ
values of the non-living stimuli from the β values of the living stimuli (see figure 1.9). This method has been extremely productive and contributed to rapidly expand the knowledge about the brain functions in the last 20 years. It is thanks to this method that the first generation of studies about crossmodal plasticity has been able to show increased activity in the occipital cortex of early blind compared to sighted subjects during non-visual tasks.
Thanks to this technique we also learnt most of the information about the representation of different categories in the brain. Arguably the most impacting example is the categorical subdivision in the visual ventral stream, mostly emerged using univariate fMRI analyses (see Grill-Spector and Weiner, 2014 for a review). Even if univariate analyses represent a powerful method to address certain kinds of question they have same disadvantages.
1.4.7
Multivariate pattern analyses (MVPA)
In the last decade, the interest of cognitive neuroscience has increasingly moved towards new questions and new perspectives of approaching the investigation of the human brain functions. As it often happens, new questions need and bring new methods. The main characteristic of the new generation of analysis’ techniques is that it does not look at single voxels but at groups (i.e. pattern) of voxels and for this reason they are called multivariate analyses. This kind of techniques gives more importance to the information, rather than the activation, contained in the different areas of the brain and it is more sensitive to the subtle differences compared to the univariate analysis. These methods extract the signal that is present in the pattern of activity across multiple voxels, even if each voxel considered individually might not show significant activation to any of the experimental conditions (Norman et al., 2006). In their seminal 2001 study, Haxby and collaborators presented pictures of different categories (e.g. faces, cats, man-made objects) to their participants and were able to show a distinct pattern of response for each category, inside the visual ventral pathway. Interestingly this was true also in those regions that, at univariate level, showed specific activation only for one category compared to the others (Haxby et al., 2001).
more datdriven. On the other hand the ROIs approach, in the case of a strong a-priori assumption, can be the right choice to increase the statistical power of the analyses by decreasing the number of multiple comparisons.
I employed both these approaches in the studies described in the next chapters. In chapter 2 I ran MVP classification with the searchlight whole brain approach. In the chapter 3, instead, I directly used ROI approach; in this case I based the selection of the regions of interest on studies from previous literature.
MVP Classification analysis
MVP Classification analysis can address the question: “Is there (in the selected ROI or in the searchlight sphere) enough information to distinguish the stimuli from each condition?” This method is based on pattern classification techniques, in which the patterns that we want to classify are vectors of voxels activity values (Norman et al., 2006). Because classifiers rely on feature selectivity and a spatial inhomogeneity of feature-selective responses, only their conjunction can lead to biased responses in segregated voxels (Bartels et al., 2008).
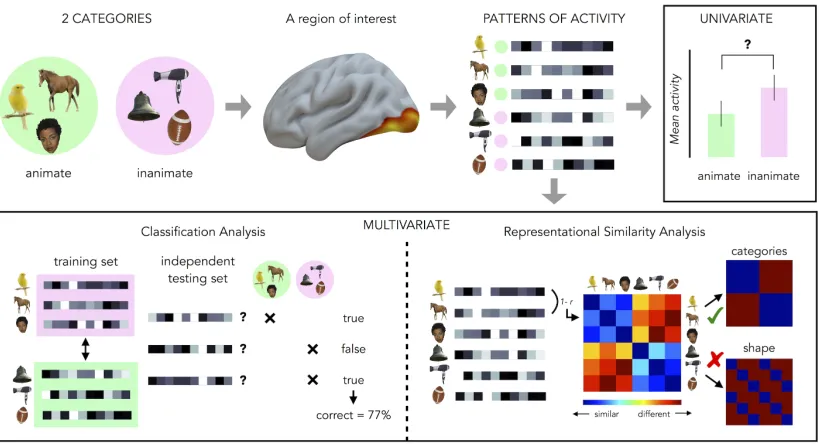
Figure 1.9: Representation of univariate and multivariate fMRI data analyses. In this example stimuli from two different categories (animate & inanimate) are presented (top-left) and the brain activity is extracted from a region of interest (ROI). In the univariate analysis (top-right) we compare the mean activity of the ROI for the animate stimuli with the main activity of the ROI for the inanimate stimuli to see whether the ROI is more activated by one category compared to the other. In the MVP classification analysis (bottom-left) the patterns of activity are divided into two data sets, a classifier is trained on the first set and tested on the second one. A successful decoding means that the ROI contains information about the different categories. Finally in the RSA analysis (bottom-right) we compute a neural dissimilarity matrix (DSM) based on the similarity between each pair of stimuli (red=different; blue=similar). Then, computing the correlation between the neural DSM and external models, we can test which feature of the stimuli is processed in the ROI (in this example is the categorical content and not the shape).
Representational similarity analysis (RSA)
RSA is a multivariate technique that aims to study the correspondence between the relations among the stimuli on one hand and the relations among their representation on the other hand (Kriegeskorte et al., 2008). Using this technique, we can address the questions: “How similar are the patterns generated by the different stimuli? And which features of the stimuli better explain this similarity?”
correspondent pair of stimuli. Even though many different measures can be employed to define the dissimilarity between patterns (e.g Euclidean/Mahalanobis distance or classification accuracy, see Walther et al., 2016), the most frequent method is the correlation measure. The RDM can be created not only based on the brain activity but also on the physical properties of the stimuli or related to behavioral performance (reaction time or explicit similarity judgments) of the participants. Then, it is possible to compare brain dissimilarity matrices and model dissimilarity matrices through a second-level matrices correlation, assessing which information is encoded in a specific area of the brain (see figure 1.9).
The main strength of RSA is that it compares representations at the level of the dissimilarity matrices and not at the level of the activity patterns. Thanks to this abstraction from the original space it is not needed to define the correspondence mapping between the representational units (i.e. voxels). This makes RSA a highly flexible tool, which allows relating brain regions, different subjects, species and modalities of brain activity measurement and also brain and behavior (Kriegeskorte et al., 2008).
1.4.8
Using multivariate analyses to investigate
amodal regions in the brain
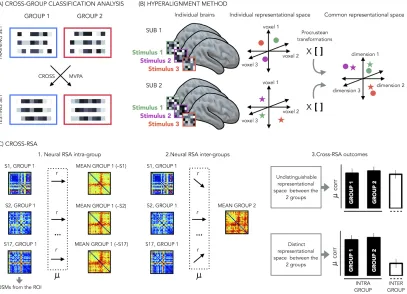
Figure 1.10: Comparing representational space between subjects. (A) Cross group classification analysis. In case of large ROIs it is possible to apply the cross-group classification analysis. The idea at the base of this analysis is to present the stimuli two different groups (e.g blind and sighted). Then, it is possible to train the classifier on the pattern of activities generated by one group for subsequent testing on the other group. If there is shared information in the two groups the classification will be above the chance level. (B) Hyperaligment metod. Hyperalignment aligns neural representational space of ROIs in individual subjects’ into a common model space of the same ROI in high-dimensional space using Procrustes transformation (e.g. rotation). (C) Cross-RSA analysis. 1.To compute the neural RSA intra group the DSM of each participant is correlated with the mean DSM of his group excluding his own DSM; 2. to compute the neural RSA between group the DSM of each participant is correlated with the mean DSM of the second group; 3. in case the representational space is highly similar between the 2 groups the intra-group and the inter-group correlation will be comparable; on the contrary, if the representational space is different between the 2 groups the intra-group correlation will be higher than the inter-group correlation.
to train the classifier on each modality for subsequent testing on the other modality. In this way, only the category-specific information that is shared by both modalities/conditions is informative to the classifier. This analysis has been considered, so far, as a method to isolate the regions that participate in the representation of different semantic categories independently of the modality through which the representations are accessed (Fairhall and Caramazza, 2013).
However, this technique is based on high-spatial-frequency patterns of response and it is really difficult to define a correspondence between these features across brains. As a consequence, this is a tool that should ideally be used within the subject space, with a new classifier model built for each brain. Cox and Savoy (2003) reported, indeed, a drop in the classifier performance if based on other subjects’ data (Cox and Savoy, 2003). This performance decrement is link to the fact that the structure of the activity patterns differs across subjects (Haxby et al., 2011). This makes MVP classification a difficult method for between subjects and between groups’ analyses. However there are some exceptions.
across different brains.
Another attempt to use the classification analysis across subjects comes from the hyperalignment method (Haxby et al., 2011, see figure 1.10B). In this study, the authors proposed an innovative technique to align patterns of neural response across subjects into a common, high-dimensional space. To do that, they registered the brain responses of different subjects while they were watching a full-length movie and, based on these responses, they estimated the parameters to transform the individual voxel’s space into a common space. Using the words of the authors:
“hyperalignment uses Procrustean transformations (Schonemann, 1966) iteratively over pairs of subjects to derive a group coordinate system in which subjects’ vector trajectories are in optimal alignment. The Procrustean transformation is an orthogonal transformation (rotations and reflections) that minimizes the Euclidean distance between two sets of paired vectors” (Haxby et al., 2011). In their paper they showed that, after hyperalignment, it is possible to perform classification analysis across different subjects with results much more accurate compared to the results obtained after the classical anatomical realignment. This technique is certainly an innovative and powerful tool, howe