R E S E A R C H A R T I C L E
Open Access
Ocular changes during hemodialysis in
patients with end-stage renal disease
Hejun Chen
1, Xi Zhang
2and Xi Shen
1*Abstract
Background:To explore ocular changes during hemodialysis (HD) in chronic renal failure patients and to determine the effects of different causes of renal failure during HD.
Methods:A total of 90 eyes from 45 end-stage renal disease (ESRD) patients undergoing HD were evaluated in this study. All ophthalmological examinations were conducted within 1 h before and after a single HD session. The HD patients were divided into primary kidney disease (KD), hypertensive KD, diabetic KD (DM-KD) and unknown etiology subgroups according to the primary etiology of renal failure. The statistics of 38 eyes from 19 healthy people were set as normal control.
Results:Tear break-up time (TBUT) (P= 0.020), Schirmer’s I test results (P= 0.030), anterior chamber depth (ACD) (P= 0.006), lens thickness (LT) (P< 0.001) and choroidal thickness (CHT) (P < 0.001)decreased significantly after a single HD. The retinal nerve fiber layer (RNFL) thickness and average retinal thickness (RT) increased after HD, especially in the nasal inner macula (NIM) subfield (P< 0.001), the inferior inner macula (IIM) subfield (P= 0.004) and the superior outer macula (SOM) subfield (P= 0.012). TBUT, Schirmer’s I test, IOP, RT, and CHT were correlated with one or more parameters. All ESRD patients regardless of etiology had the same trend for most parameters during HD, with the exception of the logMAR of BCVA, central corneal thickness, RNFL thickness and CHT.
Conclusions:HD may affect a range of ocular parameters in ESRD patients. Dry eye parameters, RT and CHT exhibited the most obvious changes. Different etiologies tended to have similar trends in ocular parameter changes during HD.
Keywords:End-stage renal disease, Hemodialysis, Ocular changes
Background
End-stage renal disease (ESRD), with a glomerular filtra-tion rate lower than 15 ml/ (min*1.73 m2), is the 5th stage of disease and the final outcome of disease pro-gression in chronic kidney disease (CKD) patients. At this stage, a variety of clinical manifestations, such as hypertension, anemia, and edema, and metabolic and endocrine disorders can occur; thus, renal replacement therapy, such as hemodialysis (HD), is needed to remove excess water and metabolic wastes from the extracorpor-eal blood and to maintain the electrolyte and acid-base balance [1].
The negative impact of CKD on the patient’s eye is complex and diverse. Studies have shown that HD, as a relief and treatment of CKD, can improve certain ocular symptoms in ESRD patients. It has been reported that best corrected visual acuity (BCVA) improves after a single HD session, and patients with diabetes tend to have more obvious improvements [2, 3]. Other re-searchers have reported that HD can relieve macular edema in patients with kidney failure caused by diabetes [4]. However, in most cases, the negative impact of hemodialysis on the eye in CKD patients seems to be far beyond its positive impact. Aktas et al. [5] found aggra-vation of dry eye syndrome after a single session of HD. Moreover, it has been observed since the early sixties that HD can change the level of intraocular pressure (IOP). Different studies have shown IOP to increase [6–8], decrease [9] or remain unchanged [10]. The ef-fects of HD on the posterior pole include changes in * Correspondence:carl_shen2005@126.com
Hejun Chen and Xi Zhang are first authors.
Hejun Chen and Xi Zhang contributed equally to this work.
1Ruijin Hospital Affiliated to Shanghai Jiao Tong University School of
Medicine, No. 197 Rui Jin Er Road, Shanghai 200025, China Full list of author information is available at the end of the article
retinal thickness, retinal nerve fiber layer (RNFL) thick-ness, and choroidal thickness. Significant differences in these parameters have been reported in some studies, al-though others hold different views [11–13].
Since most of the effects of HD on ophthalmological parameters remain unclear and because no studies have reported the effects of HD on different etiologies, we conducted this study including a total of 45 patients with ESRD who underwent HD and analyzed the changes of both laboratory test and ocular parameters after HD to investigate the effects of the hemodialysis on the eye.
Methods Subjects
CKD stage 5 patients undergoing hemodialysis treatment for at least 3 months at the Blood Purification Center of Ruijin Hospital affiliated with Shanghai Jiao Tong University from February 2014 to October 2014 were enrolled in this study. Hemodialysis was performed 3 times a week, each lasting 3–5 h.
The inclusion criteria were visual acuity over 20/200 as well as Oculus Pentacam® anterior segment analyzer (Oculus Inc., Wetzlar, Germany) results and OCT re-ports of acceptable quality. The exclusion criteria were a history of surgical or laser-based operations to the eye, other ocular diseases such as corneal scarring, uveitis, macular holes, and other conditions, or a history of renal replacement therapy, including peritoneal dialysis and kidney transplantation.
The hemodialysis group was divided into primary kidney disease (KD), hypertensive KD and diabetic KD (DM-KD) subgroups strictly according to the initial etiology of renal insufficiency. When patients failed to provide reliable sup-porting materials or when two or more etiologies were sus-pected, the patients were included in the etiology unknown subgroup. Nineteen healthy people without HD history were set as normal control.
This study adhered to the Declaration of Helsinki and was approved by the institutional review board of Shanghai Ruijin Hospital. Informed consent was obtained from the subjects after verbal and written explanations of the nature and possible consequences of the study were provided.
Protocol
Blood reports, including urea, creatinine, uric acid, serum electrolytes (Na, K, Ca, P, Mg), parathyroid hormone (PTH), and fasting blood glucose levels, were collected before hemodialysis.
Blood pressure and detailed ophthalmological examina-tions, including spherical and cylinder powers, BCVA, IOP, dry eye analysis, corneal endothelial measurements, central corneal thickness (CT), anterior chamber depth (ACD), lens measurements, retinal thickness (RT) around the fovea, RNFL thickness, and choroidal thickness
(CHT), were performed. BCVA was examined using a standard vision chart, and the logarithmic minimum angle of resolution (logMAR) was recorded. Refractive parame-ters were measured by a full auto ref-keratometer (Canon, Japan). IOP was measured by non-contact tonometer (NCT) (Canon, Japan). Dry eye syndrome was estimated by the tear break-up time (TBUT) and Schirmer’s I test. Endothelial cell density (ECD), the average endothelial cell size (ECS), and the endothelial cell size variation coeffi-cient (ECSCV) were obtained using a Tomey EM-3000 non-contact specular microscope corneal endothelial cell counter. The CT, ACD and lens thickness (LT) were auto-matically calculated using a Pentacam® anterior segment analyzer (Oculus Inc., Wetzlar, Germany). The RT and RNFL thickness was measured using Cirrus HD-OCT (Carl Zeiss Meditec, Inc., Dublin CA, United States) under the Macular Cube 512 × 128 mode. The RT was defined as the average thickness of the 6 mm × 6 mm scan. The nine subfields of the RT map were measured separately. The inner, intermediate, and outer rings had radii of 1 mm, 3 mm, and 6 mm, respectively. The average thickness within the inner ring was defined as the central foveal sub-field (CSF) thickness [14]. The average CHT was measured in the EDI mode of OCT. The subfoveal, nasal and tem-poral choroidal thicknesses were each measured 1 mm and 2 mm away from the center of the macula, averaged, and recorded as the average thickness of the choroid.
All examinations were measured within an hour before and after a single session of hemodialysis.
Statistical analysis
Paired t-tests were used for indexes measured before and after HD if homogeneity of variance was verified. If homo-geneity of variance was not verified, then a non-parametric test was used. Multiple linear regression analyses were con-ducted to identify correlations between parameters. Then, single factor analysis of variance (one-way ANOVA) and least-significant difference (LSD) tests were performed to determine parameters with significant changes during HD among subgroups according to their etiological classifica-tion. Lastly, one-way ANOVA was used to compare pa-rameters with significant changes. A box plot was drawn, and Tukey’s test was used to isolate data with large de-viations. The P-values, Estimated Marginal Means and their standard errors (SEs) were calculated by General Estimating Equations (which automatically take into ac-count paired eye data from the same subject) after adjust-ing for age, sex, eyes, measurement times, HD duration, and primary diseases.
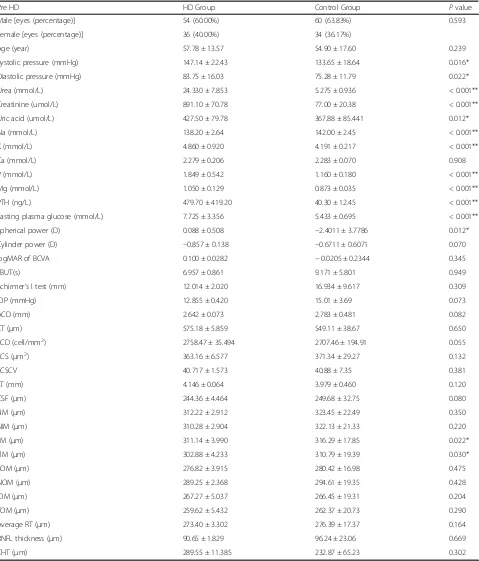
Table 1Demographic characteristics of the hemodialysis group (pre HD) and the control group: comparison of basic situation and baseline data (Mean ± SD)
Pre HD HD Group Control Group Pvalue
Male [eyes (percentage)] 54 (60.00%) 60 (63.83%) 0.593
Female [eyes (percentage)] 36 (40.00%) 34 (36.17%)
Age (year) 57.78 ± 13.57 54.90 ± 17.60 0.239
Systolic pressure (mmHg) 147.14 ± 22.43 133.65 ± 18.64 0.016*
Diastolic pressure (mmHg) 83.75 ± 16.03 75.28 ± 11.79 0.022*
Urea (mmol/L) 24.330 ± 7.853 5.275 ± 0.936 < 0.001**
Creatinine (umol/L) 891.10 ± 70.78 77.00 ± 20.38 < 0.001**
Uric acid (umol/L) 427.50 ± 79.78 367.88 ± 85.441 0.012*
Na (mmol/L) 138.20 ± 2.64 142.00 ± 2.45 < 0.001**
K (mmol/L) 4.860 ± 0.920 4.191 ± 0.217 < 0.001**
Ca (mmol/L) 2.279 ± 0.206 2.283 ± 0.070 0.908
P (mmol/L) 1.849 ± 0.542 1.160 ± 0.180 < 0.001**
Mg (mmol/L) 1.050 ± 0.129 0.873 ± 0.035 < 0.001**
PTH (ng/L) 479.70 ± 419.20 40.30 ± 12.45 < 0.001**
Fasting plasma glucose (mmol/L) 7.725 ± 3.356 5.433 ± 0.695 < 0.001**
Spherical power (D) 0.088 ± 0.508 −2.4011 ± 3.7786 0.012*
Cylinder power (D) −0.857 ± 0.138 −0.6711 ± 0.6071 0.070
logMAR of BCVA 0.100 ± 0.0282 −0.0205 ± 0.2344 0.345
TBUT(s) 6.957 ± 0.861 9.171 ± 5.801 0.949
Schirmer’s I test (mm) 12.014 ± 2.020 16.934 ± 9.617 0.309
IOP (mmHg) 12.855 ± 0.420 15.01 ± 3.69 0.073
ACD (mm) 2.642 ± 0.073 2.783 ± 0.481 0.082
CT (μm) 575.18 ± 5.859 549.11 ± 38.67 0.650
ECD (cell/mm2) 2758.47 ± 35.494 2707.46 ± 194.91 0.055
ECS (μm2) 363.16 ± 6.577 371.34 ± 29.27 0.132
ECSCV 40.717 ± 1.573 40.88 ± 7.35 0.381
LT (mm) 4.146 ± 0.064 3.979 ± 0.460 0.120
CSF (μm) 244.36 ± 4.464 249.68 ± 32.75 0.080
SIM (μm) 312.22 ± 2.912 323.45 ± 22.49 0.350
NIM (μm) 310.28 ± 2.904 322.13 ± 21.33 0.220
IIM (μm) 311.14 ± 3.990 316.29 ± 17.85 0.022*
TIM (μm) 302.88 ± 4.233 310.79 ± 19.39 0.030*
SOM (μm) 276.82 ± 3.915 280.42 ± 16.98 0.475
NOM (μm) 289.25 ± 2.368 294.61 ± 19.35 0.428
IOM (μm) 267.27 ± 5.037 266.45 ± 19.31 0.204
TOM (μm) 259.62 ± 5.432 262.37 ± 20.73 0.290
Average RT (μm) 273.40 ± 3.302 276.39 ± 17.37 0.164
RNFL thickness (μm) 90.65 ± 1.829 96.24 ± 23.06 0.669
CHT (μm) 289.55 ± 11.385 232.87 ± 65.23 0.302
PTHParathyroid hormone,TBUTTear break-up time,logMARLogarithmic minimum angle of resolution,BCVABest corrected visual acuity,IOPIntraocular pressure,
Results
Demographic characteristics of the HD patients and healthy controls
A total of 90 eyes from both sides of 45 HD patients were included in the study, including 27 pairs of male eyes (60.00%) and 18 pairs of female eyes (40.00%). The average age was 57.48 ± 13.57 years. The mean dialysis time was 70.09 ± 58.03 months. The patients were di-vided into 3 subgroups: the primary KD subgroup, the hypertensive KD subgroup and the DM-KD subgroup. No differences were found in age (P= 0.639) or dialysis time (P= 0.270) among the 3 subgroups.
Thirty-eight eyes from 19 healthy people were set as normal control. The blood pressure (both systolic and diastolic), urea, creatinine, uric acid, Na, K, P, Mg, PTH, fasting plasma glucose were found statistically different from the pre-HD ESRD patients. However, most of the ocular parameters, except for Spherical power and a few part of the retinal thickness showed no statistical difference (Table1).
A comparison of blood pressure during HD
The average systolic pressure (SP) before HD was 147.14 ± 22.43 mmHg, which increased to 136.09 ± 24.37 mmHg after HD (P= 0.001). The mean diastolic blood pressure (DP) decreased from 83.75 ± 16.03 mmHg to 76.48 ± 13.47 mmHg (P= 0.006).
Conjunctival and corneal calcification
Visible calcium deposits were spotted on the cornea or conjunctiva in 22 (48.89%) of the 45 hemodialysis patients. These deposits were located in the nasal and/or temporal side of the cornea, conjunctiva and limbus. They were either white or gray and were point-, line- or block-shaped (Fig.1).
A comparison of the ocular surface, BCVA, and refractive parameters during HD
After HD, the TBUT decreased from 6.957 ± 0.861 s to 5.205 ± 0.670 s (P= 0.020), and the Schirmer’s I test results decreased from 12.014 ± 2.020 mm to 9.964 ± 1.912 mm (P= 0.030). However, no significant change was observed in the BCVA (P= 0.880), spherical power (P= 0.442) or cylinder power (P= 0.937) measurements during HD (Table2).
A significant positive correlation was found between the TBUT change within each HD session and the duration of all HD treatments (B= 0.040, T= 3.670, P= 0.001). Meanwhile, the change in the Schirmer’s I test results (B=−0.566, T=−5.121, P< 0.001) and blood urea levels (B=−0.271,T=−2.179,P= 0.036) were negatively correlated.
Comparison of the IOP and anterior segment parameters during HD
The ACD decreased from 2.642 ± 0.073 mm to 2.613 ± 0.077 mm after HD (P= 0.006). The mean LT dropped from 4.153 ± 0.413 mm to 4.056 ± 0.389 mm (P< 0.001). No significant differences were observed in IOP (P= 0.113), CT (P= 0.643), ECD (P= 0.807), ECS (P= 0.164), or ECSCV (P= 0.348) during HD (Table3).
We found a negative correlation between changes in IOP during HD and diastolic pressure (B=−0.068, T=−3.606,P= 0.001).
A comparison of the posterior segment parameters during HD
The average retinal thickness increased from 273.40 ± 3.302μm to 275.60 ± 3.180 μm (P= 0.071), especially in the nasal inner macula (NIM) subfield (P< 0.001), the inferior inner macula (IIM) subfield (P= 0.004) and the superior outer macula (SOM) subfield (P= 0.012). The remaining subfields had no significant differences. The RNFL thickness increased from 90.65 ± 1.829 μm to 93.18 ± 1.974 μm (P= 0.001). The CHT decreased from 289.55 ± 11.385 μm to 254.134 ± 11.46 μm (P< 0.001) (Table4).
A positive correlation was found between the average RT change and the central corneal thickness (B= 0.130, T= 5.127, P< 0.001) and the potassium level (B= 3.950, T= 2.650, P= 0.012) before HD. The choroidal thickness
change was positively related to TBUT (B= 3.120, T= 3.637, P = 0.001) and was negatively correlated with sodium level (B =−4.163, T=−2.241, P= 0.031) and ACD (B =−30.190,T=−2.356,P= 0.024) before HD.
Comparison of parameters between subgroups according to the original cause of HD
Both eyes of all HD patients were divided into 4 sub-groups according to the etiology of ESRD: the primary kidney disease (KD) subgroup (n= 27), the hypertensive KD subgroup (n= 9), the diabetic mellitus KD (DM-KD) subgroup (n= 6) and the etiology unknown subgroup (n= 3). The 3 etiology unknown patients were not in-cluded in the following analysis (Table5).
There were no differences in the sex, age and HD dur-ation among the 3 subgroups. However, four parameters, logMAR of BCVA, CT, RNFL thickness and CHT, were significantly different among subgroups (Fig.2).
In summary, primary KD, hypertension and diabetes mellitus are three conditions that affect eye examination results during HD to a certain degree. However, the different causes of CRF requiring hemodialysis tend to have the same overall trend in most parameter changes except the logMAR of the BCVA, CT, RNFL thickness and CHT. Lower BCVA, increased central corneal thick-ness, and decreased RNFL thickness and CHT were observed in the DM-KD patients.
Table 2Comparison of the ocular surface, BCVA, and refractive parameters during HD
HD group parameters Pre (Estimated Marginal Mean ± SE) Post (Estimated Marginal Mean ± SE) Pvalue
TBUT (s) 6.957 ± 0.861 5.205 ± 0.670 0.020*
Schirmer’s I test (mm) 12.014 ± 2.020 9.964 ± 1.912 0.030*
logMAR of BCVA 0.100 ± 0.0282 0.099 ± 0.027 0.880
Spherical power (D) 0.088 ± 0.508 0.032 ± 0.498 0.442
Cylinder power (D) −0.857 ± 0.138 −0.863 ± 0.148 0.937
TBUTTear break-up time,logMARLogarithmic minimum angle of resolution,BCVABest corrected visual acuity, *:P< 0.05
TheP-values, Estimated Marginal Means and their standard errors (SEs) were calculated by General Estimating Equations after adjusting for age, sex, eyes, measurement times, HD duration, and primary diseases
Table 3Comparison of the IOP and anterior segment parameters during HD
HD group parameters Pre (Estimated Marginal Mean ± SE) Post (Estimated Marginal Mean ± SE) Pvalue
IOP (mmHg) 12.855 ± 0.420 12.292 ± 0.476 0.113
ACD (mm) 2.642 ± 0.073 2.613 ± 0.077 0.006*
LT (mm) 4.146 ± 0.064 4.049 ± 0.063 < 0.0001*
CT (μm) 575.18 ± 5.859 579.62 ± 5.427 0.643
ECD (cells/mm2) 2758.47 ± 35.494 2766.55 ± 41.074 0.807
ECS (μm2) 363.16 ± 6.577 359.36 ± 5.120 0.164
ECSCV 40.717 ± 1.573 40.073 ± 1.306 0.348
IOPIntraocular pressure,ACDAnterior chamber depth,LTLens thickness,CTCorneal thickness,ECDEndothelial cell density,ECSEndothelial cell size,ECSCV
Endothelial cell size variation coefficient, *:P< 0.05
Discussion
All patients showed significant changes in dry eye parame-ters, RT and CHT. Different etiologies tended to exhibit similar trends in ocular parameter changes during HD.
HD is the process of clearing excess body water and metabolic waste. Therefore, body fluid volume, solute concentration, and crystal osmotic pressure decrease after HD. Our study shows that, consistent with most studies [2, 15], the TBUT and Schirmer’s test results significantly decrease during HD. Aggravation of dry eye syndromes may be the result of less body fluid and tear secretion. Although toxins are removed from patients during HD, these patients still resemble secretion-defi-cient dry eye patients after treatment and are in need of ophthalmic artificial tear replacement. Moreover, a posi-tive correlation was found between the TBUT reduction and HD duration, indicating the cumulative effect of HD on the patients’ dry eye conditions. Dry eye symptoms
can be observed immediately (within an hour) after a single HD session. Both the long-term and short-term effects of HD should be fully considered to relieve symp-toms of dry eye.
Over the years, there have been a number of studies on HD, leading to changes in IOP. However, the conclusions of different scholars vary. Overall, the factors associated with post-HD IOP change are mainly measurement tech-niques and the anterior chamber angle. Findings obtained using the Goldmann tonometer tended to find reductions; the use of NCT resulted in opposite findings in that in-creased IOP is more likely to take place in a narrow and obstructive anterior chamber angle and tends to decline at an opposite angle [2,9–11, 16, 17]. Our study suggested that the IOP has no significant change after HD regardless of the etiology of the ESRD. A negative correlation was observed between the changes in the IOP and diastolic pressure. IOP might be related not only to measurement method and anterior chamber angle, but also to blood pressure.
Early researchers believed that after HD, the ACD would either decline [2] or would not change [16]. In our study, the ACD significantly declined after HD. With the reductions in body fluid volume and osmotic pres-sure caused by HD, the amount of aqueous humor declined. Moreover, because this decrease is mainly due to changes in the crystal osmotic pressure rather than the colloid osmotic pressure, the latter increases after HD, and it can result in the aqueous humor flowing into the blood via the anterior chamber angle trabecular meshwork. This mechanism also contributes to reduced intraocular pressure. However, in patients with narrow or obstructive angles, this process is hampered, and due Table 4Comparison of the posterior segment parameters during HD
HD group parameters Pre (Estimated Marginal Mean ± SE) Post (Estimated Marginal Mean ± SE) Pvalue
Average RT (μm) 273.40 ± 3.302 275.60 ± 3.180 0.071
CSF (μm) 244.36 ± 4.464 246.56 ± 4.575 0.308
SIM (μm) 312.22 ± 2.912 312.43 ± 2.717 0.895
NIM (μm) 310.28 ± 2.904 313.21 ± 3.037 < 0.001*
IIM (μm) 311.14 ± 3.990 313.53 ± 4.090 0.004*
TIM (μm) 302.88 ± 4.233 304.58 ± 3.889 0.150
SOM (μm) 276.82 ± 3.915 282.49 ± 4.127 0.012*
NOM (μm) 289.25 ± 2.368 291.42 ± 2.636 0.064
IOM (μm) 267.27 ± 5.037 266.69 ± 4.816 0.570
TOM (μm) 259.62 ± 5.432 261.21 ± 4.707 0.409
RNFL thickness (μm) 90.65 ± 1.829 93.18 ± 1.974 0.001*
CHT (μm) 289.55 ± 11.385 254.134 ± 11.46 < 0.001*
CSFCentral subfield,SIMSuperior inner macula,NIMNasal inner macula,IIMInferior inner macula,TIMTemporal inner macula,SOMSuperior outer macula,
NOMNasal outer macula,IOMInferior outer macula,TOMTemporal outer macula,MVMacular volume,RNFLRetinal nerve fiber layer,CHTChoroidal thickness, *:P< 0.05 TheP-values, Estimated Marginal Means and their SEs were calculated by General Estimating Equations after adjusting for age, sex, eyes, measurement times, HD duration, and primary diseases
Table 5Demographic characteristics of the 3 etiological ESRD subgroups
Characteristics Primary KD
n= 45
Number of eyes (eyes) 90
Men, n (%) 27 (60.0%)
Age (years) 57.78 ± 13.57
HD duration (months) 70.09 ± 58.03
Primary Diseases, n (%) 27 (60.0)
Hypertensive KD, n (%) 9 (20.0)
DM-KD, n (%) 6 (13.3)
to the decline in the plasma crystal osmotic pressure, body fluid moves along the concentration gradient into the anterior chamber; this process may lead to increased IOP and even acute angle-closure glaucoma [17]. Based on this conclusion, we should consider IOP, gonioscopy, and visual field tests for HD patients. For those with a high risk of anterior chamber obstruction, more detailed follow-ups should be conducted to determine any pos-sible existence of glaucoma. These patients are classified as high risk patients, and preventative measures should be taken in the hemodialysis unit.
During HD, retinal thickness tended to increase in different locations and different layers of the retina, in-cluding the RNFL. Different etiologies did not affect the degree of change in these parameters. However, previous research found no statistically significant differences before and after HD in terms of the macular thickness [13, 18], the thickness of the surrounding macular areas [13], the macular volume [12] or the layer of retinal gan-glion cells [11,12]. Our conclusion is not yet supported by other studies, so we propose the following hypothesis: HD reduces the plasma crystal osmotic pressure such that the
liquid goes into the layers of the retina along the concen-tration gradient, thickening the retina and leading to edema. The specific mechanisms of our hypothesis await verification from follow-up studies.
Many studies have shown that the subfoveal, nasal, temporal and average choroidal thicknesses can be sig-nificantly reduced by HD [13,19]. Our conclusion is the same as those of previous studies in that the average CHT significantly decreased after HD; this was especially the case in patients with DM, in whom the CHT was significantly smaller both before and after HD. The CHT change was positively related to the TBUT before HD because HD removes excess body liquid and reduces the blood volume. Thus, the choroidal vascular layer signifi-cantly “shrinks,” and the choroidal thickness is reduced. These changes are associated with certain indicators that reflect the body fluid volume. Earlier research found that the peak systolic flow velocity (PSV) and end diastolic flow velocity (EDV) both significantly de-cline in the temporal posterior ciliary artery (TPCA) and the central retinal artery (CRA) [20] after HD. Combined with the findings of our study, we suggest
that optic blood vessels can be considered to provide relatively insufficient blood supply after hemodialysis. Therefore, in this phase, clinical physicians should pay special attention to the prevention and treatment of ocular ischemic diseases.
No obvious change in BCVA occurred after HD. More-over, no change in vision was related to the etiology of ESRD, leading to the conclusion that HD cannot directly affect vision. A previous study suggested that HD can im-prove BCVA [21], although some scholars hold the oppos-ite view, particuarly for patients with DM-KD [10]. Similarly, we found that visual acuity before and after HD in patients with DM was significantly worse than in pa-tients with other etiologies. Diabetes may be an important factor leading to reduced visual acuity because diabetes can cause and aggravate lens turbidity.
The central CT and endothelial number and form remained unchanged after HD, and the subgroup ana-lysis showed that CT during HD in the DM-KD sub-group was significantly greater than that in the other two subgroups. However, previous studies have found that the CT was significantly reduced [2, 5, 11, 13] or remained unchanged [12, 22] after HD; this pheno-menon is related to dehydration but is not correlated with DM. Our study differed in that we first used the Oculus Pentacam Anterior Segment Analyzer to meas-ure the CT, and we recorded the corneal vertex thick-ness (Pachy apex) as the central CT. We used this approach because the Pentacam measurement principle is based on using the point at the Pachy apex as a benchmark, and the remaining points are obtained relative to this point. The different conclusions between previous studies and our present study require further research.
HD failed to change the spherical and cylinder power in our study, as Çalişkan et al. [16] concluded. However, the HD procedure significantly changed the average lens thickness and density. We believe that the process of HD partially dehydrated lens so that after HD, the aver-age thickness of the lens decreased, and the relative density increased. Although the lens thickness change was highly significant, but the change was small, just about 2% in lens thickness. As mentioned above, the BCVA of the DM-KD subgroup was significantly worse than that of the other two subgroups. Therefore, in patients with CRF, particularly those with diabetic nephropathy, early screening and treatment for vision loss should be conducted.
Conclusions
In conclusion, renal failure patients undergoing HD may be at increased risk of developing vision-threatening com-plications, and both physicians of the hemodialysis unit and ophthalmologists should be made aware of this risk.
Abbreviations
ACD:Anterior chamber depth; AVG: Average cell size; BCVA: Best corrected visual acuity; CD: Endothelial cell density; CHT: Choroidal thickness; CSF: Central subfield; CT: Corneal thickness; CV: Cell size variation coefficient; DM: Diabetes mellitus; ESRD: End-stage renal disease; HD: Hemodialysis; IIM: Inferior inner macula; IOM: Inferior outer macula; IOP: Intraocular pressure; KD: Kidney disease; logMAR: Logarithmic minimum angle of resolution; LT: Lens thickness; NIM: Nasal inner macula; NOM: Nasal outer macula; RNFL: Retinal nerve fiber layer; SIM: Superior inner macula; SOM: Superior outer macula; TBUT: Tear break-up time; TIM: Temporal inner macula; TOM: Temporal outer macula
Acknowledgments
We would like to thank all the patients and personnel of the HD unit of Ruijin hospital affiliated with the Shanghai Jiao Tong University School of Medicine for their kind cooperation.
Funding
This work was supported by grant from Shanghai Hospital Development Center (SHDC12016116) Shanghai Key Laboratory of Visual Impairment and Restoration.
Availability of data and materials
The datasets used and/or analysed during the current study available from the corresponding author on reasonable request.
Authors’contributions
XS and HJC conceived and designed the study. HJC performed the experiments and wrote the paper. XS reviewed and edited the manuscript. XZ redid all the statistical calculations according to the reviewers’suggestions. All authors read and approved the manuscript.
Ethics approval and consent to participate
This study adhered to the Declaration of Helsinki and was approved by the institutional review board of Shanghai Ruijin Hospital. Informed consent were obtained from the subjects after verbal and written explanation of the nature and possible consequences of the study.
Consent for publication
Informed consent to publish was obtained from the participant from whom ocular photos were taken and introduced in this study.
Competing interests
The authors declare that they have no competing interests.
Publisher’s Note
Springer Nature remains neutral with regard to jurisdictional claims in published maps and institutional affiliations.
Author details
1Ruijin Hospital Affiliated to Shanghai Jiao Tong University School of
Medicine, No. 197 Rui Jin Er Road, Shanghai 200025, China.2Xinhua Hospital
Affiliated to Shanghai Jiao Tong University School of Medicine, No.1665 Kongjiang Road, Shanghai 200092, China.
Received: 6 November 2017 Accepted: 14 August 2018
References
1. National Kidney Foundation. K/DOQI clinical practice guidelines for chronic kidney disease: evaluation, classification, and stratification. Am J Kidney Dis. 2002;39:S1–266.
2. Jung JW, Yoon MH, Lee SW, Chin HS. Effect of hemodialysis (HD) on intraocular pressure, ocular surface, and macular change in patients with chronic renal failure. Effect of hemodialysis on the ophthalmologic findings. Graefes Arch Clin Exp Ophthalmol. 2013;251:153–62.
3. Ghasemi H, Afshar R, Zerafatjou N, Abdi S, Davati A, Askari MK, et al. Impact of hemodialysis on visual parameters in patients with end-stage renal disease. Iran J Kidney Dis. 2012;6:457–63.
5. Aktas Z, Ozdek S, Dinc UA, Akyurek N, Atalay V, Guz G, et al. Alterations in ocular surface and corneal thickness in relation to metabolic control in patients with chronic renal failure. Nephrology. 2007;12:380–5.
6. Mullaem G, Rosner MH. Ocular problems in the patient with end-stage renal disease. Semin Dial. 2012;25:403–7.
7. Tovbin D, Belfair N, Shapira S, Rosenthal G, Friger M, Feldman L, et al. High postdialysis urea rebound can predict intradialytic increase in intraocular pressure in dialysis patients with lowered intradialytic hemoconcentration. Nephron. 2002;90:181–7.
8. Nongpiur ME, Wong TY, Sabanayagam C, Lim SC, Tai ES, Aung T. Chronic kidney disease and intraocular pressure: the Singapore malay eye study. Ophthalmology. 2010;117:477–83.
9. Tokuyama T, Ikeda T, Sato K. Effect of plasma colloid osmotic pressure on intraocular pressure during haemodialysis. Br J Ophthalmol. 1998;82:751–3. 10. Pelit A, Zumrutdal A, Akova Y. The effect of hemodialysis on visual field test
in patients with chronic renal failure. Curr Eye Res. 2003;26:303–6. 11. Dinc UA, Ozdek S, Aktas Z, Guz G, Onol M. Changes in intraocular pressure,
and corneal and retinal nerve fiber layer thickness during hemodialysis. Int Ophthalmol. 2010;30:337–40.
12. Yang SJ, Han YH, Song GI, Lee CH, Sohn SW. Changes of choroidal thickness, intraocular pressure and other optical coherence tomographic parameters after haemodialysis. Clin Exp Optom. 2013;96:494–9. 13. Ulas F, Dogan U, Keles A, Ertilav M, Tekce H, Celebi S. Evaluation of
choroidal and retinal thickness measurements using optical coherence tomography in non-diabetic haemodialysis patients. Int Ophthalmol. 2013;33:533–9.
14. Meshi A, Goldenberg D, Armarnik S, Segal O, Geffen N. Systematic review of macular ganglion cell complex analysis using spectral domain optical coherence tomography for glaucoma assessment. World J Ophthalmol. 2015;5:86–98.
15. Aktas S, Sagdik HM, Aktas H, Gulcan E, Tetikoglu M, Cosgun S, et al. Tear function in patients with chronic renal failure undergoing hemodialysis. Ren Fail. 2015;37:245–8.
16. Caliskan S, Celikay O, Bicer T, Ayli MD, Gurdal C. Effect of hemodialysis on intraocular lens power calculation. Ren Fail. 2016;38:209–13.
17. Hu J, Bui KM, Patel KH, Kim H, Arruda JA, Wilensky JT, et al. Effect of hemodialysis on intraocular pressure and ocular perfusion pressure. JAMA Ophthalmol. 2013;131:1525–31.
18. Ishibazawa A, Nagaoka T, Minami Y, Kitahara M, Yamashita T, Yoshida A. Choroidal thickness evaluation before and after hemodialysis in patients with and without diabetes. Invest Ophthalmol Vis Sci. 2015;56:6534–41. 19. Jung JW, Chin HS, Lee DH, Yoon MH, Kim NR. Changes in subfoveal
choroidal thickness and choroidal extravascular density by spectral domain optical coherence tomography after haemodialysis: a pilot study. Br J Ophthalmol. 2014;98:207–12.
20. Yakut ZI, Karadag R, Akcay A, Bavbek N, Akay H, Koktener A. Effect of dialysis type on orbital vascular flow in patients with end-stage renal disease. Ren Fail. 2012;34:691–6.
21. Zhao HL, Qi XH, Shen W, Ye MX, Wu MQ. Investigation of changes in the biometric structure of the anterior chamber and intraocular pressure in patients with chronic renal failure after hemodialysis. Chin J Optom Ophthalmol Vis Sci. 2011;13:140–3.