Available online at http://ijdea.srbiau.ac.ir
Int. J. Data Envelopment Analysis (ISSN 2345-458X)
Vol.4, No.3, Year 2016 Article ID IJDEA-00422, 8 pages Research Article
Secondary Model Developed for Weight
Selective in Evaluating the Efficiency of
Cross-DEA with Fuzzy Data
Mohammad Reza Lotfi
aMohsen Rostamy-Malkhalifeh
b *(a,b)
Science and Research Branch, Islamic Azad University, Tehran, Iran.
Received March 15, 2016, Accepted June 26, 2106
Abstract
Data envelopment analysis (DEA )has been extended to cross -efficiency evaluation for ranking decision making units (DEA) and eliminating unrealistic weighting schemes.Unfortunately,the non-unique optimal weights problem in DEA has reduced the usefulness of this extended method.Aiming at solving this problem,we first incorporate a target idenification model to get reachable targets for all the DMUs. Then, several secondary goal models are proposed for wights selection considering both desirable and undesirable cross-efficiency targets of all the DMUs. Compared with the traditional secondary goal models, the cross-efficiency targets are improved in that all targets are always reachable for the DMUs. In addition, the proposed models considered the DMUs, willingness to get close to their desirable cross-efficiency targets and to avoid their undesirable cross-efficiency targets simultaneously while the traditional secondary goal models considered only the ideal targets of the DMUs. Since usually some detailed data are available, and they have to figure range. In this paper we extend this model and secondary goals so that is able to calculate the cross efficiency of these conditions.
Keywords: Data envelopment analysis, efficiency of cross-secondary goals, fuzzy data.
*. Emaile:[email protected]
1032
1. Introduction
DEA is a method to measure the relative efficiency of decision making units similar to the multiple inputs and outputs, and one of the effective ways is to identify the boundaries of performance. But flexibility in choosing the method dof input weight and outputs and the nature of their evaluation is criticized. Farrell (1957), based on the observations and principles governing the science DEA possible, set up a production possibility set (PPS) and part of it called the production function. Every DMUs that is on the border, efficient, and otherwise, is considered inefficient.
Charnes, Cooper and Rhodes (1978), based on the work of Farrell's creative method was inadequate, that decision became known to the evaluation DMUs, the base model and is based on data envelopment analysis (DEA). DEA is used various fields.For example in the industry of industrial R & D (Oral et al. 1991), the choice of technology (Banker and Tolar 1997) preference voting, (Green et al. 1996), the methods of game theory (Liang et al.2008), as well as examples in the field of sport used (Wu et al. 2008).based on the concept input and output weights are not unique, some autorance try to overcome this problem with various methods.
Dowel,green(1994)not only maximize the cross efficiency of DMUs but also mention secondary objectives for DMUs .Liang (et al.2008) they generalized the original concept of cross efficiency to the game cross efficiency which has been done by considering other cross efficiency DMUs.in this context the work can be Jahanshahlou et al(2011) also cited.
In this paper, given that in the real world may be inaccurate values, the extended version of "She" et al. (2016) with fuzzy data described above. Finally, a practical example to show the importance of the issue.
We have the following categories for the article. In the second part of the "he" et al. (2016) to introduce across efficiency. The third part of the secondary objectives, target recognition model in Part 4, Section 5 weight selected models and Section 6 weight selected models to expand this model with fuzzy data
described above. Finally, in Part 7 will bring a numerical example. Section 8 contains conclusions.
2. Cross Efficiency
Suppose n, decision making unit (DMU) that the use of m input (Xij), s output addressing. Secondary cross efficiency models to choose weight performance offered by Wi and colleagues (2016) as follows:
min −
,
s.t.
∑
=
∗∑
= 1
− + = 0
( ≠ , = 1, . . , )
− − = 0
( ≠ , = 1, . . , )
(1-2)
≥ = 1, … , , ≥ = 1, … ,
, ≥ 0 ( ≠ , = 1, . . , )
where in ∗ efficiency score CCR and sj1,sj2 respectively, By deviating from the purpose of favorable and unfavorable Cross efficiency. also , respectively, That the goals are favorable and unfavorable, The following models are obtained.
max/min = /
s.t.
∑
= 1
− ≥ 0
( ≠ , = 1, . . , )
(2-2)
∗ − = 0
≥ = 1, … , , ≥ = 1, … ,
Suppose
(v
∗, u
∗)
the optimal weight forDMU
are the optimal solution for Model (2-1). Cross-efficiency ofDMU
, using optimum weight ofDMU
as follows:∗ = ∑ u
∗
∑ v∗ = 1, … ,
In this case, the cross-efficiency matrix can be represented as follows:
1033
DMU 1 2 ……… n Average performance crossover
1 ∗ ∗ ……… ∗ 1 ∗
2 ∗ ∗ ……… ∗ 1 ∗
. . . . . . . . . . . . . . . . . .
n ∗ ∗ ……… ∗ 1 ∗
3. Model Secondary Objectives
CCR model is a linear model and is easily converted into a fuzzy model. Unfortunately, despite indicating equal ∑ = 1 in CCR model that allows input does not get fuzzy. Fuzzy because of any uncertainty factor would not consider equality constraints, fuzzy-building can not be considered inputs of CCR model. For this reason the model
∑
= 1
not suitable. In order to overcome the above problems CCR model is as follows.∑
−
∑
S.t.
∑
−
∑
≤ 0,
( = 1, … , )
(1-3)
∑
+ ∑
= 1
≥ , ≥where in and The efficiency achieved in order to and
(j=1,…,n) Using the CCR. In model (3) indicating the normal construction
∑
x
= 1
By indicating ∑ +∑ = 1 Has been replaced. Because constraints related to input and output is in the form of inequality. Defuzzification can be considered for both input and output. Can be easily found that the optimum solutions model (3.1) with the same CCR model. In other words, the weight of incoming and outgoing data results for Model (3-1) with CCR model are the same.
Then, according to the model (3-1) two target detection and selection of weight we introduced in the previous season.
4. Target Detection Models
Target detection model introduced in the previous chapter can be written in the form of the following equations.
max min
/
=
−
S.t.
∑
−
∑
≥ 0
− ≤ 0
− ≤ 0,
( = 1, … , )
(1-4)
+ = 1
≥ , = 1, … , ≥ , = 1, … ,
In the above model The amount of performance for , Which can be obtained by CCR model. Using the values
(4-1) ,, Will be achieved.
5. Select Models Weighing
1034
weight of the model based on cross-favorable and unfavorable performance goals
(mean) , Is, will be introduced.
min −
S.t.
∑
−
∑
≥ 0
− ≤ 0
− + ≥ ,
= 1, … , ; ≠
(1-5)
− − ≤ ,
= 1, … , ; ≠
≥ , = 1, … , ≥ , = 1, … ,
, ≥ , = 1, … , ; ≠
In the above model The amount of performance for CCR is obtained by the model. and Favorable and unfavorable to cross the performance goals for the 5-1 model is obtained by. sj1,sj2 By deviation from For the purposes of cross efficiency are favorable and unfavorable.
6. Secondary Objectives Fuzzy Model Here inputs and outputs in the form of triangular fuzzy numbers are considered, namely:
= , , , = , ,
Now secondary objectives with a view to developing models with fuzzy data described above. Fuzzy models for secondary objectives model (3.1) version follows.
=
∑
∑
S.t.
∑
− ∑
≤ 0,
( = 1, … , )
(1-6)
≥ , ≥
Fuzzy model (4-1) model are as follows:
max min
/
=
−
S.t.
∑
−
∑
≥ 0
− ≤ 0
− ≤ 0,
( = 1, … , )
(2-6)
+ = 1
≥ , = 1, … , ≥ , = 1, … ,
And finally the following phase model for optimal weight gain is:
min ̃ − ̃
S.t. ∑ − ∑ ≥ 0
∑
−
∑
≤ 0
(3-6)
− + ̃ ≥ ,
= 1, … , ; ≠
− − ̃ ≤ ,
= 1, … , ; ≠
≥ , = 1, … , ≥ , = 1, … ,
̃ , ̃ ≥ , = 1, … , ; ≠
Finally it will become to solve fuzzy models are deterministic models. To do this I used the following deterministic models.
=
∑
∑
S.t.
∑
− ∑
≤ 0,
( = 1, … , )
(4-6)
− − − ≤ 0,
1035
+ − + ≤ 0,
( = 1, … , )
≥ , ≥ 0
Fuzzy model( 4-1) model are as follows:
max min
/
=
+ 4 + 6 −
+ 4 + 6
S.t.
− ≥ 0
( − ) − ( − ) ≥ 0
+ − ( + ) ≥ 0
− ≤ 0
( − ) − ( − ) ≤ 0
+ − ( + ) ≤ 0
− ≤ 0, ( = 1, … , )
− − − ≤ 0,
( = 1, … , )
(5-6)
+ − + ≤ 0,
( = 1, … , )
+ = 1
≥ , = 1, … ,
≥ , = 1, … ,
And finally fuzzy model (3.3) model to obtain the optimal weights are as follows:
min
+ 4 +
6 −
+ 4 +
6
S.t.
∑
−
∑
≥ 0
( − ) − ( − ) ≥ 0
+ − ( + ) ≥ 0
∑
−
∑
≤ 0
(6-6)
( − ) − ( − ) ≤ 0
+ − ( + ) ≤ 0
− + ≥ ,
= 1, … , ; ≠
− − −
+ − ≥ , = 1, … , ; ≠
+ − +
+ + ≥ , = 1, … , ; ≠
− − ≤ ,
= 1, … , ; ≠
− − −
− − ≤ , = 1, … , ; ≠
∑ + − ∑ +
− + ≤ ,
= 1, … , ; ≠
≥ , = 1, … , ≥ , = 1, … ,
, , , , , ≥ ,
= 1, … , ; ≠
Now, after the implementation of model (6-4, 6-5) and (6-6) respectively Using the DMUj calculates the optimal weight and cross efficiency is as follows DMUd optimal weights
∗ =
∑ u∗ + 4 +
6
∑ v∗ + 4 +
6
1036
7. Case Study
This model presented in this thesis for 5 Department of the University to go by. The fifth group includes two input costs and quality team members (phase input) output are
as well as two sets of total Group revenues and feedback Scientific Group (fuzzy output). Because the input and output phase, we must use the models presented in this thesis. The data in Table (7-1) given below.
Table 7-1: Data on 5 Department
educational group Inputs
Outputs
Input 1 Input 2
Output 1 Output 2
1 144
(85/9. 90/8. 8) 6/75
(10. 57/8. 14/7)
2 210
(65/9.70/8. 75/7) 7/60
(86/8. 58/7. 29/6)
3 132
(820/9. 08/9. 35/8) 40
(25/7. 48/5. 71/3)
4 96
(73/9. 06/9. 39/8) 28
(85/1. 41/1. 96/0)
5 138
(82/9. 21/9. 61/8) 2/34
(40/9. 03/8. 67/6)
Note that data for the implementation should use triangular fuzzy numbers. 1 input and 1 output data are definitive. To convert this number to any number of fuzzy triangular fuzzy numbers in order to implement certain models we have become fuzzy. For this
example, for a certain number 144 of the fuzzy number (144.144.144) will use.
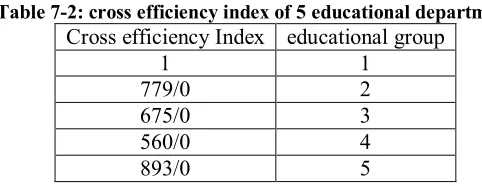
Now, after the implementation of the model 6-4, 6-5 and 6-6 also calculates the cross efficiency matrix and means columns the index of cross efficiency of these five educated department as shown in table (7-2).
Table 7-2: cross efficiency index of 5 educational department
educational group Cross efficiency Index
1 1
2 779/0
3 675/0
4 560/0
5 893/0
Note that in this way a ranking without interference to evaluate educational departments provided.
8. Conclusion
1037
Reference
Sexton, T.R., Silkman, R.H., Hogan, A.J., (1986). Data envelopment analysis: Critique and extensions. In: Silkman, R.H. (Ed.), Measuring Efficiency: An Assessment of Data Envelopment Analysis, vol. 32. Jossey-Bass, San Francisco, pp. 73–105.
Wu, J., Chu, J., Sun, J., Zhu, Q., Liang, .L. (2016). Extended secondary goal models for weights selection in DEA cross efficiency evaluation.
http://dx.doi.org/10.1016/j.cie.2015.12.019