Dlx1/2 mice have abnormal enteric nervous
system function
Christina M. Wright, … , Beth A. Maguire, Robert O.
Heuckeroth
JCI Insight.
2020;
5(4)
:e131494.
https://doi.org/10.1172/jci.insight.131494
.
Decades ago, investigators reported that mice lacking DLX1 and DLX2, transcription factors
expressed in the enteric nervous system (ENS), die with possible bowel motility problems.
These problems were never fully elucidated. We found that mice lacking DLX1 and DLX2
(
Dlx1/2
–/–mice) had slower small bowel transit and reduced or absent neurally mediated
contraction complexes. In contrast, small bowel motility seemed normal in adult mice
lacking DLX1 (
Dlx1
–/–). Even with detailed anatomic studies, we found no defects in ENS
precursor migration, or neuronal and glial density in
Dlx1/2
–/–or
Dlx1
–/–mice. However,
RNA sequencing of
Dlx1/2
–/–ENS revealed dysregulation of many genes, including
vasoactive intestinal peptide (
Vip
). Using immunohistochemistry and reporter mice, we then
found that
Dlx1/2
–/–mice have reduced VIP expression and fewer VIP-lineage neurons in
their ENS. Our study reveals what we believe is a novel connection between
Dlx
genes and
Vip
and highlights the observation that dangerous bowel motility problems can occur in the
absence of easily identifiable ENS structural defects. These findings may be relevant for
disorders like chronic intestinal pseudo-obstruction (CIPO) syndrome.
Research Article
Development
Neuroscience
Find the latest version:
Conflict of interest: The authors declare that no conflict of interest exists.
Copyright: © 2020, American Society for Clinical Investigation.
Submitted: July 8, 2019
Accepted: January 22, 2020
Published: February 27, 2020.
Reference information:JCI Insight. 2020;5(4):e131494.
https://doi.org/10.1172/jci. insight.131494.
Dlx1/2 mice have abnormal enteric
nervous system function
Christina M. Wright,1,3 James P. Garifallou,2,3 Sabine Schneider,1,3 Heather L. Mentch,1,3 Deepika R. Kothakapa,1,3 Beth A. Maguire,1,3 and Robert O. Heuckeroth1,3
1Department of Pediatrics, 2Center for Applied Genomics, and 3Leonard and Madlyn Abramson Pediatric Research
Center, Children’s Hospital of Philadelphia Research Institute and the Perelman School of Medicine at the University of Pennsylvania, Philadelphia, Pennsylvania, USA.
Introduction
Chronic intestinal pseudo-obstruction (CIPO) is a serious digestive disorder characterized by profound bow-el motility defects, leading to severe constipation, abdominal distention, and life-threatening malnutrition requiring total parenteral nutrition (TPN). Although rare, CIPO is a leading cause of intestinal failure (1), accounting for approximately 10% to 14% of small intestine (SI) transplants (2). Many CIPO cases are believed to be caused by defects in the enteric nervous system (ENS), a complex network of neurons and glia within the bowel wall (3). The ENS develops from enteric neural crest–derived cells (ENCDCs) that migrate through the bowel during fetal development (4). ENCDCs give rise to diverse neuronal and glial subtypes that control nutrient absorption, epithelial secretion, intestinal mixing, and (critically) transport of contents down the bowel (5). In neuropathic CIPO, neurons and glia are present, but damaged or dysfunctional, leading to dysmotility. Neuronal dysfunction in CIPO has many etiologies, including infection, autoimmune disease, neurodegeneration, and gene mutations (1, 6). Genetic causes of CIPO are poorly understood. Although genes like SOX10 and POLG have been linked to neuropathic CIPO (7, 8), we believe many CIPO-linked genes remain to be discovered (9). Here, we examine the role of Dlx1 and Dlx2, two transcription fac-tors expressed in developing ENS. We discovered that loss of these genes in mice causes profound intestinal dysmotility despite nearly normal ENS anatomy.
Dlx1 and Dlx2 are highly conserved homeobox transcription factors located in a tail-to-tail
configu-ration on mouse chromosome 2. They are essential for craniofacial, palate (10), tooth (11), and central nervous system (CNS) morphogenesis (10, 12–14). In the CNS, Dlx1 and Dlx2 are critical for subpallial interneuron differentiation and migration into the cortex and olfactory bulb (13). Dlx1–/– and Dlx2–/–
mice exhibit milder defects than Dlx1/2 double mutants, implying functional redundancy for DLX1 and DLX2 in some developmental contexts (14).
Dlx1 and Dlx2 were hypothesized to be important for ENS development over 20 years ago, but their role
in the ENS was never carefully evaluated. Dlx2–/– mice die as neonates with massive proximal bowel
dis-tention attributed to abnormal motility (10). Unsurprisingly, Dlx1/2–/– mice have a similar phenotype due
to a deletion encompassing Dlx1, Dlx2, and intergenic regions. In contrast, Dlx1–/– mice on some genetic Decades ago, investigators reported that mice lacking DLX1 and DLX2, transcription factors
expressed in the enteric nervous system (ENS), die with possible bowel motility problems. These problems were never fully elucidated. We found that mice lacking DLX1 and DLX2 (Dlx1/2–/–
mice) had slower small bowel transit and reduced or absent neurally mediated contraction complexes. In contrast, small bowel motility seemed normal in adult mice lacking DLX1 (Dlx1–/–).
Even with detailed anatomic studies, we found no defects in ENS precursor migration, or neuronal and glial density in Dlx1/2–/– or Dlx1–/–mice. However, RNA sequencing of Dlx1/2–/– ENS
revealed dysregulation of many genes, including vasoactive intestinal peptide (Vip). Using immunohistochemistry and reporter mice, we then found that Dlx1/2–/– mice have reduced VIP
R E S E A R C H A R T I C L E
backgrounds were reported to die by 1 month of age (14, 15), a time frame similar to mouse models with defined enteric neuropathies (12, 16). Consistent with the hypothesis that Dlx1 and Dlx2 mutations affect ENS function or development, both genes are expressed in developing ENS at ages when ENCDCs are migrating, proliferating, and differentiating into neurons and glia, including embryonic day 12.5 (E12.5) (10, 17), E14.5 (18, 19), E17.5 (20), and postnatal day 0 (P0) (18). Further supporting a role in ENS devel-opment, Dlx2 enhances expression of the transcription factor Zfhx1b (also called SIP1 and Zeb2) in the CNS (21), and ZFHX1B mutations can cause Hirschsprung disease (a problem where distal bowel lacks ENS) (22, 23). Given compelling evidence implicating DLX1 and DLX2 in ENS development, we were surprised to find no studies thoroughly characterizing the ENS in mice lacking these proteins.
To evaluate DLX1 and DLX2’s role in ENS development, we analyzed bowel structure and function in
Dlx1/2–/– mice, which die at P0, and Dlx1–/– mice, which survive to adulthood in our colony. We observed
serious bowel function defects in Dlx1/2–/– mice at P0, including slower transit and absence of neurally
mediated contractions. Given the critical role of DLX1 and DLX2 in CNS interneuron migration, we initially hypothesized that ENS precursor migration might also be defective in Dlx1/2–/– mice, causing
Hirschsprung-like disease (absent distal ENS) that explained dysfunctional bowel. To our surprise, ENCDC migration, neuronal and glial density, and ratios of neuronal subtypes were normal in Dlx1/2–/– mice. To
define mechanisms causing defective bowel function, we performed RNA sequencing (RNA-seq) on E14.5 and P0 Dlx1/2+/+ and Dlx1/2–/– ENCDCs. We identified dysregulation of many genes, including reduced
expression of the neurotransmitter vasoactive intestinal peptide (Vip). We discovered fewer VIP-lineage neurons and reduced neuronal VIP expression in Dlx1/2–/– ENS, which may explain the functional defects
in Dlx1/2–/– mice. To our knowledge, this study is the first linking Dlx genes to Vip expression.
Results
Dlx1/2–/– and Dlx2–/– mice die as neonates with massive abdominal distention due to intestinal gas accumulation.
To evaluate the role of Dlx1 and Dlx2 in bowel development, we bred to generate Dlx1–/–, Dlx2–/–, and
Dlx1/2–/– mice. The Dlx1/2–/– mice appeared ill as neonates, lacked a milk spot, and died within 24 hours
of birth with massive abdominal distention (Figure 1, A–D). Dlx2–/– mice also died early with a phenotype
similar to that of Dlx1/2–/– mice, but survival was not tracked as closely; Dlx2–/– mice were never recovered
at weaning (P30). Gross anatomic analysis demonstrated marked accumulation of gas within the proximal SI (Figure 1, E and F). In contrast, Dlx1–/–, Dlx2+/–, Dlx1/2+/–, and wild-type (WT) mice appeared healthy
as neonates. Furthermore, although Dlx1–/– mice were previously reported to grow slowly and die by 1
month of age (12), we did not observe excess perinatal death of our Dlx1–/– mice (Figure 1G) despite a
slow growth trajectory (Figure 1, H and I). We note that our Dlx1–/– mice have CreERT2 inserted into the
initiation codon, while Qiu et al. (12) deleted Dlx1 exons 2 and 3. Furthermore, our mice differed in strain background and mouse colony, which may account for survival differences. To test if Dlx1–/– mice had
poor bowel motility, which can cause slow growth, we gavage-fed 37-day-old Dlx1–/– mice with
fluoresce-in isothiocyanate–dextran (FITC-dextran) and evaluated transit through the bowel lumen. FITC-dextran is poorly absorbed across bowel epithelium, and transit of FITC-dextran through the bowel lumen is a well-established method to assess motility (20, 24). We observed no delays in SI transit (Figure 1, J and K). To assess colon motility, we inserted a glass bead into the distal colon of adult Dlx1–/– and WT mice and
timed bead expulsion. We observed a delay in distal colon bead expulsion consistent with dysmotility that did not impact survival (Figure 1L).
We noted that Dlx2–/– and Dlx1/2–/– mice have cleft palate, as previously reported (10, 12, 25), and that this
might cause poor feeding and air swallowing, but the marked accumulation of air in the proximal SI suggested that bowel dysmotility slows gas transit. We decided to focus analyses on Dlx1/2–/– mice that lack both DLX1
and DLX2 proteins because some functional redundancy has been reported for Dlx1 and Dlx2 in the CNS.
Dlx1/2–/– mice have bowel dysmotility. To determine if bowel dysmotility at P0 contributes to bowel
disten-sion in Dlx1/2–/– mice, we fed neonatal mice FITC-dextran and evaluated transit through the bowel lumen. To
ensure conditions for testing were as similar as possible between genotypes, we delivered mice by Cesarean section at E19.5 (the usual day of delivery). Cesarean delivery prevented WT and Dlx1/2+/– from feeding and
fluorescence intensity was measured for defined bowel regions. In WT and Dlx1/2+/– mice, most FITC-dextran
reached mid-SI after 3 hours. In contrast, Dlx1/2–/– mutants retained most FITC-dextran in their stomach, with
small amounts in the proximal SI (Figure 2A). A weighted average of fluorescence intensity (i.e., geometric mean) confirmed significant delays in bowel intraluminal transit for newborn Dlx1/2–/– mutant mice (Figure
2B), suggesting abnormal SI motility.
Despite our attempts to control for the presence of bowel air, many Dlx1/2–/– mice accumulated air in
their bowel during the assay. Intriguingly, a subset of Dlx1/2+/– heterozygotes also spontaneously
accumu-lated air in their GI tracts in the absence of cleft palate. Compared with these Dlx1/2 heterozygotes with intraluminal air, Dlx1/2–/– mice still had significantly slower FITC-dextran transit (Figure 2C; P < 0.05),
confirming poor gut motility in Dlx1/2–/– mutant mice.
One possibility was that delayed FITC-dextran transit in Dlx1/2–/– mice could reflect poor health of the
Dlx1/2–/– neonates (i.e., ileus as a result of systemic illness). In fact, Dlx1/2–/– mice showed signs of poor
health and 4 Dlx1/2–/– pups died during the experiment. We excluded these animals and an additional 2 pups
from our analysis due to lack of activity after the 3-hour study was complete. Dlx1/2–/– pups included in the
experiment were more likely to be pale appearing and exhibited fewer movements in the first few hours of life (Supplemental Figure 1, A and B; supplemental material available online with this article; https://doi. org/10.1172/jci.insight.131494DS1). These concerns prompted us to perform an in vitro motility assay to complement our in vivo studies. We again treated dams with progesterone and delivered pups via Cesarean
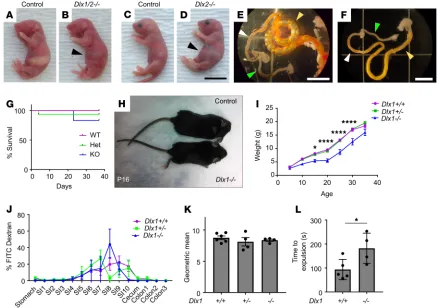
Figure 1. Dlx1/2–/–and Dlx2–/–mice have obvious abdominal distention at P0 due to bowel air accumulation, while Dlx1–/– mice exhibit poor weight gain
but normal small intestine (SI) transit. (A–D) Dlx1/2–/– (B) and Dlx2–/– (D) mice exhibited dramatic bowel distention (black arrowhead) compared to WT
litter-mates (A and C). Scale bar: 1 cm. (E) Bowel of Dlx2–/– mouse viewed under dissecting microscope. Note air-filled proximal SI (yellow arrowhead) with absence
of air in distal SI (white arrowhead) and colon (green arrowhead). Scale bar: 5 mm. (F) Control bowel for comparison. Scale bar: 5 mm. (G) Kaplan-Meier curve indicates most Dlx1–/– mice survived past 1 month of age (P = 0.4665; log-rank Mantel-Cox; n = 9 [+/+], 16 [+/–], 6 [–/–]). (H and I) Dlx1–/–mice were small
and weighed significantly less than their WT littermates at P15 (P = 0.0433), P20 (P < 0.0001), P25 (P < 0.0001), and P30 (P < 0.0001); n = 9 [+/+], 14 [+/–], and 5 [–/–]; 2-way repeated-measures ANOVA. We include only mice that lived to P35. (J) Percentage FITC-dextran in distinct bowel regions 1 hour after oral FITC-dextran administration. SI1 to SI10 indicate sequential SI segments. (K) Weighted average of FITC bowel transit showed normal SI transit times in Dlx1–/– mice (P = 0.5182; 1-way ANOVA, n = 6 [+/+], 4 [+/–], and 4 [–/–]). (L) Dlx1–/–mice had slight delays in expulsion of a glass bead from distal colon
R E S E A R C H A R T I C L E
section to control for food and air in the bowel. The bowel was carefully removed from neonates shortly after delivery and was placed in warmed, oxygenated Krebs-Ringers solution in a continuously perfusing organ bath. The SI was cannulated at the proximal end and perfused with oxygenated Krebs-Ringers using an oral pressure of 1.3 cm H2O above the bowel lumen. Videos of bowel contractions were recorded in the presence or absence of tetrodotoxin (TTX) (see Supplemental Videos 1 and 2 for representative videos). Videos were converted to spatiotemporal maps or kymographs depicting bowel width (color axis) over time (y axis) for the first 2 cm of SI (Figure 2, D–G). In control bowel, we observed low-frequency (~0.4/
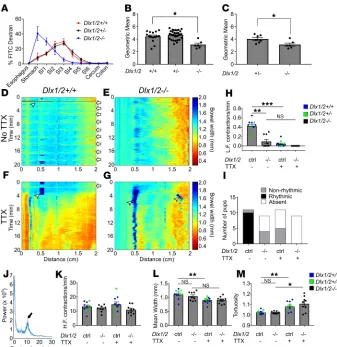
Figure 2. Dlx1/2–/– mice have abnormal bowel motility. (A) Percentage FITC-dextran in distinct bowel regions 3 hours after oral FITC administration. SI1 to SI6 indicate sequential small intestine (SI) segments. (B) Weighted average of FITC bowel transit, represented by geometric mean, shows significant delays in transit for P0 Dlx1/2–/– mice, but not
for heterozygous Dlx1/2+/– mice (P = 0.0188; Kruskall-Wallis with Dunn’s multiple-comparisons test; n = 15 [+/+], 33
[+/–], 6 [–/–]). (C) A subset of heterozygotes spontaneously accumulated bowel air, but transit in Dlx1/2–/– mutants
was still slower than in Dlx1/2+/– mice. (P = 0.0228; Student’s t test; n = 7 [+/–], n = 6 [–/–]). (D–G) Representative
kymographs depicting bowel width (color axis) over time (y axis) at specific distances along the SI (x axis) in control and
Dlx1/2–/– bowels in the absence (D and E) or presence (F and G) of tetrodotoxin (TTX). White arrows indicate contraction
complexes in control mice, but similar contraction complexes could not be identified in Dlx1/2–/– bowel; white
arrow-heads indicate artifacts such as air bubbles on the surface of bowel. (H) Dlx1/2–/– mice had fewer low-frequency (L.F.)
contraction complexes than controls (P = 0.0055; Kruskal-Wallis with Dunn’s multiple-comparisons test; n = 10 [ctrl],
n = 9 [–/–]). (I) Low-frequency contraction complexes generally occurred in rhythmic patterns in controls but not in mutants. (J) Representative Fourier plot from control mouse, with black arrow highlighting peak contraction frequency for TTX-insensitive contractions; note that contraction frequency for neurally mediated contractions is too low to be reliably identified on the Fourier graph. (K) High-frequency (H.F.) TTX-insensitive contractions occurred at normal rates in Dlx1/2–/– mice (P = 0.181; 1-way ANOVA; n = 10 [ctrl], n = 9 [–/–]). (L and M) In controls, average bowel width decreased
minute) and high-frequency (6–18/minute) contractions, as has been previously described in neonatal mice (26). The low-frequency contraction complexes that typically occurred at regular intervals (i.e., rhythmi-cally) in control mice were abrogated by TTX (Figure 2H), indicating neuronal origin. The Dlx1/2–/– mice
had many fewer low-frequency contraction complexes than controls (P = 0.0055; Figure 2H) and none of the contraction complexes in Dlx1/2–/– mouse SI occurred in a rhythmic pattern (Figure 2I). This analysis
confirmed that neurally mediated motility patterns are abnormal in the SI of Dlx1/2–/– mice.
Unlike low-frequency contractions, high-frequency contractions were present and appeared similar in control (Dlx1/2+/+ and Dlx1/2+/–) and Dlx1/2–/– SI. These more frequent contractions are probably
mediat-ed by interstitial cells of Cajal or smooth muscle since they are TTX insensitive (26). Furthermore, Fourier transform analysis of the frequency of these faster contractions (Figure 2J) as described previously (26) showed no difference between control and Dlx1/2–/– mutant bowel (Figure 2K), consistent with a
neuro-pathic origin of Dlx1/2–/– bowel dysmotility.
We next tested if the SI in Dlx1/2–/– mice was tonically contracted or dilated, problems that might
suggest an imbalance in excitatory or inhibitory motor neuron signaling and could slow bowel intralumi-nal transit. Our aintralumi-nalysis showed that Dlx1/2–/– bowel was neither more dilated nor more contracted than
control bowel (Figure 2L). Baseline tortuosity (measured as length of pinned bowel divided by Euclidean distance from end to end in randomly selected video frames) was also no different in Dlx1/2–/– bowel
(Fig-ure 2M). Control bowel became more contracted and tortuous on expos(Fig-ure to TTX (Fig(Fig-ure 2, L and M), suggesting that neural activity is necessary for baseline bowel relaxation in P0 SI. Dlx1/2–/– bowel did not
become significantly more contracted in the presence of TTX (P = 0.1423), but became more tortuous with TTX application (P = 0.0276), consistent with a distinct pattern of neuromodulation in Dlx1/2–/– mutant
bowel (Figure 2, L and M). Collectively, these in vitro and in vivo data suggest that bowel motility is pro-foundly abnormal in Dlx1/2–/– mice and that dysmotility is due to defects in neuronal activity.
Dlx1 and Dlx2 are not necessary for bowel colonization by ENCDCs during fetal development. Because bowel
motil-ity was abnormal in Dlx1/2–/– mice, we tested the hypothesis that DLX1 and DLX2 influence colonization of
the bowel by ENCDCs during fetal development. We analyzed bowel at E12.5 when ENCDCs have normally colonized the entire SI and half of the colon. The extent of ENS precursor migration was assessed using an antibody against neuron-specific class III β-tubulin (TuJ1), which is expressed at high levels in enteric neurons, including at the migration wavefront (27, 28). By this criterion, E12.5 Dlx1/2–/– mice had normal colonization
by ENCDCs (Figure 3, A–C). In contrast, Dlx2–/– mice had a small reduction in bowel colonization by
ENC-DCs of dubious functional significance and marginal statistical significance (66.5% ± 1.5% colonized [+/+] vs. 47.4% ± 5.2% colonized [–/–]; P = 0.0499; Figure 3, E–G), perhaps reflecting a relatively protective CD1 strain background for Dlx1/2 compared with the aganglionosis-promoting C57BL/6J strain background (29) for
Dlx2–/– mice. Because some gene defects are only apparent with a sensitized genetic background (30), we next
evaluated bowel colonization by Dlx1/2–/– ENCDCs in the context of Ret heterozygosity. Dlx1/2–/– Ret+/– mice
on a mixed CD1 × C57BL6/J background had apparently normal colonization of the bowel by ENCDCs
(Figure 3, I–K). Colon length was also normal in all mutant mice (Figure 3, D, H, and L). These observations suggest that bowel dysmotility in Dlx1/2–/– mice is not due to abnormal bowel colonization by ENCDCs.
To determine if Dlx1/2–/– mice have major ENS structural defects causing dysmotility, we dissected mutant
mice just after birth (P0) and stained bowel whole mounts with antibodies against the neuronal RNA-bind-ing protein HuC/D (ANNA-1), TuJ1, SOX10 (which is present in ENS precursors and mature glia), and the glia-specific marker S100β. There were no obvious differences in ENS organization or staining patterns between Dlx1/2+/+ and Dlx1/2–/– mice. TuJ1 staining showed normal organization of nerve fibers.
Quantita-tive analysis of HuC/D staining demonstrated normal neuronal density in proximal SI, distal SI, and colon of P0 Dlx1/2–/– mice (Figure 4, A–O). For SI, we assessed neuronal density in both myenteric and submucosal
plexus, but due to difficulty separating muscle from submucosa in neonatal mice, we were only able to assess total neuronal density (myenteric plexus + submucosal plexus) in colon. P0 Dlx1/2–/– mice also had normal
SOX10+ cell density and SOX10+S100β+ glial density in bowel regions examined (Figure 4, P–W).
Because neuron death occurs in subsets of CNS neurons in Dlx1–/– mice postnatally (15), and
because we observed slightly delayed colon motility, we assessed neuronal numbers in 10-week-old
Dlx1–/– mice, which lack cleft palate and survive to adulthood. We found no differences in neuronal
density in proximal SI, distal SI, mid-colon, or distal colon in Dlx1–/– adults in either myenteric or
sub-mucosal plexus (Figure 5, A–X). We also found no difference in SOX10+ glia and ENS precursors in
R E S E A R C H A R T I C L E
No defects in ENS subtype ratios were detected in Dlx1/2–/– and Dlx1–/– mice. The ENS has over 20
neuronal subtypes that perform distinct functions (31). Because total neuron numbers are normal in
Dlx1/2–/– mice, but bowel motility is abnormal, we hypothesized that DLX1 and DLX2 might be
required for differentiation or survival of 1 or more neuronal subtypes, leading to dysmotility in
Dlx1/2–/– mice. To test this hypothesis, we stained P0 bowel with antibodies that distinguish many
types of enteric neuron. We observed no differences in ratios of neurons expressing myenteric plexus neurotransmitter markers nitric oxide synthase (NOS), calretinin, γ-aminobutyric acid (GABA), or VIP (Figure 6, A–E, G–K, and M–Q) or the submucosal plexus neurotransmitter VIP (Figure 6, F, L, and R). Because we lacked reliable antibodies for choline acetyl-transferase (ChAT), we bred and analyzed Dlx1/2 ChAT-EGFP-L10a mice but found no difference in EGFP+ neuron number (Figure 6,
A, G, and M, and Supplemental Figure 2, A–N). One technical issue is that the fluorescence intensity of immunohistochemical signals for certain neurotransmitters at P0 (substance P, tyrosine hydroxy-lase) was quite low (Supplemental Figure 3, A–D). We suspect this reflects incomplete differentiation of these subtypes at P0, because immunostaining in adult mouse ENS was excellent for all antibodies used (Supplemental Figure 3, E–J). Despite substantial effort, we were unable to identify neuronal populations that were dramatically altered at an anatomic level to explain the severe intestinal dysmo-tility in neonatal Dlx1/2–/– mice.
In Dlx1–/– mice, we evaluated ENS in adult bowel because the somatosensory cortex of the CNS has
normal neuronal numbers at birth, but postnatal apoptosis occurs in several cortical neuron subtypes, including GAD67+ (which catalyzes GABA synthesis from glutamate), NOS+, somatostatin+, and
calreti-nin+ neurons (15). Taking advantage of postnatal survival in Dlx1–/– mice, we determined if similar age-dependent
neuronal subtype loss occurs in the Dlx1–/– ENS by staining adult Dlx1–/– distal SI with antibodies marking
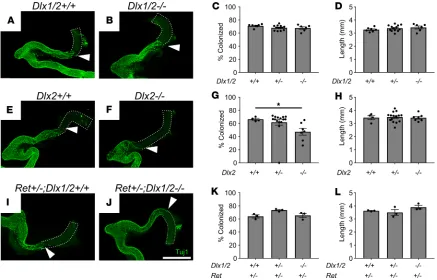
Figure 3. Dlx1/2–/–, Dlx2–/–, and Ret+/– Dlx1/2–/–mice have normal bowel colonization rates by ENCDCs or minimal defects at E12.5. (A and B) Confocal
Z-stacks of WT (A) and Dlx1/2–/– (B) E12.5 bowel stained with TuJ1 antibody that labels early and mature neurons (green). Maximum intensity projections
are shown. White triangles mark distal-most TuJ1+ neuron processes. Scale bar: 1 mm. (C and D) Percentage hindgut colonized relative to total colon length (C; 1-way ANOVA, n = 7 [+/+], n = 13 [+/–], n = 6 [–/–]) and colon length (D; 1-way ANOVA, n = 7 [+/+], n = 13 [+/–], n = 6 [–/–]) were normal in Dlx1/2–/–
mutants. (E–H) Representative WT (E) and Dlx2–/– (F) E12.5 bowel labeled with TuJ1 antibody. Dlx2–/– mice had a slight delay (66.5 ± 1.5% colonized [+/+]
vs. 47.4 ± 5.2% colonized [–/–]) in ENS migration of unknown functional significance (G; P =0.0499; Kruskal-Wallis test with Dunn’s multiple-comparisons test, n = 4 [+/+], n = 15 [+/–], n = 7 [–/–]) and normal colon length (H). (I–L) Representative Ret+/–Dlx1/2+/+ (I) and Ret+/–Dlx1/2–/– (J) E12.5 bowel labeled
with TuJ1 antibody. Dlx1/2–/–mice on a Ret-heterozygous background had normal extent of bowel colonization (I; 1-way ANOVA, n = 3 per genotype) and
NOS, GABA, somatostatin, and VIP. Neuronal subtype ratios were similar in WT and Dlx1–/– mice (Figure
6, S–DD), suggesting that postnatal enteric neuron loss is not occurring.
Vip is dysregulated in E14.5 and P0 Dlx1/2–/– ENCDCs. Because our detailed anatomic analyses failed
to reveal obvious structural problems of the ENS of Dlx1/2–/– mice, we next hypothesized that
dysmo-tility in Dlx1/2–/– mice is due to altered gene expression not discernable at the level of ENS anatomy.
We tested this hypothesis by RNA-seq of pooled ENCDCs isolated from E14.5 and P0 bowel using fluorescence-activated cell sorting (FACS). We chose these ages for theoretical and technical reasons. E14.5 was selected because Dlx1 and Dlx2 are expressed in murine ENS by E12.5 (10, 17), and we wanted to evaluate early effects of mutations, rather than secondary effects that occur as development proceeds. Furthermore, at E14.5 there are many ENCDCs for analysis, and neuronal subtype markers are starting to appear as enteric neural networks are established. We also analyzed P0 ENS to match our
Figure 4. Dlx1/2–/–mice have normal density of neurons, SOX10+ cells, and glia at P0. (A–J) Representative imag-es of Dlx1/2+/+and Dlx1/2–/– bowel immunostained for HuC/D (magenta) and TuJ1 (green). MP, myenteric plexus; SP,
submucosal plexus. (K–O) Quantification of neurons in A–J shows no difference between neuronal number in control or mutant mice (Student’s t test; n = 3–4 per condition). (P–S) Representative images of Dlx1/2+/+and Dlx1/2–/– bowel
R E S E A R C H A R T I C L E
functional experiments performed using neonatal bowel. For our E14.5 analysis, we bred Dlx1/2 mice to an Ednrb-L10A-GFP reporter line that expresses a fluorescent protein in ENCDCs at E14.5 (32) and performed RNA-seq on FACS-isolated ENCDCs from E14.5 Dlx1/2–/– Ednrb-L10A-GFPGfp/wt (mutant)
and Dlx1/2+/+ Ednrb-L10A-GFPGfp/wt (WT) SI. To analyze P0 bowel, we bred Dlx1/2 mice to a Wnt1-Cre
R26R-Tdtomato line and performed RNA-seq on FACS-isolated ENS from P0 Dlx1/2–/– Wnt1-Crecre/wt
R26R-Tdtomato+ (mutant) and Dlx1/2+/+ Wnt1-Crecre/wt R26R-Tdtomato+ (WT) SI.
We identified 22 dysregulated genes in Dlx1/2–/– E14.5 ENCDCs using q less than 0.1 as a statistical
threshold after filtering out genes with low expression (average expression < 1) and fold change (|log2 fold change| < 1; Figure 7, A and B). Given that DLX2 regulates Zfhx1b in the CNS, we had hypothe-sized that Zfhx1b might be dysregulated in the Dlx1/2–/– ENS, but we found no evidence of altered Zfhx1b
levels. Remarkably, however, we observed approximately 84% reduction in mRNA levels for the ENS
Figure 5. Dlx1–/– adults have normal neuronal and glial numbers. (A–X) Representative images and quantifications of adult Dlx1–/– mouse proximal small intestine (SI), distal SI, mid-colon, and distal colon immunostained using HuC/D
(magenta) and TuJ1 (green) antibodies. Myenteric plexus (A–H) and submucosal plexus (M–T) are shown. Neuronal density was normal in Dlx1–/– mice for all bowel regions analyzed (I–L, U–X; Student’s t test; n ≥ 3 per condition). (Y and
Z) Adult Dlx1–/– distal SI was immunostained using an antibody against SOX10, which exclusively labels glia in adults
(red). (AA) Quantitative analysis of glial density shows no difference in glial cell density in distal SI of Dlx1–/–mice or WT
neurotransmitter Vip and a 3-fold increase in abundance of mRNA for the neurotransmitter proenkeph-alin (Penk) in SI ENCDCs from Dlx1/2–/– mice compared with WT animals. We also observed changes in
receptors (Lifr), extracellular matrix genes (Mmp2, Col3a1), cytoskeletal regulators (Dnm3, Capn6, Fmn1), neurite growth factors (Ptn), and glia-associated genes (Plp1, Lrp1b) (Figure 7B). Because neurotrans-mitter dysregulation might most directly explain bowel dysmotility in Dlx1/2–/– mice, we attempted to
validate altered levels of Vip and Penk mRNA using quantitative real-time polymerase chain reaction (qRT-PCR) on independently isolated E14.5 mutant and control samples (Figure 7, C and D; see Sup-plemental Figure 4 for standard curves). qRT-PCR analyses showed 3-fold reduction in Vip mRNA in E14.5 Dlx1/2–/– ENCDCs compared with WT (1.0 ± 0.11 [+/+] vs. 0.36 ± 0.10 [–/–], P = 0.004) and
no statistical difference in Penk mRNA (1.0 ± 0.02 [+/+] vs. 1.34 ± 0.17 [–/–], P = 0.063). Although we identified fewer dysregulated genes at P0, our RNA-seq data suggest Vip continues to be dysregulated in
Dlx1/2–/– neonatal ENS (Figure 7, E and F).
To further explore the VIP-expressing enteric neuronal subpopulations, we bred to generate Dlx1/2
Vip-IRES-Cre R26R-TdTomato mice, which produce TdTomato in cells expressing Vip. Although we had
already counted VIP-immunoreactive enteric neurons, VIP is primarily in neurites, making cell counting suboptimal. We discovered that TdTomato+ neurons in the mid-SI are significantly reduced in absolute
Figure 6. Dlx1/2–/– P0 and Dlx1–/– adultmice have normal ratios of neuronal subtypes. (A–L) Representative images of HuC/D (red), nNOS (blue), and
ChAT-EGFP (green; A and G), HuC/D (magenta) and NADPH-diaphorase (green; B and H), HuC/D (magenta) and calretinin (green; C and I), HuC/D (magenta) and GABA (green; D and J), HuC/D (magenta) and VIP (green; E, F, K, and L) immunostaining in P0 control and P0 Dlx1/2–/– bowel. SP, submucosal plexus; MP,
myenteric plexus. (M–R) We observed no difference in ratios of myenteric ChAT-EGFP or nNOS+ (M), myenteric NADPH+ (N), calretinin+ (O), GABA+ (P), VIP+ (Q), or submucosal VIP+ (R) neurons to total HuC/D+ neurons in Dlx1/2–/– mice compared to control mice. WT and Dlx1/2+/– were grouped as “control” and
col-or coded Dlx1/2+/+ (blue), Dlx1/2+/– (green) (Student’s t test, n = 3–6 per condition). (S, T, V, W, Y, Z, BB, and CC) Representative images of HuC/D (magenta)
and nNOS (green; S and T), HuC/D (magenta) and GABA (green; V and W), HuC/D (magenta) and VIP (green; Y and Z), and HuC/D (magenta) and somatosta-tin (green; BB and CC) immunostaining in adult control and Dlx1–/–ENS. SP, submucosal plexus; MP, myenteric plexus. (U, X, AA, and DD) We observed no
difference in myenteric nNOS+ (U) or GABA+ (X) neurons, and no difference in submucosal VIP+ (AA) or somatostatin+ (DD) neurons in Dlx1–/– ENS (Student’s
t test, n = 3 per condition). Arrowheads indicate examples of neurons that were counted. For GABAergic neurons in Dlx1–/– adults, white arrowheads indicate
R E S E A R C H A R T I C L E
cell density (18.4%) and relative to total neuron number (13.2%) in myenteric plexus of Dlx1/2
Vip-IRES-Cre R26R-TdTomato mice (Figure 8, A–D). Furthermore, VIP reporter (TdTomato+) neuronal density was
dramatically reduced in absolute (51.5%) and relative terms (41.0%) in the submucosal plexus of Dlx1/2
Vip-IRES-Cre R26R-TdTomato mice (Figure 8, F–I). As before, we saw no difference in total neuronal
den-sity (Figure 8, E and J). We also confirmed that most TdTomato+ neurons appeared to express VIP protein
at P0 (Supplemental Figure 5, A–C).
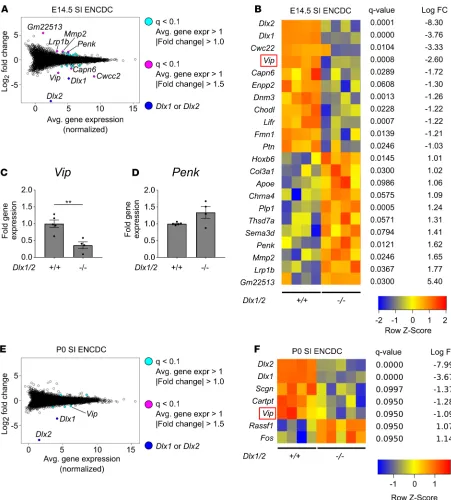
Figure 7. Vip levels are reduced in the developing ENS of Dlx1/2–/–mice at E14.5 and P0. (A) Bland-Altman plot of differentially expressed genes in
Dlx1/2–/– versus WT E14.5 FACS-isolated small intestine (SI) ENCDCs after RNA-seq. (B) Heatmap of differentially expressed genes shows 20
dysregulat-ed genes in Dlx1/2–/– ENS at E14.5, in addition to Dlx1 and Dlx2, which were substantially decreased in mutant mice. (C and D) Quantitative RT-PCR was
performed for Vip (C) and Penk (D) mRNA on independent samples to validate expression patterns for these neurotransmitters in E14.5 mouse ENS (Vip,
P = 0.0042, Student’s t test, n = 5 [+/+], n = 4 [–/–]; Penk, P = 0.0634, Student’s t test, n = 5 (+/+), n = 4 [–/–]). (E) Bland-Altman plot of differentially expressed genes in Dlx1/2–/– versus WT P0 FACS-isolated ENCDCs after RNA-seq. (F) Heatmap of differentially expressed genes shows 5 dysregulated
Dlx1/2–/– mice on a mixed background have fewer circular smooth muscle–projecting neurites. To determine
if VIPergic neurites differed in mutants, we immunostained Dlx1/2 Vip-IRES-Cre R26R-TdTomato SI with an antibody against neurites (TuJ1). We first examined nerve fibers within the myenteric plexus. All large nerve fiber bundles were TdTomato+ (Figure 9, A–H). We found no difference in nerve fiber bundle
diame-ter between Dlx1/2–/– mice and controls (Figure 9, I and J).
To determine if the relative density of VIP+ neurites projecting into circular smooth muscle (CSM)
is altered in Dlx1/2–/– mice, we quantified neurite density by drawing a line perpendicular to the axis of
CSM neurite projections and counting thin fibers crossing that line. Total density of CSM TuJ1+ neurites
was significantly reduced in Dlx1/2–/– mice (22.3% reduction, P = 0.0077; Figure 9, K–Q). However, the
ratio of TdTomato+ neurites to total was not reduced (Figure 9R). TdTomato+ neurite density was reduced
but this reduction did not reach our threshold for statistical significance (Figure 9S). To determine if the altered neurite density was consistent across strain backgrounds, we quantified density of proximal SI CSM-projecting TuJ1+ neurites in Dlx1/2–/– mice on a pure CD1 background, but we found no difference
in neurite density between mutants and controls (P = 0.3193; Figure 9T). These data suggest Dlx1/2 may affect targeting or growth of some neurites in CSM.
To further investigate how Dlx1 and Dlx2 affect neurite growth, we cultured ENCDCs from unselected E12.5 bowel in the presence of glial cell line–derived neurotrophic factor (GDNF) and labeled neurites using TuJ1. For this experiment, we used Dlx1/2 ChAT-EGFP-L10a mice on a mixed CD1 × C57BL/6 background, because we initially hoped to use EGFP to distinguish ChAT+ and ChAT– neurons in culture; however, EGFP
was not expressed at this young age. Cultured neurons exhibited highly variable morphology (Supplemental Figure 6, A and B). Quantification of total neurite length per cell body revealed no obvious differences between
Dlx1/2–/– and WT neurons (Supplemental Figure 6C; >400 cells traced), and histograms of total neurite length
for individual traced cells were similar for mutant and WT neurons (Supplemental Figure 6, D and E).
Dlx1/2–/– mice have reduced VIP in myenteric plexus nerve fibers and soma. To determine if VIP is reduced
in myenteric nerve fibers, we immunostained P0 mouse SI with antibodies against TuJ1, HuC/D, and VIP and imaged at high power. Using CellProfiler image analysis software, we created a mask defined by TuJ1, but not HuC/D (i.e., myenteric plexus nerve fibers, with cell bodies excluded) and computed average VIP intensity within the masked region (Figure 10, A–K). Average VIP intensity within myenteric plexus nerve
Figure 8. Vip-lineage TdTomato+ neuronal numbers are decreased in Dlx1/2–/–myenteric and submucosal plexus. (A and B) Myenteric plexus from
Dlx1/2+/(+or–)VIP-IRES-CreCre/wtR26R-TdTomato+control (A) and Dlx1/2–/–VIP-IRES-CreCre/wtR26R-TdTomato+mouse (B) stained with ANNA-1 antibody
labeling HuC/D (green) reveals fewer TdTomato+ cells in mice lacking Dlx1/2. (C and D) Quantification of A and B shows a reduced proportion of TdTomato+ neurons in Dlx1/2–/–myenteric plexus (C; P = 0.047, n = 6 [ctrl], n = 5 [–/–]) and reduced overall TdTomato+ neuronal density (D; P = 0.0017, n = 6 [ctrl], n = 5 [–/–]). (E) Total MP neuronal density was unchanged in Dlx1/2 mutant mice (E; P = 0.26, n = 6 [ctrl], n = 5 [–/–]). (F and G) Dlx1/2–/–VIP-IRES-CreCre/wt
R E S E A R C H A R T I C L E
fibers was significantly reduced in Dlx1/2–/– mice relative to WT (Figure 10K), demonstrating dramatic
reductions in VIP protein in myenteric plexus nerve fibers. Moreover, the relative area of nerve fiber bun-dles with high VIP expression (likely representing concentrated collections of VIP, i.e., varicosities) was even more dramatically decreased in Dlx1/2–/– mice (Figure 10, L–N).
We used similar methods to determine if VIP within nerve cell bodies was reduced. Average VIP inten-sity within soma was not significantly changed in Dlx1/2–/– mice (Figure 10, O–Q). However, the relative
area of soma with high VIP expression was significantly decreased in Dlx1/2–/– mice (Figure 10, R–T).
Together, these results confirm reduced VIP protein in Dlx1/2–/– ENS.
Discussion
Bowel motility disorders include life-threatening problems like Hirschsprung disease where the ENS is missing from distal bowel (33) and neuropathic CIPO where ENS is present, but dysfunctional (1). Human CIPO causes abdominal distension and bowel dysmotility that resembles bowel problems in Dlx1/2–/– mice,
but anatomic defects are often difficult to identify in CIPO. Although it is possible that more careful analy-sis of ENS structure would identify defects in human CIPO bowel, functional defects can also occur in the absence of anatomic abnormalities. For Dlx1/2–/– mice, we eventually uncovered anatomic defects, but only
after RNA-seq identified reduced Vip levels in mutant ENS. RNA-seq is possible in human ENS and might also be valuable in analysis of bowel from people with CIPO (34, 35).
Figure 9. Dlx1/2–/– mice have apparently normal large nerve fiber bundles but decreased CSM neurite density on some
strain backgrounds. (A–H) Myenteric plexus labeled with TuJ1 (green; A and E), TdTomato (red; B and F), and HuC/D (blue; C and G). All large nerve fiber bundles (white arrowheads) were TdTomato+. (I and J) Myenteric plexus nerve fiber bundle width (white line, I) was similar in Dlx1/2–/– and control mice (J; P = 0.4565, Student’s t test, n = 4 per genotype).
(K–P) Circular muscle neurites labeled with TuJ1 (green; K and N) and TdTomato (magenta; L and O) from P0 bowel. Some neurites were TdTomato+ and TuJ1+ (white arrowheads), while others were TuJ1+ alone (white arrows). (Q) Density of total TuJ1+ neurites was decreased in Dlx1/2–/–Vip-IRES-CreTdTomato P0 bowel (P = 0.0077, Student’s t test, n = 4 [ctrl], n =
3 [–/–]). (R) Ratio of TdTomato+ neurites to TuJ1+ neurons was unchanged (P = 0.5587, Student’s t test, n = 4 [ctrl], n = 3 [–/–]). (S) Density of TdTomato+ neurites was not statistically different for control and Dlx1/2–/– mice (P = 0.1006,
Stu-dent’s t test, n = 4 [ctrl], n = 3 [–/–]). (T) Density of total TuJ1+ neurites was normal for Dlx1/2–/– mice on a CD1 background
We chose to investigate bowel motility in Dlx1 and Dlx1/2 mutants because Dlx1 and Dlx2 are expressed in developing ENS at ages relevant for ENCDC migration, differentiation, and subtype specification, and because the original description of Dlx2–/– mice suggested they die from bowel dysmotility (10, 17–20). We
showed that neonatal Dlx1/2–/– mice have profound bowel function defects, including delayed gastric
emp-tying and slow SI transit via an in vivo FITC-dextran assay. FITC-dextran was found in the stomachs of all
Dlx1/2–/– mice tested, confirming that despite cleft palate, Dlx1/2–/– mutants were capable of swallowing and
that their stomachs empty slowly. When we maintained bowel in an oxygenated organ bath and treated with TTX, which blocks nerve cell activity, we found that Dlx1/2–/– bowels had severely reduced TTX-sensitive
contraction patterns. Interpreting these findings is challenging because a complex interplay of excitatory and inhibitory neural input regulates bowel smooth muscle contraction and relaxation. A naive interpretation is that neuron-mediated smooth muscle excitation (contraction) is defective in Dlx1/2–/– mice. Another
possi-bility is that Dlx1/2–/– bowel has reduced smooth muscle inhibition at baseline, leading to a mildly contracted
phenotype approaching that of control bowel treated with TTX. Consistent with this hypothesis, Dlx1/2–/–
bowel did not seem to contract significantly upon TTX treatment, unlike control bowel. Moreover, bowel videos suggest that neurally mediated “contraction complexes” actually consist of complex motor patterns, where bowel first straightens (possibly reflecting longitudinal smooth muscle relaxation), then contracts rap-idly, and finally returns to baseline tortuosity (Supplemental Video 1). TTX-treated bowel, which is highly contracted, never undergoes this pattern, and Dlx1/2–/– mouse bowel does so only rarely. Because Dlx1/2–/–
mice had a normal pattern of TTX-insensitive (i.e., non-neuronal) contractions, and Dlx1 and Dlx2 are
Figure 10. VIP is reduced in Dlx1/2–/– nerve fibers and cell bodies. (A–H) High-resolution slices from confocal Z-stacks showing TuJ1 (red), HuC/D (blue), and VIP (green). (I and J) Example mask constructed by thresholding on the TuJ1 chan-nel and subtracting thresholded HuC/D. (K) Average VIP intensity within masked regions was significantly reduced in
Dlx1/2–/– mutant mice compared with control, suggesting reduced VIP expression in nerve fibers (P = 0.0039, Student’s
t test, n = 3 [+/+], n = 3 [–/–]). (L–N) Total area of pixels with high VIP (defined arbitrarily as VIP intensity > 0.2 AU; L) was divided by total neurite area (M) to determine the percentage of nerve fiber bundles with high VIP expression, an approximation for density of VIP varicosities. This value was significantly reduced in Dlx1/2–/– nerve fibers (P = 0.0070,
Student’s t test, n = 3 [+/+], n = 3 [–/–]; N). (O and P) Example mask constructed by thresholding on the HuC/D channel. (Q) Average VIP intensity within soma was not significantly decreased in Dlx1/2–/– mice relative to controls (P = 0.100,
R E S E A R C H A R T I C L E
prominently expressed in developing ENS, we interpret these findings to mean that Dlx1/2 mutations cause neuropathic CIPO-like disease in mice.
Surprisingly, immunohistochemical studies showed Dlx1/2–/– bowel had largely normal ENS structure
at birth, with normal neuronal and glial density and normal ratios of many enteric neuronal subtypes, even though changes in these parameters have been identified in many mouse lines (3, 36–42). We note, how-ever, that our extensive anatomic studies were not exhaustive, that some antibodies gave weak signals in P0 ENS (e.g., tyrosine hydroxylase, substance P), and that we did not perform enough replicates to define sex-restricted defects. Furthermore, although Dlx2–/– mice had a small ENCDC migration delay at E12.5,
this may occur because of different strain backgrounds for Dlx2–/– (C57BL/6) and Dlx1/2–/– mice (CD1).
Strain effects on ENCDC migration have been reported in the ENS (29). It is, however, unlikely that this minimal transient ENCDC migration delay impairs bowel function at P0.
To identify defects causing CIPO-like disease in Dlx-mutant mice, we performed RNA-seq. Unex-pectedly, we identified a potentially novel connection between Dlx genes and Vip. The Dlx1/2–/– ENS had
decreased Vip mRNA at P0 (53% reduction) and a greater reduction in Vip mRNA at E14.5 (64% reduction by qRT-PCR, 84% reduction by RNA-seq). Consistent with the RNA data, the intensity of VIP immunos-taining in cell bodies and in neurites was significantly reduced in Dlx1/2–/– myenteric plexus. Moreover,
Dlx1/2–/– VIP-IRES-Cre TdTomato reporter mice had significantly fewer TdTomato+ neurons in myenteric
(18.4%) and submucosal plexus (51.5%), even though we could not appreciate neuron loss via VIP immu-nohistochemistry. We attribute this difference to limited VIP protein in nerve cell bodies, which may make neuron counting less reliable with antibody staining compared to using Vip-lineage reporter mice.
In the ENS, VIP acts as a critical ENS neurotransmitter with multiple roles. In myenteric plexus, VIP is coexpressed with NOS and PACAP in inhibitory motor neurons. These neurons inhibit the multicellular motor syncytium composed of smooth muscle cells, interstitial cells of Cajal, and platelet-derived growth factor receptor α+ (PDGFRα+) cells (5). In submucosal plexus, VIP+ secretomotor and vasodilator neurons
influence epithelial secretion and blood flow, respectively. VIP also acts on neurons and glia within the ENS (43) and is an important modulator of gut immunity (44). Thus, there are many ways that altered VIP abun-dance might impact gut motility, epithelial function, and immune system activity to impair Dlx1/2–/– mouse
survival. The importance of VIP in ENS function is highlighted by the observation that Vip–/– mice have
severely delayed SI transit, impaired mucin production, smooth muscle thickening, and shortened bowel, and die early due to GI stenosis (45). In contrast, Vip+/– mice are healthy enough to reproduce, but limited
data exist about bowel motility in Vip heterozygotes. These observations are consistent with the hypothesis that reduced VIP levels in Dlx1/2–/– mice could contribute to bowel dysmotility, but it is not easy to
deter-mine if the level of VIP reduction detected in Dlx1/2–/– mice adequately explains the profound bowel
motil-ity defects in these animals. We found altered levels of many additional mRNAs in the ENS of Dlx1/2–/–
mice and expression changes in 1 or more of these genes might also contribute to bowel dysmotility. Our findings highlight striking differences between the role of Dlx1 and Dlx2 in the ENS and their devel-opmental functions in the brain. In the CNS, Dlx1 and Dlx2 are required for migration of multiple popula-tions of inhibitory interneuron precursors from the ventral telencephalon into the neocortex and olfactory bulb (13, 14, 46). Dlx2 also regulates expression of the transcription factor Zfhx1b in the brain (21). Zfhx1b is critical for normal ENCDC migration, and in humans ZFHX1B mutations cause Mowat-Wilson syn-drome (a genetic disorder characterized by intellectual disability, epilepsy, microcephaly, and Hirschsprung disease) (22, 30, 47). Given this substantial evidence implicating Dlx1 and Dlx2 in processes critical for neuronal migration and differentiation, we were surprised that Dlx1/2–/– bowel exhibited normal ENCDC
migration at E12.5 and normal neuronal density at P0.
In CNS, Dlx1 and Dlx2 are necessary for expression of glutamic acid decarboxylase 1 and 2 (Gad1 and
Gad2), which catalyze GABA synthesis from glutamate (48, 49). Surprisingly, we found normal numbers
of GABAergic neurons in Dlx1/2–/– ENS, and we did not observe significantly decreased Gad1 or Gad2
gene expression in Dlx-mutant ENCDCs at E14.5 or P0. These findings suggest that in the ENS, GAB-Aergic neurons do not depend on Dlx1 or Dlx2 for Gad1, Gad2, or GABA synthesis. (Interestingly, our GABA antibody labeled more neurons than were previously reported in the literature [53% vs. 5% to 8% of myenteric neurons; refs. 40, 41]. We suspect this is because we quantified both brightly [~11%] and dimly labeled [~42%] populations of GABA+ neurons [Figure 6X], whereas prior studies may have only
loss or decreased neuronal density. Together, these findings underscore highly distinct roles for Dlx genes in enteric neurons, compared with the CNS.
Summary. CIPO describes a poorly understood constellation of diseases in which bowel motility is
abnor-mal despite the presence of neurons throughout the bowel. Although neuronal dysfunction accounts for many cases of CIPO, few causative genes have been identified (1, 5, 50). Our study provides an example of how bowel motility defects may occur in the absence of easily identified ENS structural defects, likely due to gene-level dysregulation. To our knowledge, few prior studies have performed such a comprehensive analysis of the neonatal ENS in mutant mice. There is a strong need to develop new tools to assess motility at young ages, since many ENS-relevant genes are also critical for palate development (12, 20, 51), kidney development (52–54), and other systems essential for life after birth. Our study is also the first to our knowledge to compre-hensively investigate the role of DLX1 and DLX2 in gut motility, and we believe the first to show a regulatory link between DLX1 and DLX2 and Vip. Remarkably, well-described functions for Dlx1 and Dlx2 in CNS, like control of cell migration and regulation of Gad1 and Gad2 to produce GABA, do not appear to occur in the ENS. Furthermore, DLX2 was reported to be essential for CNS Zfhx1b expression, and mutations in Zfhx1b lead to almost complete loss of enteric neurons in mice, whereas bowel colonization by ENCDCs proceeds normally in Dlx1/2–/– mice. Collectively these observations highlight how differently genes shared between
ENS and CNS may function. Future studies in humans are important to determine if Dlx mutations are pres-ent in individuals with CIPO and to elucidate if Dlx genes control Vip expression in developing human ENS.
Methods
Animals. All mouse experiments were performed in accordance with the Children’s Hospital of
Philadel-phia Institutional Animal Care and Use Committee. Del(Dlx1-Dlx2)1Jlr/Mmucd mice and B6.129X1-Dlx2tm1Jlr/
Mmucd mice (referred to as Dlx1/2 and Dlx2 mice, respectively) (10, 12) were obtained from the
MMR-RC (RRID:MMRMMR-RC_036673-UCD and RRID:MMRMMR-RC_015870-UCD) and were maintained on a CD1 or C57BL/6J background, respectively. B6;129S4-Dlx1tm1(cre/ERT2)Zjh/J (referred to as Dlx1-CreERT2)
mice were ordered from the Jackson Laboratory (RRID:IMSR_JAX:014551) and were maintained on a C57BL/6J background. EDNRB-EGFP-L10a mice (32) were bred with Dlx1/2 mice and maintained on a mixed C57BL6/J × CD1 background. ChAT-EGFP-L10a mice (RRID:IMSR_JAX:030250; C57BL/6J) were a gift from Joseph Dougherty at Washington University School of Medicine, St. Louis, Missouri, USA. Dlx1/2 ChAT-EGFP-L10a mice were obtained by breeding homozygous ChAT-EGFP-L10a mice to
Dlx1/2 heterozygotes and were maintained on a mixed C57BL/6J × CD1 background. Dlx1/2 Ret mice
were generated by breeding Dlx1/2 mice to RetTGM mice (referred to as Ret mice; C57BL/6J) (55) and
were maintained on a C57BL/6J × CD1 background. Tg(Wnt1cre)11Rth mice (referred to as Wnt1-Cre;
RRID:IMSR_JAX:003829) and Gt(ROSA)26Sortm9(CAGtdTomato)Hze mice (referred to as
R26R-Td-Tomato; RRID:IMSR_JAX:007909) were obtained from the Jackson Laboratory. Wnt1-Cre R26R-TdTomato
mice on a mixed (C57BL/6J × CBA/J) background were bred to Dlx1/2 mice and maintained on a mixed
(C57BL/6J × CD1 × CBA/J)F1 background. Viptm1(cre)Zjh/J mice (referred to as Vip-IRES-Cre; RRID:IMSR_
JAX:010908) on a mixed C57BL/6 × 129S4 background were bred to Dlx1/2 and R26R-TdTomato mice
and maintained on a mixed C57BL/6J × CD1 × 129S4 background. Genotyping was performed using
previously published and novel primers (Supplemental Table 1). Vaginal plug day was considered E0.5.
Preparation of whole gut samples. Adult mice were euthanized in CO2 (5 minutes) and cervically
dislocat-ed. P0 mice were euthanized by decapitation. Bowel was placed in cold PBS, opened along the mesenteric border, and pinned onto Sylgard 184 Silicone Elastomer (Dow Corning), serosa up, using insect pins. Tis-sue was fixed in 4% paraformaldehyde (20–30 minutes, 25°C) and transferred to PBS. Muscle was peeled from the mucosa and submucosa to separate myenteric and submucosal plexus. Peeled gut was equilibrated at room temperature for 30 minutes in 50% glycerol/50% PBS and stored (–20°C) until staining.
To prepare E12.5 bowel, pregnant dams were euthanized in CO2 (5 minutes) and embryos dissected in Lei-bovitz’s L-15 medium (Thermo Fisher Scientific, 41300039). Bowel was fixed in 4% paraformaldehyde (30 min-utes), equilibrated at room temperature (30 minutes) in 50% glycerol/50% PBS, and stored (–20°C) until staining.
E12.5 neuron culture. Pregnant dams were euthanized (CO2, 5 minutes) and E12.5 embryos were
R E S E A R C H A R T I C L E
(2 mM; Invitrogen, 25030081), B27 (1×; Invitrogen, 12587010), penicillin/streptomycin (1×; Invitrogen, 15140122), and 50 ng/mL 6×His-GDNF prepared as described previously (56). Cells were plated on Nunc Lab-Tek 8-well chamber slides (Thermo Fisher Scientific, 177402) coated overnight with 100 μg/mL poly-D-lysine (Sigma-Aldrich, P7280) and 20 μg/mL laminin (VWR, 47743-682) for 2 hours. After 2 days, cultures were fixed (15 minutes, 4% paraformaldehyde) and immunostained.
Immunofluorescent and enzymatic staining of whole-mount bowel. Whole-mount bowel stored in 50%
glyc-erol/50% PBS at –20°C was rinsed in PBS. Fixed E12.5 bowel was maintained in 48-well plates for the duration of immunostaining. Samples were blocked (2 hours) in PBS plus 0.1% or 0.5% Triton X-100 (PBST) with 5% normal donkey serum (NDS) (Jackson Immuno Research Laboratory) and incubated in primary antibody with gentle rocking at 4°C overnight, except for HuC/D (ANNA-1) antibody, where we incubated tissues for 2 hours at room temperature. Primary antibodies are in Supplemental Table 2. Tissues were washed 3 times, 5 minutes each, in PBST and incubated in secondary antibody (Supplemental Table
2) at room temperature with gentle rocking (1 hour). After 3 additional 5-minute washes in PBS, samples were mounted serosal side up in 50% glycerol/50% PBS on glass slides. NADPH diaphorase staining was performed as described previously (57). Briefly, NADPH (Sigma-Aldrich) and Nitro Blue Tetrazolium were dissolved in PBS with 0.2% Triton X-100. Samples were incubated in this solution (7–15 minutes, 37°C), rinsed in PBS, and then stained with antibodies as described above. For tissue labeled with ChAT anti-body, samples were fixed in 100% methanol on ice (30 minutes) and placed in Dent’s bleach (1:4:1 100% DMSO/100% methanol/30% H2O2) for 1 hour at room temperature before blocking.
Immunofluorescent staining of cultured cells. Slides were rinsed in PBS, blocked (1 hour in PBS + 0.1% or
0.5% Triton X-100 [PBST) with 5% NDS), and incubated with primary antibody (Supplemental Table 2) overnight (4°C). Tissues were washed 3 times, 5 minutes each, in PBS and incubated in secondary antibody (Supplemental Table 2) for 1 hour (room temperature). After 3 additional 5-minute washes, samples were mounted in 50% glycerol/50% PBS plus DAPI or Vectashield.
Microscopy. Zeiss Axio Imager.A2, Axio Observer.A1, or LSM 710 microscopes and Zeiss Zen software
were used to acquire images. Confocal images show single optical projections or maximum intensity pro-jections as indicated in figure legends. For image processing, ImageJ (NIH) and Adobe Photoshop were used to rotate, crop, and uniformly color adjust images.
Quantitative analysis of antibody-stained bowel. Unless otherwise specified, 5 to 10 randomly selected 20×
fields (a 0.045 mm2 region) per sample were analyzed for all quantifications. Using whole-mount stained
samples, we counted the number of enteric neurons (HuC/D+ cells), enteric glia (SOX10+S100β+ cells),
and SOX10+ cells (a mix of glia and ENS precursors) to determine density. Enteric neuron subtype
propor-tions were quantified by counting the number of HuC/D+, GFP+, neuronal NOS+ (nNOS+), calretinin+,
NADPH-diaphorase+, GABA+, VIP+, or somatostatin+ cells. Neurite fiber density was quantified drawing
a line perpendicular to CSM and counting the number of neurites that crossed the line. Observers were blinded to genotype for all quantitative analyses.
For measuring VIP intensity, we used 5 to 10 randomly selected 63× confocal Z-stacks per sample. Only slices capable of being accurately thresholded were analyzed. Using CellProfiler (58), images were thresholded with the Global with Minimum Cross Entropy settings and masked to quantify VIP intensity within HuC/D+ cell bodies and in HuC/D-TuJ1+ nerve fibers.
Quantitative analysis of neurites in culture. One large (>12 mm2) image was taken within a well (2
separate wells per embryo). Neurites from intact cells were traced, and cell bodies were counted using the Simple Neurite Tracer plugin in ImageJ by investigators blinded to genotype. Because neurites sometimes crossed, making tracing difficult, we determined average total neurite length per cell by dividing the sum of all neurite lengths by the number of nerve cell bodies. When neurites could be traced unambiguously, we measured the length of all neurites, added these lengths together to deter-mine total neurite length, and plotted the data in a histogram.
Delivery by Cesarean section. Pregnant mouse mothers (E18.5) were injected subcutaneously with 2 mg
of progesterone (Sigma-Aldrich, P3972-5G). The next morning (E19.5), mice were euthanized via cervical dislocation. Pups were removed from the mother as previously described (59) and placed on a warming pad (DCT-20, Kent Scientific).
Intestinal transit assay. A P0 FITC-dextran intestinal transit assay was performed as previously described
P35 mice were deprived of food for 14 hours and gavage-fed 100 μL of 10 mg/mL FITC-dextran (70 kDa) plus 2% methylcellulose. After 1 hour, mice were euthanized (CO2) and whole bowel was dissected, cut into 16 segments (stomach, 10 SI, 2 cecum, and 3 colon pieces), and placed in Eppendorf tubes contain-ing 400 μL PBS. Tubes were vortexed and centrifuged (4000 g, 10 minutes). Fifty microliters of supernatant was combined with 50 μL of PBS and analyzed using a fluorometer.
RNA extraction. E14.5 dams were euthanized with CO2. P0 pups were delivered by Cesarean section as
described above. Pups were rapidly removed from the mother. E14.5 SI was dissected in ice-cold Leibovitz’s L-15 medium (Life Technologies, 41300039) and dissociated (15 minutes, 37°C) in Dispase (0.2 mg/mL; Thermo Fisher Scientific, 17105-041) and collagenase (0.2 mg/mL; Sigma-Aldrich, C-6885) in PBS with P1000 trituration. P0 SI was dissected in Leibovitz’s L15 medium, snipped into small pieces using insulin needles (Becton Dickinson, 08290-3284-18), and dissociated (30 minutes, 37°C) in Liberase (Sigma-Aldrich, 5401135001) supplemented with DNase I (Roche, 04716728001), 6 mM MgCl2 and 1 mM CaCl2 in HBSS with repeated P1000 trituration. Fluorescent EGFP-L10a+ cells (E14.5) or Tdtomato+ cells (P0) were sorted
on a BD FACSJazz and collected in Neurobasal medium (Invitrogen, 21103049). RNA was extracted using the RNeasy Plus Micro kit (Qiagen, 74034) combined with the RNase-Free DNAse Set (Qiagen, 79254). Samples were run on an Agilent Bioanalyzer and used if RNA integrity number (RIN) was greater than 7.0.
Bowel physiology. Between 1 and 3 hours after Cesarean section, pups were decapitated. Bowel was removed
and placed in warmed (37°C), oxygenated (95% O2, 5% CO2) Krebs-Ringers solution (118 mM NaCl, 4.6 mM KCl, 2.5 mM CaCl2, 1.2 mM MgSO4, 1 mM NaH2PO4, 25 mM NaHCO3, 11 mM D-glucose, pH 7.4) in a horizontal organ bath (Hugo Sachs Elektronik, Harvard Apparatus, D-79232) with fluid continually replaced at a rate of 6.15 mL/min. Proximal SI was isolated by making 1 cut distal to the stomach and a second cut approximately 2 cm proximal to the cecum. The proximal end of the SI was cannulated and tied to a P2/P10 Ultra Micro Pipet Tip (Thermo Fisher Scientific, 02-707-438) connected using an L-shaped connector (Har-vard Apparatus, 72-1407) and tubing to an upright 3 mL syringe (Becton Dickinson, 309657). Fluid level in the syringe was maintained at 1.3 cm above the proximal end of the bowel. Proximal and distal bowel were at the same elevation. Bowel was pinned loosely on a secure piece of Sylgard 184 Silicone Elastomer (Dow Corning), illuminated to contrast with background, and filmed with a camera (Olympus, PEN Mini E-PMI) connected to a dissecting microscope (Olympus SZ-PT SZ40). After an initial 20-minute video, 1 mM TTX stock solution (Abcam, ab120054) dissolved in sodium citrate buffer (40 mM citric acid monohydrate and 60 mM trisodium citrate dihydrate, pH 4.8) was diluted in Krebs-Ringer to a concentration of 1 μM. The resulting solution was oxygenated and pumped into the organ bath, and then another 20-minute video was recorded.
Analysis of bowel motility patterns. Videos were converted to .wmv format using Movie Maker and saved
at 1× and 16× speeds. In-house MATLAB (MathWorks) scripts (http://github.com/christinawright100/ BowelSegmentation) were used to threshold the movies, generate kymographs, and perform Fourier trans-form analysis. Peak frequency was determined by calculating the Fourier transtrans-form at each vertical slice of the kymograph, averaging these, and plotting the averages to determine the peak frequency. Investigators blinded to genotype and condition quantified neurally mediated contractions in kymographs and recorded if contractions were rhythmic or nonrhythmic. To quantify bowel width and tortuosity, 10 random frames were saved from each video and analyzed in ImageJ. For each frame, we measured 5 random widths (ran-domly generated using a MATLAB script) along the proximal bowel (50 widths per bowel). For tortuosity, total bowel length was divided by straight-line distance.
qRT-PCR analysis. qRT-PCR was performed using previously described primers that we validated
(Sup-plemental Table 3 and Sup(Sup-plemental Figure 4) and SSoFast Evagreen (Bio-Rad, 172-5211). Fold change relative to control was computed using the ΔΔCt method with normalization to Gapdh mRNA levels.
RNA-seq. RNA was extracted as described above. cDNA libraries were generated from samples with
RIN greater than 7.0 using the SMARTer Stranded Total RNA-Seq Kit v2 Pico Input Mammalian (Takara Bio, 634411) designed to work with very-low-input RNA. Libraries were sequenced on an Illumina HiSeq 2500 to a read depth of 17 t


![Figure 8. Vip-[ctrl], lineage TdTomato+ neuronal numbers are decreased in Dlx1/2–/– myenteric and submucosal plexus](https://thumb-us.123doks.com/thumbv2/123dok_us/43946.2005526/12.585.49.537.65.268/figure-lineage-tdtomato-neuronal-numbers-decreased-myenteric-submucosal.webp)

