© Shiraz University
IMPROVING HUMAN-COMPUTER INTERACTION IN
PERSONALIZED TV RECOMMENDER
*T. POŽRL,
**M. KUNAVER, M. POGAČNIK, A. KOŠIR AND J. F. TASIČ
Faculty of Electrical Engineering, University of Ljubljana, Trzaska 25, 1000 Ljubljana, SloveniaEmail: [email protected]
Abstract– In today's world of numerous sources of multimedia content, recommender systems help users find relevant content items. In our research the reasoning behind the recommendations generated by such systems was explored to check whether presenting users with explanations of recommended content increases their trust in the system. A content-based recommender for TV content has been developed which focuses on items attribute values. The system predicts users' ratings by classifying the vector of similarities between the user model and the items attributes. Users' trust is increased by identifying attribute values that are the most relevant for them. Users' feedback to the identified attribute values was used to improve the performance of the recommender algorithm. Tests in our experimental platform showed that the developed algorithms produce good results. The accuracy of the system was around 75% in the basic version and it further increased in the enhanced, while the identification of relevant attribute values achieved 86% precision.
Keywords– User modeling, recommender system, content-based filtering, human-computer interaction, user satisfaction, recommendation explanation
1. INTRODUCTION
The benefits of recommender systems (RS) were long ago accepted by service providers who initiated early implementations of recommender algorithms into their systems and started advanced services such as personalized content recommendations. Recommender systems introduce artificial intelligence in such systems as they aim to help users when the amount of available content exceeds reasonable numbers and when users are no longer willing to manually browse listings of content. Recommender systems have been employed for recommending web news, books, music, TV programs, web based services etc. [1-4].
Many issues have already been addressed by the research community, for example the method(s) used to find interesting content, acquiring the relevant data needed by RS to recommend content (data about users, content descriptions, user feedback etc.), generating a list of items for recommendation, constructing user interface for the presentation of recommended items, achieving data privacy in RS, ensuring protection against the attacks on the RS etc. [5, 6]. In our research we focused on another important issue of the RS, explaining the recommendations [7]. It has been proved [8] that users' satisfaction with the RS improves with better interaction. Usually, users of an RS are only presented with a list of items that the system assumes are suitable for them, but they get no information how the system managed to figure out what they like. By explaining the reasons behind content recommendations the interaction between users and a system is improved as users get an insight into an RS’s reasoning logic.
In developing the mechanisms for generating explanations of recommended items we focused on RS that recommend content in TV content systems. Such systems have long been widely used across the
Received by the editors August 1, 2011; Accepted April 15, 2012.
world but have gained additional attention with an emergence of Internet Protocol television (IPTV). The delivery of TV content and services using Internet Protocol enables advanced services, higher interactivity and also makes more content available to users. To enable personalized content recommendations in TV content systems we employed content-based recommendation technique (CBR). CBR was chosen as it considers content descriptions for rating predictions, which seemed a good starting point for developing a mechanism for explaining recommendations. Users often base their decision to watch a movie on whether it is a popular genre, if their favorite actor is involved in the movie etc., and CBR enables us to find such attribute values in an item's description. The idea behind the development of our CBR system was to focus on finding attribute values in the description of an item that a user has a very high preference towards. These are the attribute values that we believe are the most relevant for a user and have the greatest influence on his/her decision whether to watch a movie and should therefore be detected by our system.
To test the developed approaches we have linked up with SiOL [9], the biggest internet protocol TV (IPTV) service provider in Slovenia. The users of SiOL IPTV can search through TV listings using electronic program guide (EPG) system, they can record programs with a personal video recorder system and they can also order additional content from the digital store using video on demand (VOD) service. We have developed an online application that simulated SiOL EPG system, but could easily be adapted for video on demand service or for the personal recorder system. Our aim was to first test the developed recommender algorithms in a smaller closed environment before integrating it into a live SiOL productive system.
The structure of this paper is as follows: the rest of section presents the problems that we addressed in this paper and it also includes related work in the field. Section 2 describes our recommender algorithms and modules, the testing environment, dataset and evaluation techniques, test results are presented in section 3 and section 4 concludes the paper with a look to the future work.
a) Related Work
A great deal of research has been done in the area of content recommender systems and many approaches have been developed. In the domain of TV and video content recommendations many approaches exist. Some rely on identification of similarities among users (CF) [10, 11], some approaches work with only one user and his/her rated items at a time (CBR) [4, 12], and many systems also combine different approaches into a hybrid recommender (HR) [13-14]. In our research we have focused on CBR technique.
Recommender systems for TV and video content also differ in terms of the consumers recommendations. Most systems filter and select content for individual consumers of content [15-16], some make recommendations for groups of users (TV audience) [17], while recently [18] some effort has also been made to generate recommendations for professional users, TV directors and editors in order to help them during live TV production. Our proposed approach is aimed at individual consumers.
Many mathematical tools are used for personalized content selection. Tools come mostly from the field of machine learning area and include Bayesian classifier [13], decision trees, decision rules, regression, support vector machines [19] etc. For the purpose of SiOL recommender system we have decided to test a selection of the available machine learning algorithms for classification to find out which works best for our dataset and implement it in our system.
b) Problem statement
interesting. We wanted to improve this interaction and increase users' satisfaction with the system by explaining why the system recommended the items to them.
Users usually do not get any insight into the algorithm of the recommender system. They are only presented with the outcome of the system and might feel uncomfortable because the system discovers their preferences. We wished to increase users' trust in the recommender system by presenting them with the reasoning behind the recommendations. These reasons should reflect the users’ preferences and relevant data for their consumption of TV content. The process of generation of explanations must be able to identify the data that had the bigger influence on the recommendation of an item. In general, the data relevant for recommendations depend on the type of the recommender system and on the data used by it. In our research we focused on building a content-based recommender system as we believe users often base their decision to watch a movie, documentary and other TV content items on the characteristics of these items. Content attribute values that influence TV content consumption include users' favorite actors and directors, specific genres etc. We wanted to identify such attribute values and present them to users. Our recommender algorithm should work with each of the attribute values in items descriptions and discover the most relevant ones.
Content-based recommender systems determine users' preferences by analyzing the ratings that users give to consumed items. This is somehow problematic, because the system only assumes that if a user likes an item he also likes all the metadata (actor(s), director(s), genre etc.) in its description. Users' feedback to the presented attribute values in the explanations of the recommended items are, however, much more quality information about their opinion on these attribute values. We wanted to check whether using this feedback can improve the performance of our CBR system.
2. MATERIALS AND METHODS
In this section recommender modules in our CBR system, which we developed to enable personalized content recommendations in IPTV applications as well as to improve human-computer interaction in such applications by generating explanations of recommendations are described.
First, a basic CBR system was built which generates a content-based user model based on ratings and a metadata description of items the user has previously rated and then uses this model to calculate the similarity of new items. Similarity of items is first calculated for each attribute value in the description of the item and these similarities are combined with a similarity of the attribute. A vector of similarities of attributes is then classified with classification methods into one of the rating values which is also the CBR system's predicted ratings. The basic CBR system was upgraded by adding a module for identifying relevant attribute values for recommendations and for generating explanations of recommended items. The upgrade module was integrated in the second stage of the CBR system. In this stage the users' preferences towards attribute values are determined by calculating the similarities of attribute values with the model of the user. The identification algorithm analyzes the similarities and selects attribute values with the similarity above a predefined threshold as the most relevant for the user. These attribute values are to appear in the explanation of recommendation if the items are recommended. In the last phase of our research we used users' feedback to attribute values presented in the explanations of recommended items to try to improve the performance of basic CBR system. In the upgraded version of our CBR system users' ratings of attribute values were considered in the attribute values similarity calculation.
a) Content-based recommender
similarity between items and a user model was redefined and more classification methods for rating prediction were examined. Our CBR focuses on finding such attribute values in the description of an item that a user has a very high preference towards. We defined a special similarity function that enables us to detect such attribute values. If we detect attribute values with high preferences, we assign a high similarity value between the attribute value and the model of the user.
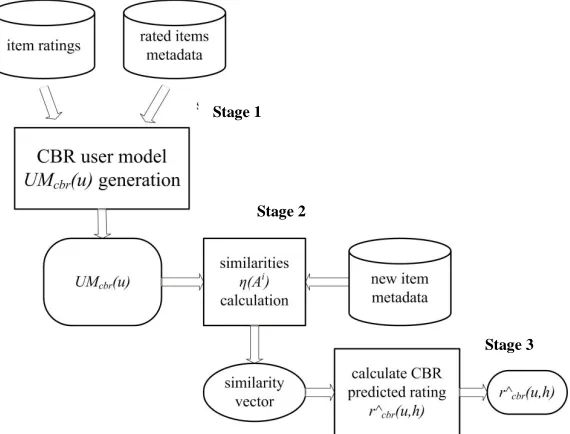
Our content-based recommender involves three stages:
1. Generate content-based user model UMcbr from the items h the user u has already rated.
2. For each new item h H calculate attribute similarity values η(u,Ai) for attributes in item metadata md(h) using user profile UMcbr.
3. Based on attribute similarity values η(u,Ai), classify the item h using classification function δ and predict user rating.
These stages are presented in Fig. 1, which will help us to describe all three stages in more detail.
Fig. 1.A scheme of our content-based recommender system
Stage 1 of content-based recommender
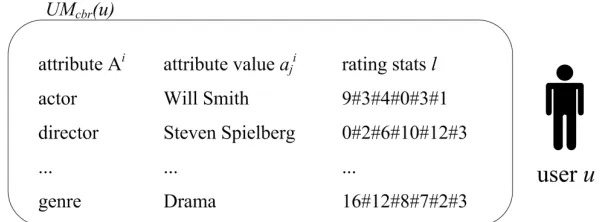
In the first stage a content-based user model UMcbr(u) is generated from the items that the user has rated previously; UMcbr(u) is based on items' metadata md(h) and contains entries (Ai,aji,l). A small extract from an example of content-based user model can be seen in Fig. 2.
UMcbr(u) contains all the different attributes values ajiof the items that the user has rated previously, for example 'Drama', 'Will Smith' etc. as seen in the example in Fig. 2. An attribute name Ai is also included in the model to avoid ambiguity (for example, when a person appears in different rolls, actor, director etc.). For each attribute value rating statistics l is calculated. l contains the number of ratings that this attribute value received via the ratings of items it was described with. If a user gives a rating of 'good' to a film 'Saving Private Ryan', this rating is "transferred" to all attribute values that this film has in its metadata, for example, its director 'Steven Spielberg' etc. l is a collection of number of ratings for each of the rating values that a user can give to an item (rating values used in our experimental environment are described in more detail in section 2c. The entry '0#2#6#10#12#3' for director 'Steven Spielberg' in the user model in Fig. 2 means that the user rated films that 'Steven Spielberg' directed as follows: two times with the rating 'good', 6 times with the rating 'average', 10 times with the rating 'bad', 12 times with the rating 'terrible' and there were also 3 films of Steven Spielberg that this user did not know.
Stage 1
Stage 2
Fig. 2.An example of a content-based user model in our system
Stage 2 of content-based recommender
To be able to predict the user's rating for an item during the prediction phase, we first estimate how similar a specific item attribute Ai is in comparison to the user's preferences accumulated in his/her user model UMcbr(u). This involves calculation of attribute similarity values η(u,Ai) for all attributes Ai of new items. This stage differs for attributes that only have one value and those with many values. A film only has one production year and usually only one country of production, but many actors are involved in the production and possibly also more than one director. To calculate η(u,Ai) we first calculate similarity values of all values of Ai (aji is, for example, j-th value of Ai) and then combine these similarity values. If aji is the only value of Ai, the similarity value of the attribute Ai equals similarity value of aji.
We calculate the similarity value η(u,Ai) for i-th attribute of the item in three phases:
i. Main similarity value calculation.
ii. Correction weight calculation (if necessary). iii. Overall similarity value calculation.
Main similarity value calculation: We first calculate a main similarity value for all attribute values of the attribute Aiusing ratings that each attribute value aji received during the previous user's interaction with the system. For each attribute value aji we check the user model UMcbr(u) and calculate the main similarity value if we find rating statistics for this attribute value.
The main similarity value is based on the distribution of ratings and is calculated using the Eq. (1). It involves counting the number of positive ratings Npos(u, aji) and the number of all ratings N(u, aji) that the attribute value aji received. On a five-level rating scale (for this calculation we excluded the 'unknown' option on the rating scale, see section 2c ) we marked a rating as positive if it was one of the top two rating values ('good' or 'excellent') and negative if it was one of the other three rating values.
3
)
5
.
0
)
,
(
)
,
(
(
8
)
,
(
i
j i j pos i
j main
a
u
N
a
u
N
a
u
(1)The function presented in the Eq. (1) enables us to detect attribute values for which users expressed their high preference towards. Functions of a higher power than 3 would cause fewer attribute values to be determined as important and consequently fewer items would be recommended. Functions of a lower power (linear similarity function), on the other hand, would also emphasize attribute values with only approximately half of the ratings positive, which would make the recommender less adjusted to the users' taste.
achieve this, the main similarity value for such attribute values is adjusted by introducing a correction weight wcorr. We calculate wcorr using the Eq. (2).
otherwise
N
a
u
N
N
a
u
N
if
a
u
w
i j i j i j corr,
)
,
(
)
,
(
:
,
1
)
,
(
3 lim lim (2)We have defined this function experimentally after testing several functions, from linear function to functions of a higher order. If the number of ratings for such attribute values is lower than a preset limit Nlim (in our test environment we set this limit at 5), we calculate the correction weight on a 0 to 1 scale, in other cases the weight is set to 1. Similarly to the Eq. (1) the function presented in the Eq. (2) enables us to emphasize attribute values that received a high enough number of ratings. Similarities of attribute values that received low number of ratings are lowered substantially to decrease their impact on the item recommendation.
Overall similarity value calculation: In this phase we calculate the overall similarity value η(u,aji) for each attribute value aji by multiplying the main similarity value ηmain(u,aji) and the weight wcorr(u,aji) - see the Eq. (3).
)
,
(
)
,
(
)
,
(
u
a
ij
mainu
a
ijw
corru
a
ij
(3)Finally, the attribute value similarity η(u, Ai) is calculated for each of the attributes in the item description using the eq. 4, where m is a number of values of a specific attribute. This phase differs for attributes that have just one value (categories, genres etc.) and for multi value attributes (actors etc.). For single value attributes there is just one similarity value and no additional calculation is needed, while for multi value attributes we calculate the final similarity value as an average of similarity values for particular attribute values.
m j negSim i j ij
u
a
w
m
a
u
1
(
,
)
1
)
,
(
(4)We have used the weight wnegSim to slightly reduce similarity values for attribute values with negative similarity values. For attribute values with the positive similarity value wnegSim equals 1, while for those with negative similarity value it equals 5. We have done this to emphasize attribute values that are preferred by the user and reduce the influence of the attribute values that the user does not prefer.
In the end of this phase we construct a set of similarity values η(u, Ai) (one for each of the attributes Ai) as a similarity vector x.
Stage 3 of content-based recommender
Once we calculate the similarity values for all attributes Ai, we classify the item or, in other words, we predict the user's rating for this item. Classification methods classify items based on a classification model and have to be trained first. Input data for classification training are similarity vectors x for the items h that the user has previously rated and the ratings r given by the user to these items. The built classification model is then used to perform classification using function δcbr(x) for classifying new items h into one of the rating values. The outcome of this stage is a predicted rating rcbr^(u,h).
precision (the results are presented in section 2a). The methods included in our tests were chosen based on the characteristics of the dataset. The list included methods that are commonly used in recommender systems (naive Bayes method, nearest neighbors approach, decision trees and support vector machines), as well as some methods that promised good performance from our preliminary research (linear regression, 'M5Rules' decision rules approach, instance-based 'Kstar' method and 'HyperPipes' method.
Classification methods work with either numerical or nominal classes. We made our system adaptive and capable of working with both types of methods. Rating values used in our testing environment were nominal and to be able to use them in classification methods that work with numerical class attributes we mapped rating values to numerical values (more details about the conversion are described in section 2c). The outcome of classification methods (CBR predicted rating) is also either nominal or numerical. For the purpose of evaluation of the CBR system, all the outcomes of the CR system were converted to a binary predicted rating (more details are presented in section 2d). For the purpose of usage in the HR system, similarly the nominal predicted ratings were converted to numerical, but the numerical predicted ratings were directly applicable in the HR system.
b) Explaining recommendations
Users' experience with the recommender system improves if they understand what it is doing [21]. Some users feel uncomfortable if the system only presents them with a list of recommended items, because they do not understand how a computer decided that they will like the presented items. Our module for generation of explanations of recommendations identifies attribute values that are relevant for users. In addition to improving the users' experience the module also provides additional mechanisms to improve the performance of the system. Users can give feedback to the explanations provided by the system and express their preference towards the presented attribute values. This explicit user feedback is then used to try to improve the performance of the recommender system.
Two important facts were taken into account during the identification of relevant attribute values. The first fact is that all attribute values of a certain item are potentially applicable for explanations. The second fact is that the explanations should include only those attribute values that have a high probability of being relevant to a user. In stage 2 of our content-based recommender system we calculate similarities of all attribute values in item description. A high similarity value of a certain attribute value suggests that this attribute value is relevant to this user. We therefore believe that the generation of the recommendation explanations can be based on the similarities of attribute values to the user model.
Algorithm for generating explanations: Input data for the module for generating explanations are similarities between attribute values and the user model that are calculated during stage 2 of our content-based recommender system. In this case, there is no difference between single value and multi value attributes, as all attributes are only analyzed at the level of a particular attribute value. We process each of the items h that might be appropriate for recommendation to user u separately. We calculate the similarity of each of the item's attribute values aji in comparison to the user model UMcbr(u). This calculation results in a list of similarity values for each of the attribute values. The size of this list is not known in advance, as it depends on the number of attribute values that the item h is described with. Movie items might be described with 10 or more actors, for example, but live sport events descriptions may only include a title and a genre.
t l i
j i
j
relevant
if
a
a
,
:
(
)
exp (5)An attribute value is considered as relevant for the recommendation if the attribute value similarity to the user model is equal or greater than the threshold ηtexpl. We select such attribute values for the presentation to the user as an explanation if a particular item gets recommended. Our aim was to determine the optimal value of ηtexpl. We wanted to achieve high accuracy of the identification of relevant attribute values while ensuring that explanation is generated for the majority of the recommended items. If we set ηtexpl too high, fewer attribute values would be identified as relevant and some of the recommended items would not get an explanation. If we set ηtexpl too low, more attribute values would get through the identification process including some that are not relevant to users. To determine the optimal value of ηtexpl we also considered a presumption that users base their decision to watch a TV program on a limited number of reasons. For example, user watches a movie if his/her favorite actor is involved or if it is of a genre that the user likes. Therefore, we took a rather conservative approach to selecting attribute values as relevant.
Using feedback to explanations to improve the performance of the CBR recommender: Attribute values that are identified as relevant for users and presented to them in the explanation of the recommended items can be used to improve the performance of the CBR recommender system. Users can respond to the presented attribute values and the collected feedback presents a valuable source of users' preferences. Usually, users' preferences are learnt by analyzing their ratings of items. In this case users express their opinion about the whole item and we have to assume what their preferences are towards the metadata of the item (attribute values in the item's description). If a user likes, for example a movie, we can only assume that he/she also likes the actors in the movie, the genre etc. By rating the attribute values included in the explanations users directly express their opinion about specific attribute values, an actor, a director etc. This gives us much more quality information about users' preferences, so we decided to use it to improve the performance of the CBR recommender.
In the upgraded version of our CBR system, users' ratings of attribute values were also considered. If the item being processed by the CBR was described with one or more attribute values that appeared in the explanations of the recommendations and a user rated it/them, the system corrects the similarity of these attribute values to the model of the user calculated during stage 2 of the CBR system. The algorithm goes through all attributes Ai of the item currently being processed as well as for each of the attributes and, for each of the values of the attribute aji, the similarity of the attribute value is first calculated using Eq. (3) as in the original version of the CBR. The system then checks whether user's rating r(u, aji) for the attribute value exists. If it does, the algorithm uses this rating to recalculate the similarity of the attribute value to the model of the user. The calculation of the corrected similarity is performed using Eq. (6).
r i j i
j i
j
u
a
w
r
u
a
w
a
u
,
)
(
,
)
(
,
)
(
*
(6)We think that in the Eq. (6) r(u, aji) should be given much higher influence than η(u, aji) as it is a direct opinion of the user about the attribute value, whereas η(u, aji) is calculated from the user's ratings of content items. wr should therefore be set higher than wη to improve the performance of the CBR system.
We tried to find the optimal values of wηand wr to achieve the highest precision of our system and the
results are presented in section 3b.
c) Dataset and testing environment
The recommender algorithms presented in this article were developed to enhance the services of the (SiOL) company. As SiOL did not allow us to implement the methods directly into its system, we decided to build a web application which simulated a SiOL EPG and was based on real EPG data from the SiOL system. The application also included a mechanism for collecting users' feedback. Our testing environment did not work as a real recommender system but rather as a tool for collecting users' feedback. Users rated all items in the dataset and all attributes values in the descriptions of items and the obtained ratings allowed us to evaluate the accuracy of the developed methods.
The SiOL company provided us with a subset of the daily generated EPG for over 100 TV channels broadcasted in Slovenia in the first half of 2007. Out of 62 attributes that SiOL uses in its EPG metadata scheme category, genre, year of production, country of production, actors, directors, presenters and guests were used. SiOL uses a two-level categorization of TV items. The first level is called a category and consists of 11 different categories, which are general types of TV items. All categories have subcategories called genres. A genre describes the content of a TV item in more detail, for example, for the category 'Film' (films) there are genres such as 'Akcija' (action), 'Drama' (drama) or 'Vojni film' (war film). All the items in the SiOL EPG system are denoted with both the category and the genre information, which eliminates problems with insufficient content categorization [19].
25 users were involved in the collection of the rating data. Their involvement was invitation-based and was done so as to include users from different age groups, both male and female and of a different taste for TV content (as self-expressed). 18 users from the 25 involved were male and 7 were female. The users’ age varied from 15 to 59 with the average just under 31. Users interacted with the system via a web interface which included a module for presentation of descriptions of items and a mechanism to collect users' response to presented items. First, users registered and optionally entered their basic data (age, sex etc.) Then, at each of the next logins, which simulated the use of a TV device, users were presented with the descriptions of 10 items from our dataset and asked to rate them. Users logged in into the system one or more times each day and they continued to do so until they rated all of the items from the dataset. In the second phase a similar procedure was used to collect users' ratings for the attribute values that appeared in items description.
The users rated the items and the attribute values using a five-level scale of ratings: 'excellent', 'good', 'average', 'bad' and 'terrible'. Additionally, the option 'unknown' was offered to users to allow them to tell us that they do not know the presented item or attribute value. These ratings were not included in the evaluation. For the purpose of some of the methods used in our system, the top two ratings on the scale ('excellent' and 'good') were denoted as positive, while other ratings were denoted as negative. The rating scale used in our testing environment was Likert-type, rating values were ordered and also symmetric around the 'average' value which allowed users to adequately express their opinion.
of the content-based filtering algorithm, where attribute values ratings were used to correct the similarity values of attribute values in items descriptions.
During the testing period 3582 ratings of 200 TV programs were collected. The users rated 143.28 items on average and each item was rated 17.91 times. We also collected 2356 ratings of 174 attribute values. On average users rated 94.24 attribute values and each attribute value was rated 13.54 times.
To calculate some additional statistics of the collected feedback we converted the above mentioned nominal rating values to numeric values in the same way as described above. For ratings of items, an overall average rating value, calculated using ratings of all items in the set, equaled 0.334. We also calculated average ratings of a user, calculated for each user first and then averaged overall users, which equaled 0.313. Similar calculation was also done for items. We calculated an average rating value for each item in the set and averaged these averages. The result in this case was 0.260.
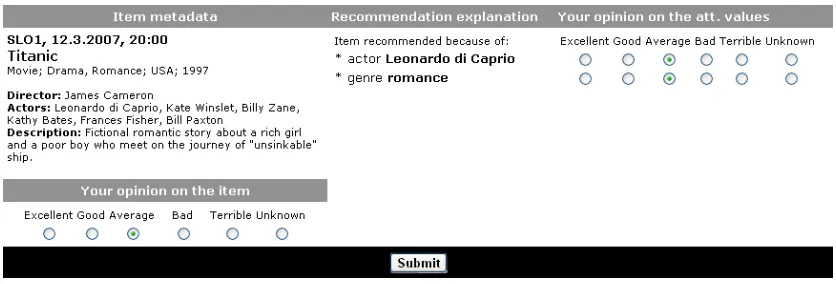
For ratings of attribute values that appear in the explanations, an overall average rating value, calculated using all attribute values ratings, equaled 0.599. An average rating value of a user calculated for each user first and then averaged overall users, equaled 0.557. An average rating value of an attribute value calculated for each attribute value first and then averaged overall attribute values equaled 0.504. Although our testing environment did not work as a real recommender system, Fig. 3 shows a basic example of what a user interface for presenting recommended items, recommendation explanations and collecting users’ feedback could look like.
Fig. 3.An example of the recommender system user interface
In this example shown, the recommender system found one suitable item for the user, the movie “Titanic”. There are eight attributes in the item metadata: title, category, genre(s), country of production, year of production, director, actor(s) and description. Attribute genre has two values (drama, romance), attribute actor(s) has six values and other attributes have just one value. In this example, the recommender system with its module for generating the explanations for the recommendations considered 14 attribute values as possibly relevant for the user. As it is shown in Fig. 3 the module found two of these attribute values to be relevant for the user and presented them to him/her as the explanation for the recommendation. The user has an option to rate the recommended item as well as both attribute values found to be relevant for him/her.
d) Evaluation techniques
some items (usually the ones with the highest predicted ratings) and present them to the user. For the purpose of evaluation of our system we did not deal with this issue, we just checked how good our system is at estimating which items are suitable for the user. As the outcomes of our recommender modules varied from nominal predicted ratings to discrete and continuous numerical predicted ratings, we converted them to a binary predicted rating: the item was either found to be suitable for a user and a candidate for the recommendation or it was unsuitable. In the case of nominal predicted ratings (CBR system with classification methods with nominal classes) the items with the top two rating values on a 5-rating scale (as described in section 2c) as predicted ratings were selected as suitable. In the case of numerical predicted ratings (CBR with classification methods with numerical classes), where numerical predicted ratings were on a -1 to 1 scale, items with predicted ratings of 0.5 or above were selected as suitable for a user.
Many measures have been proposed in the information retrieval field [22], but we have decided to use the standard measures, precision (P), recall (R) and f-measure (F) [23] to evaluate the performance of our CBR system. In our case precision is the most important measure, because we believe it is more important for recommender system to precisely generate 'positive' predictions, which will be presented to the user (which is measured by precision), than for recommender system to recommend a lot of the items that it actually should (which is measured by recall). We think that it is better to generate fewer recommendations but be accurate at it. This can also be derived from the work presented in [24]. High precision value is therefore preferable in our system.
A 3-fold validation was used as the set of items we used is relatively small (200 items) and the number of attribute values describing these items is therefore also small. Dataset was split into three parts. Two thirds of items (training set) were used to generate user models and the remaining items (test set) were used to calculate similarity vectors. This was repeated 3 times to ensure that every item is included in the test set and that it gets a similarity vector. The set of similarity vectors was classified using classification methods where 3-fold cross-validation was used again.
Recommendation explanations were evaluated by calculating the precision of the identification of relevant attribute values - Pexpl. Attribute values identified as relevant and also rated positively by the user were considered as correctly identified.
3. RESULTS AND DISCUSSION
In this section the results of evaluation of our CBR system and its upgrades are presented. In subsection 3a we present the evaluation results of our basic CBR system and in subsection 3b we present the results of the evaluation of module for generating explanations of recommendations. More focus was dedicated to the identification of attribute values that are relevant for explanations of recommendations and to using feedback to such attribute values to improve the performance of the system.
a) Content-based recommender
During the testing of the basic CBR system the focus was on finding the best method for classification of similarity vectors and content-based prediction rcbr^(u,h) generation. At the same time, the efficiency of the developed similarity function (Eq. (1)) was tested. We put vectors of attribute similarities into Weka environment and tested its methods for classification. Classification methods estimated users' ratings for items and produced ratings predictions rcbr^(u,h).
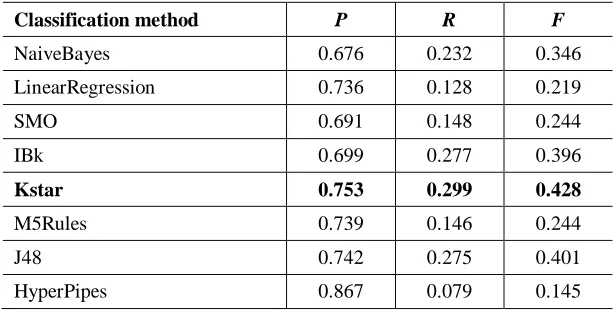
precision (0.737), but the recall for this method was very low (0.128). Support vector machines method ('SMO' implementation in Weka) did not perform as well as linear regression. 'Lazy' methods proved to be quite successful in our tests, especially 'Kstar' method, whose precision was 0.753 and recall was almost 0.3. K-nearest neighbors method 'IBk', on the other hand, was less successful. The decision rules method 'M5Rules' achieved high precision (almost 0.74) but, similar to linear regression, the recall was low. The decision trees method 'J48' performed similar to 'M5Rules'.
Table 1. CBR system performance for selected classification methods
Classification method P R F
NaiveBayes 0.676 0.232 0.346
LinearRegression 0.736 0.128 0.219
SMO 0.691 0.148 0.244
IBk 0.699 0.277 0.396
Kstar 0.753 0.299 0.428
M5Rules 0.739 0.146 0.244
J48 0.742 0.275 0.401
HyperPipes 0.867 0.079 0.145
In Table 1 'HyperPipes' method stands out with the very high precision value (almost 0.87), but the recall value for this method is very low, just around 0.08. This means that even though this method is very precise, it is possible that it would not recommend any of the items to users. Therefore, 'HyperPipes' was not chosen as the best method. Our selection for the best method for classification of similarity vectors and rcbr^(u,h) calculation was 'Kstar' method. This method achieved the highest precision value (next to 'HyperPipes') among all tested methods (0.753), and the recall value was also satisfying (0.299). 'Kstar' is an instance-based classifier, which means that the class of the test instance is based upon the class of those training instances similar to it. It differs from other instance-based learners in that it uses an entropy-based distance function (for more details see [25]). We believe that this fact gives the ‘Kstar’ method an advantage over other methods in providing more accurate recommendation results.
b) Explanations of recommendations
Fig. 4. Portion of recommended items with explanation
To determine the optimal value of ηtexpl the whole range of possible values of ηtexpl, from -1.00 to 1.00 with a 0.01 step was tested. First we checked how many of the recommended items actually got any explanation for the recommendation. This means that at least one attribute value is identified as relevant for the recommendation. Results of this part of the evaluation are presented in Fig. 4, where rrItWExpl represents a portion of the recommended items with at least one attribute value identified as relevant. At ηtexpl value of 0.0 nearly 97% of the recommended items got an explanation for the recommendation. At ηtexpl value of 0.41 the portion of recommended items with an explanation fell below 50% and the portion decreased even more by pushing ηtexpl higher. From this part of the evaluation it can be concluded that ηtexpl value of 0.0 might be optimal for the generation of recommendation.
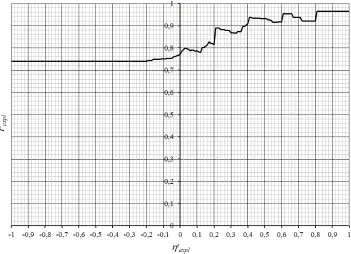
Even though the first part of the evaluation showed that our algorithm was able to generate explanations for most of the recommended items, it told us nothing about the accuracy of the identification. When ηtexpl is set very low, some attribute values will almost certainly get through the identification procedure, but they might not be relevant to users. Therefore, the precision of the identification of relevant attribute values (the portion of correctly identified relevant attribute values) were also calculated. Results of this part of the evaluation are presented in Fig. 5, where Pexpl represents a precision of the identification. In this phase of the evaluation, ratings of the attribute values that our algorithm identified as relevant were checked. Notice that the users did not rate all the attribute values presented to them, because some were not known to them. Only attribute values which users responded to were considered in this part of the evaluation. Results show that our algorithm for identification of relevant attribute values worked well at all the threshold values ηtexpl. Even at the ηtexpl value of 0.0, more than 77% of attribute values identified as relevant were really relevant. The precision got even higher when we set ηtexpl value higher and at the ηtexpl set to 0.8, the precision rose up to over 96%. This leads us to conclude that our algorithm is very accurate. This part of the evaluation showed that out of the tested ηtexpl values 0.8 is optimal.
If we compare the results of precision calculation and the portion of the recommended items that got explanation, the determined optimal ηtexpl values do not match. Although ηtexpl value 0.8 ensured very high success rate, only 19% of the recommended items recieved an explanation for recommendation. To determine the optimal ηtexpl value we considered another parameter - an average number of attribute values identified as relevant per each recommended item. From Fig. 4 we notice that the number of attribute values identified as relevant drastically decreased as ηtexpl got higher. This happened because at higher ηtexpl values, fewer attribute values got through the identification procedure. Figure 6 shows the results of the third part of the evaluation where NidAvRelRecIt represents an average number of attribute values identified as relevant for each recommended item that also received recommendation explanation.
Fig. 6. Average number of attribute values identified as relevant per each recommended item
number of attribute values identified as relevant per each of the recommended items rose up to more than 2.5 and at the 0.0 value of the threshold to more than 3.5. We believe that only one or two attribute values are normally relevant for users. Therefore the average number of attribute values identified as relevant at ηtexpl value of 0.0 seems to be too high. As far as the average number of attribute values identified as relevant is concerned, the optimal value of ηtexpl is in the range from 0.2 to 0.4, where the average is between 1.7 and 1.8.
By comparing the results of all three parts of the evaluation, we conclude that ηtexpl value of 0.3 is optimal for the best performance of the identification of relevant attribute values. Although it generates explanations for only approximately half of the recommended items, we think it is better that the identification is accurate and that it finds an appropriate number of attribute values. The threshold set at 0.3 ensures high precision of the identification (86%) and slightly less than two relevant attribute values per item on average. Evaluation of the algorithm for the generation of recommendations explanations showed that it produces good results and that it finds relevant attribute values for recommendations. Users' feedback to attribute values that the system identified as relevant was positive, which encourages us to believe that our suppositions when building this module were correct. Nevertheless, a more thorough survey will need to be performed to check whether the users' satisfaction with the recommender system usage has really improved with the addition of recommendations explanations.
Using feedback to explanations to improve the performance of the CBR recommender: In this part of the evaluation we checked whether using users' feedback to the attribute values presented in the explanations of the recommendations can improve the performance of the CBR recommender. We used these ratings to correct the calculation of a similarity of an attribute value with a model of a user. New similarity value of an attribute value is calculated with Eq. (6) where weighted sum is used to weigh the original similarity value and the rating of the similarity values obtained by the user.
We had two goals when performing this part of the evaluation. Mainly, our aim was to check if CBR performance (precision) improves by using attribute values ratings, and secondly, we wanted to find the best setup (optimal weighing) in the weighted sum in Eq. (6) for highest CBR precision. We tested several combinations of weights wη and wr. The sum of weights is always 1 and we tested values from 0.00 to 1.00
with a 0.01 step.
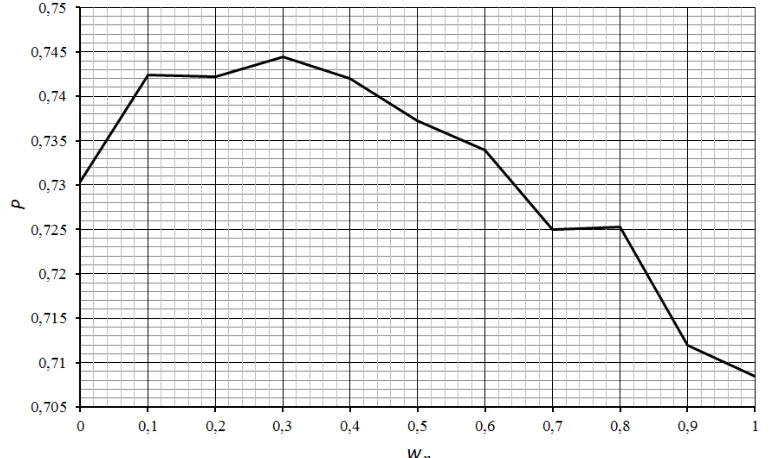
Fig. 7 shows the precision (P) values for all tested values of weights and Table 2 shows precision values for selected weights values. In Fig. 7 wη values are on the x axis, while wr values are shown in the
figure, as they are dependent on wη (the sum of weights is always 1).
Table 2. Correction of attribute values similarity-weights test for selected values
wη wr P
1.0 0.0 0.709
0.9 0.1 0.712
0.8 0.2 0.725
0.7 0.3 0.725
0.6 0.4 0.734
0.5 0.5 0.737
0.4 0.6 0.742
0.3 0.7 0.744
0.2 0.8 0.742
0.1 0.9 0742
Results show that the precision of CBR recommender is lowest when no correction of similarity values is performed. In this case wη is set to 1 and wr to 0 and the precision is slightly over 0.7. With wη,
decreasing the correction starts and the precision of the recommender increases. The highest precision is achieved when wη is set to 0.3 and wr to 0.7. In this case the precision of the system is 0.744. If we
continue with decreasing wη the precision also decreases and stops at 0.730 when the original similarity
values are no longer considered.
Fig. 7.Correction of attribute value similarity - weights test
Results also show that the differences in precision of the system with different values of weights are not very high. To explain this observation, the ratings given by users to attribute values directly (while responding to attribute values in explanations of recommendations) and the ratings given by user to items and which were only indirectly assigned to attribute values in items' descriptions were compared. Users rated attribute values with an average rating of -0.47 if rating it directly, while an average rating of attribute values received through ratings of items was -0.68 (ratings are on a -1 to 1 scale, as explained in section 02c). This shows that users rated attribute values higher when giving ratings directly to the attribute values, in comparison to ratings of items where we only assume that these ratings are also valid for attribute values. This is encouraging information as it proves that users liked the attribute values that we identified as relevant and are, therefore, generally, appropriate for explaining the recommended items. Higher average rating of directly rated attribute value also means that the performance of CBR recommender should improve when we use the direct ratings of attribute values. This proved to be the case, as the precision has increased by 0.04 when the correction was done. The improvement is, however, small. The precision of our system is quite high even without the correction of similarities (around 70% of correct rating estimations) and, on the other hand, the difference of ratings is relatively small (around 20% of one rating level on the rating scale on average) so higher performance improvements are not to be expected.
have shown that the correction of similarities achieves best results (highest recommender precision) if the original similarity values are weighed with a 0.3 weight, while the attribute value rating should be weighed with a 0.7 weight.
4. CONCLUSION
A content-based recommender system was built that enables personalized content retrieval in IPTV applications and was enhanced with the module for generating recommendations. This CBR system focused on finding the attribute values in the description of an item that a user had expressed a very high preference towards. A special similarity function was defined that detects these attribute values and ensures that they have a high influence on the predicted rating. Several classification methods were tested for the classification of similarity vectors and the CBR rating prediction and 'Kstar' (24) was found to be the most accurate.
Users' satisfaction with the system was improved by generating explanations for the recommended items. Explanations provided the users an insight into our content-based recommender algorithm and included the attribute values that should be the most relevant for the user when he/she decides to consume an item, for example, actors in the movie, directors, genre etc. The evaluation showed that the algorithm for identification of relevant attribute values achieves a high precision of identification, while ensuring explanations for the majority of the recommended items.
The basic CBR recommender achieved good results during the evaluation, but was further improved using feedback that users gave to attribute values presented in explanations of the recommended items. Although the increase in precision of the recommender system was small, we managed to prove that directly expressed opinion about the attribute values is indeed a more credible source of user information than the ratings that users give to items are and that it can be used to improve the performance of the recommender system.
Our future work will include a more thorough survey on improved users' satisfaction due to recommendations explanations and the implementation of the developed algorithms in a real life application. Besides a potentially much bigger set of users and content items to work with, it will also be necessary to address the issue of a suitable presentation of recommended items and a presentation of recommendations explanations to users.
Acknowledgement: This work would not have been possible without the grant of Slovenian Research Agency No. R-784 and the cooperation with SiOL Company.
REFERENCES
1. Amazon. (n.d.). Retrieved March 30, 2011, from http://www.amazon.com 2. Last.fm. (n.d.). Retrieved March 30, 2011, from http://www.last.fm 3. Netflix. (n.d.). Retrieved March 30, 2011, from http://www.netflix.com
4. Zimmerman, J., Kurapati, K., Buczak, A., Schaffer, D., Martino, J. & Gutta, S. (2004). TV personalization system: design of a TV show recommender engine and interface. Kluwer Academic Publishers.
5. Berkovsky, S., Kuflik, T. & Ricci, F. (2006). Enhancing privacy while preserving the accuracy of collaborative filtering. Proceedings of the 2006 ECAI Workshop on Recommender Systems, (pp. 49-53).
6. O'Mahony, M., Hurley, N. & Silvester, G. (2006). Attacking recommender systems. Proceedings of the ECAI 2006 Workshop on Recommender Systems, (pp. 24-28).
8. Bellifelime, F., Bianchi, F., Charlton, P., Kamyab, K. & Arafa, Y. (2003). AVEB phase 1 demonstrator. deliverable no. A0317/ITC/WP1/DSI003b1, project report AC 317 FACTS.
9. SiOL. (n.d.). Retrieved March 30, 2011, from http://www.siol.net
10. Breese, J., Heckerman, D. & Kadie, C. (1998). Empirical analysis of predictive algorithms for collaborative filtering. Proceedings of the 14th Conference on Uncertainty in Artificial Intelligence. Madison: Morgan Kaufmann Publishers.
11. Sarwar, B., Karypis, G., Konstan, J. & Riedl, J. (2001). Item-based collaborative filtering recommendation algorithms. Proceedings of the 10th International Conference on World Wide Web, (pp. 285-295).
12. Bezzera, B., Carvalho, F., Ramalho, G. & Zucker, J. D. (2002). Speeding up recommender systems with meta-prototypes. Lect. Notes Comput. Sci., Adv. Artif. Intell., 227-236.
13. Uchyigit, U. & Clark, K. (2002). An agent based electronic program guide. Proceedings of the Workshop on Personalization in Future TV.
14. Salter, S. & Antonopoulos, N. (2006). Cinemascreen recommender agent: combining collaborative and content-based filtering. Intell. Syst., Vol. 21, pp. 35-41.
15. PTVPlus. (n.d.). Retrieved March 30, 2011, from http://www.ptvplus.com 16. DirecTV. (n.d.). Retrieved March 30, 2011, from http://www.directv.com
17. Masthoff, J. (2004). Group modeling: selecting a sequence of television items to suit a group of viewers. User Model. User-Adapted Interact., Vol. 14, No. 1, pp. 37-85.
18. LIVE. (n.d.). Retrieved March 30, 2011, from http://www.siol.net
19. Pogacnik, M., Tasic, J. & Kosir, A. (2004). Optimization of multi-attribute user modeling approach. Int. J. Electron. Commun., Vol. 58, pp. 402-412.
20. Witten, I. & Frank, E. (2005). Practical machine learning tools and techniques (2 ed.). San Francisco: Morgan Kaufmann.
21. Cramer, H., Evers, V., Ramlal, S., van Someren, M., Rutledge, L., Stash, N., et al. (2008). The effects of transparency on trust in and acceptance of a content-based art recommender. User Model. User-Adapted Interact., Vol. 5, pp. 455-496.
22. Zolghadri-Jahromi, M. & Valizadeh, M. R. (2006) A proposed query-sensitive similarity measure for information retrieval. Iranian Journal of Science & Technology, Transaction B: Engineering, Vol. 30, No. B2, pp. 171-180.
23. Herlocker, J., Konstan, J., Terveen, L. & Rield, J. (2004). Evaluating collaborative recommender systems. ACM Trans. Inf. System, Vol. 22, No. 1, pp. 5-53.
24. Miller, G. (1956). The magical seven, plus or minus two: some limits in our capacity for processing information. APA Psychol. Rev., Vol. 63, pp. 81-97.