Optimization of ammonia removal in an integrated fix-film activated
sludge using response surface methodology
Hooshyar Hossini Hooshyar Hossini Hooshyar Hossini Hooshyar Hossini1111,
, ,
, Abass RezaeeAbass RezaeeAbass RezaeeAbass Rezaee1111, Reza Barati
, Reza Barati , Reza Barati
, Reza Barati----RoshvanloRoshvanloRoshvanloRoshvanlo1111
1 Department of Environmental Health, School of Medicine, Tarbiat Modares University, Tehran, Iran
Abstract Abstract Abstract Abstract
In this work, removal of ammonia from synthetic wastewater using integrated fixed-film activated sludge (IFAS) process was optimized using response surface methodology (RSM). The main operating parameters such as ammonia concentration rate (ALR) and hydraulic retention time (HRT) were optimized to acquire the maximum removal efficiency. The linear, 2FI, quadratic, mean, and cubic models were utilized for modeling of the parameters. Residual nitrate and nitrite were determined as the byproducts. The results showed that the actual data fitted well with the predicted results. The maximum ammonia removal achieved using mean, linear, 2FI, quadratic, and cubic models were 59.88, 79.05, 79.32, 77.11, and 78.65%, respectively. Nitrate and nitrite were determined in ammonia concentrations of higher than 100 mg/l. The obtained results showed that RSM is a suitable technique for the optimization of conditions for the maximum removal of ammonia.
KEYWORD KEYWORD KEYWORD
KEYWORDS:S:S:S: Ammonia, Wastewater, Optimization, Biofilms, Optimization
Date of submission: Date of submission: Date of submission:
Date of submission: 17 Oct 2014, Date of acceptance:Date of acceptance:Date of acceptance:Date of acceptance: 18 Jan 2015
Citation: Hossini H, Rezaee A, Barati-Roshvanlo R. Application of response surface methodology for optimization of ammonia removal in integrated fixed-film activated sludge. J Adv Environ Health Res 2015; 3(2): 130-8.
Introduction
0F1
Nitrogen compounds such as
ammonium/ammonia ions are the main pollutants in water and wastewater. Discharge of ammonia into environmental resources can lead to various health and environmental problems such as eutrophication, oxygen depletion, and toxicity.1 Water and wastewater
containing large quantities of
ammonium/ammonia ions can have adverse effects on human health (metabolic diseases) and the environment (such as eutrophication and overgrowth of plants).2 Ion exchange,
electrodialysis (ED), reverse osmosis,
electrocoagulation, and biological treatments
Corresponding Author: Corresponding Author: Corresponding Author: Corresponding Author:
Abbas Rezaee
Email: [email protected]
are proposed for the removal of ammonia from
aqueous sources.3 Among the proposed
techniques, biological processes have various advantages such as their low cost, low operation handling, reliability, and efficacy,
and being environmentally friendly.
Conventional biological removal of
nitrogenous compounds is performed using a two-step process involving nitrification and denitrification.4 The two-step nitrification–
denitrification process using ammonia and nitrite oxidizing biomass is preformed via conversion of ammonium (NH4+) to nitrate
(NO3-), and finally, to N2 gas.5-7 These two
stages are illustrated as the following reactions:
NH O NO 2H H(1)
No O NO 2H H (2)
Denitrification pathway can be summarized by the following reactions:
No
!H e
# $% &
'N H O (3)
No H e # $% &
!N H O (4)
Reactions 3 and 4, respectively, show anoxic growth on nitrate and anoxic growth on nitrite. Nitrification and denitrification are conducted simultaneously for nitrogen removal, but efficient and reliable nitrogen removal requires long solid residence time. Fixed-film processes such as integrated fixed-film activated sludge (IFAS) or moving bed biofilm reactors (MBBR) have been shown to be successful in simultaneous nitrification and denitrification.8
The enhanced removal of chemical oxygen
demand (COD) and biological nutrient
(nitrogen and phosphorus) removal have been well demonstrated using IFAS.9 Optimization of
operating parameters is an important method in various fields of sciences. Presently, response
surface methodology (RSM) is applied
successfully in many scientific fields such as biology, chemistry, medicine, and economy.10
RSM was proposed by Box et al. in the 1950s.11
RSM is based on an experimental design with the final goal of evaluating optimal functioning
of industrial facilities, using minimum
experimental effort.10. The aim of the present
study was to optimize ammonia concentration and hydraulic retention time (HRT) for the determination of the best conditions of ammonia removal through IFAS process. To the best our knowledge and according to the literature review, the optimization of operating factors of ammonia removal through IFAS process has not been reported.
Materials and Methods
Bench-scale experiments were conducted using a plexiglass reactor with total volume of 13 l (100 × 10 × 15 cm dimensions) (Figure 1). All chemicals used in this work were analytical
reagent grade and they were used without further purification. A general medium containing 500 mg/l dextrose, 12 mg/l potassium dihydrogen phosphate, 16 mg/l dipotassium phosphate, 18 mg/l calcium chloride, and 24 mg/l magnesium sulfate was used at the start-up. The synthetic wastewater was continuously pumped to the reactor for 42 days. The HRT of the reactor was adjusted at 12 hours. The pH was adjusted normally at 7 ± 0.2. The mixed liquor suspended solids (MLSS) was adjusted at 2.5 g/l with HRT of 24 hours start-up period. All experiments were performed at room temperature (25 ± 1 oC).
Ammonia, nitrite, nitrate, and COD were analyzed according to standard methods.
Nitrate was determined using
spectrophotometer at λmax of 220 nm. The
Nitrite content was analyzed through
colorimetric method and sulfanilamide and
naphthylethylendiamine dihydrochloride
regents at λmax of 543 nm. The determination of ammonia content was conducted through phenate method.
Figure 1. Schematic representation of experimental setup for integrated fixed-film activated sludge (IFAS) process [1) feed tank, 2)
fixed film, 3) media, 4) sedimentation tank, 5) returne active sludge, 6) internal recirculation, 7)
RSM offers an empirical relationship between the response function and the independent variables. In this study, the coefficients of the response functions for various dependent variables were determined with the response functions using the Design-Expert regression software (trial version, Stat-Ease Inc., Minneapolis, MN, USA) regression program. The least squares technique was used to evaluate polynomial approximation. The central composite design (CCD) was used to analyze the main parameters (x1: ammonia concentration, x2: HRT). Wastewater was prepared with COD of 500 mg/l and different concentrations of ammonia (20, 43, 60, 88, and 100 mg-N/l). According to the primary design, HRT was adjusted in 4, 5.75, 10, 14.25, and 16 hours for -α, -1, 0, +1, +α, respectively. Based on the experimental runs, a total of 13 runs of the CCD experimental design and response are presented in table 1.
Results and Discussion
During the start-up period, ~89.5% ammonia removal was achieved at a constant ammonia
load of about32 mg-N/l and HRT of 16 hours.
The percentage of COD removal was determined between 66.8 to 94.86% during 42 days since the start-up.
Based on the experimental runs, a total of 13 runs of the CCD experimental design were
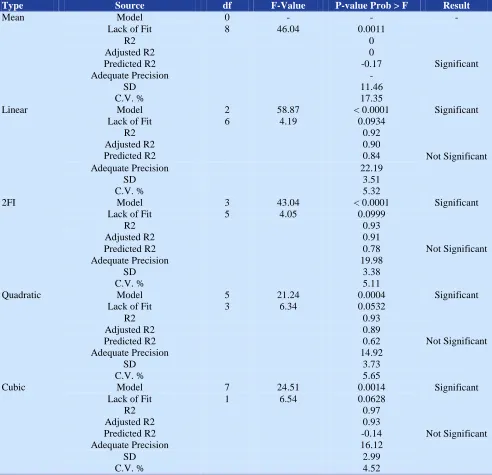
conducted. The coefficient of variation (CV) is the value of the reproducibility of the model and should be lower than 10%. The predicted R-squared amount was agreed with the adjusted squared. The difference between R-squared and adjusted R-R-squared values should not be more than 0.2. The analysis of variables with statistical values and constant are presented in table 2. A significant lack of fit implies that there may be some systematic variation unaccounted for in the hypothesized model.12 Ammonia removal efficiency was
predicated based on the final equation for coded and actual factors. The final first-order and second-order (polynomial) regression in terms of coded and actual factors for all applied models are represented by the following equations.
Final equations in terms of coded factors:
RaMean = +66.06 (5)
Ra Linear =+66.06 – (2.50 × x1) + (13.25 × x2) (6)
Ra2FI = +66.06 – (2.50 × x1) + (13.25 × x2) +
(2.28 × x1 × x2) (7)
RaQuadratic = +65.79 – (2.50 × x1) + (13.25 × x2)
+ (2.28 × x1 × x2) – (0.32 × x12) + (0.76 × x22) (8)
RaCubic = +65.79 – (1.82 × x1) + (10.77 ×
x2) + (2.28 × x1 × x2) - (0.32 × x12) +
(0.76 × x22) + (4.96 × x12 × x2) – (1.35 × x1 ×
x22) (9)
Table 1. The central composite design (CCD) using natural and coded factors
Run Precedence Ammonia concentration (mg-N/L) HRT (hour) X1 X2
1 11 88 5.75 1 -1
2 4 60 10 0 0
3 5 60 10 0 0
4 12 88 14.25 1 1
5 13 100 10 2 0
6 10 60 16 0 2
7 6 60 10 0 0
8 7 60 4 0 -2
9 3 32 14.25 -1 1
10 8 60 10 0 0
11 9 60 10 0 0
12 2 32 5.75 -1 -1
13 1 20 10 -2 0
Table 2. Statistical analysis of models
Type Source df F-Value P-value Prob > F Result
Mean Model 0 - - -
Lack of Fit 8 46.04 0.0011
Significant
R2 0
Adjusted R2 0
Predicted R2 -0.17
Adequate Precision -
SD 11.46
C.V. % 17.35
Linear Model 2 58.87 < 0.0001 Significant
Lack of Fit 6 4.19 0.0934
Not Significant
R2 0.92
Adjusted R2 0.90
Predicted R2 0.84
Adequate Precision 22.19
SD 3.51
C.V. % 5.32
2FI Model 3 43.04 < 0.0001 Significant
Lack of Fit 5 4.05 0.0999
Not Significant
R2 0.93
Adjusted R2 0.91
Predicted R2 0.78
Adequate Precision 19.98
SD 3.38
C.V. % 5.11
Quadratic Model 5 21.24 0.0004 Significant
Lack of Fit 3 6.34 0.0532
Not Significant
R2 0.93
Adjusted R2 0.89
Predicted R2 0.62
Adequate Precision 14.92
SD 3.73
C.V. % 5.65
Cubic Model 7 24.51 0.0014 Significant
Lack of Fit 1 6.54 0.0628
Not Significant
R2 0.97
Adjusted R2 0.93
Predicted R2 -0.14
Adequate Precision 16.12
SD 2.99
C.V. % 4.52
Final equations in terms of actual factors:
RaMean = +66.065 (10)
RaLinear = +40.15 – (0.088 × ammonia
concentration) + (3.12 × HRT) (11)
Ra 2FI = +51.52 – (0.28 × ammonia
concentration) + (1.98 × HRT) + (0.019 × ammonia concentration × HRT) (12)
RaQuadratic = + 54.06 – (0.23 × ammonia
concentration) + (1.14 × HRT) + (0.019 × ammonia concentration × HRT) – (3.94 E-004 × ammonia concentration2) + (0.042 × HRT2) (13)
RaCubic= Not available for aliased models.
(14)
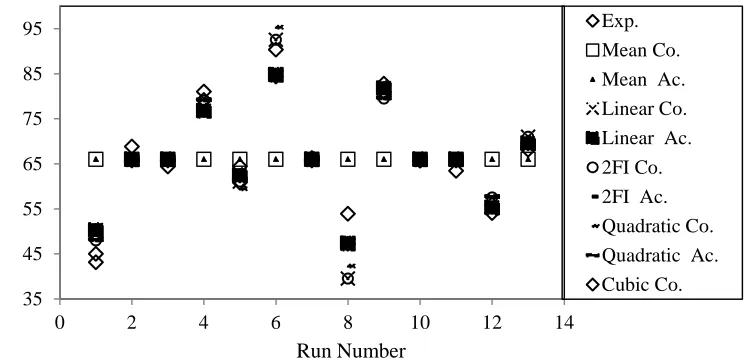
removal data. According to the obtained results, a uniform removal efficiency pattern was provided for each run (Figure 2).
The adequacy of a model can be evaluated by diagnostic plots such as a normal
probability plot of the studentized
residuals and a plot of predicted versus actual values.10
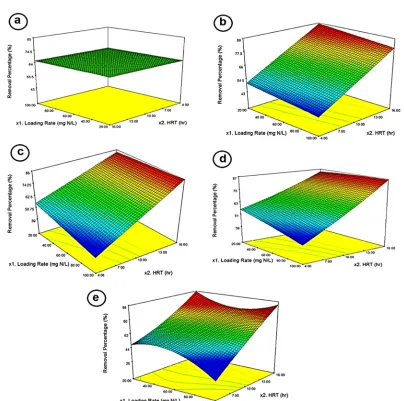
Figure 3 illustrates three dimensional graphics response surface plots of the main parameters and their interactions for ammonia removal efficiency.
The mean model did not change in efficiency for different amounts of ammonia concentration and HRT (Figure 4a). However, in the other models, the ammonia efficiency increased with the increasing of HRT at lower ammonia concentrations (Figures 4b-e). To create favorable conditions for nitrification and denitrification, continuous operation and a relatively long HRT are required.13 HRT is the
main operating variable for biological
stabilization. Moreover, solid retention time (SRT) is one of the major factors that contribute to different treatment performances and biomass characteristics.13 It has been reported
that complete nitrification occurred when HRT was longer than 3 hours. The total nitrogen
removal rate was low at HRT of less than 3 hours due to limited partial nitrification.14
Rostron et al. similarly reported low nitrification at HRT of less than 3 hours. In this condition, very little nitrate was produced.15 In
the numerical optimization, a minimum and a maximum level have to be provided for each parameter.16 The level of all parameters within
the range of investigation was optimized for maximum ammonia removal. Under optimal conditions, maximum ammonia removal was predicted for each model.
In the numerical optimization, a minimum and a maximum level must be provided for each parameter. For several responses, the goals are combined into an overall desirability function.16 Desirability is defined as an
objective function that ranges from zero (0.00), outside of the limits, to one (1.00), at the goal. The program seeks to maximize this function. By starting from several points in the design space, chances for finding the best local maximum improve.17 Level of all parameters
within the range of investigation was set for maximum ammonia removal. With regard to numerical optimization, at optimal conditions, the maximum ammonia removal value was predicted for each model (Table 3).
Figure 2. Ammonia removal efficiency pattern for applied models 35
45 55 65 75 85 95
0 2 4 6 8 10 12 14
Exp.
Mean Co.
Mean Ac.
Linear Co.
Linear Ac.
2FI Co.
2FI Ac.
Quadratic Co.
Quadratic Ac.
Cubic Co.
Run Number
P
re
di
ct
ed
re
m
ov
al
e
ff
ic
ie
nc
Figure 3. Ammonia byproducts from integrated fixed-film activated sludge (IFAS) process at different loading rates of ammonia
To approve the validity of the optimized points, an experiment was carried out with the parameters suggested by the model. The obtained result shows 95% similarity. The results confirmed the validity of the model, and the experimental values were determined and found to be quite close to the predicted
values. Under these conditions, the
experimental value for ammonia removal was found to be 59.88, 79.05, 79.32, 77.11, and 78.65% for mean, linear, 2FI, quadratic, and cubic models, respectively. The obtained results showed that an efficient nitrification
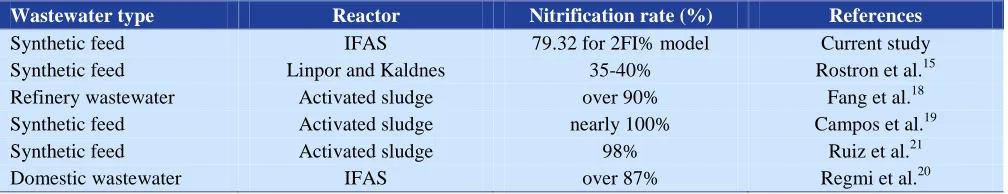
potential (79.32% for 2FI model) is provided by IFAS reactor. Similar to the current study, many researchers have studied the potential of nitrification using different biosystems that can be seen in table 4.15, 18-21
In order to monitor ammonia conversion to N2 gas and nitrate, residual nitrate/nitrite (sum
of NO2- and NO3-) was determined for high
Figure 4. Three-dimensional graphics of
response surface for ammonia removal
efficiency in (a) mean, (b) linear, (c) 2FI, (d) quadratic, and (e) cubic models
determined at ~26.42 mg/l. In most
wastewater treatment plants, nitration is presented by nitrogen oxidizing bacteria such as the genus Nitrospira and Nitrobacter.7 From
the results it can be seen that a long HRT is required to treat the higher ammonium concentrations. This can occur due to the very slow growth of autotrophic nitrifiers. In the case of Nitrobacter sp. (as a dominant species
of nitrite oxidizing bacteria), generation times have been reported at about 18 and 69 hours, and this can provide a low cell yield.2 On the
other hand, during short HRTs, a small amount of ammonia is converted to nitrite and other
intermediates, which implies that the
denitrifying bacteria has limited access to electron sources.2
Conclusion
The results of this study showed that maximum ammonia removal was acquired at 59.88, 79.05, 79.32, 77.11, and 78.65% in the mean, linear, 2FI, quadratic, and cubic models, respectively. High correlation coefficient (r2)
was observed for linear (0.92), 2FI (0.93), quadratic (0.93), and cubic models (0.97). Therefore, the actual data fitted well with the predicted results. A higher amount of ammonia byproducts were observed at 100 mg-N/l of ammonia. At this ammonia concentration, total concentrations of nitrate/nitrite were determined at about 26.42 mg/l.
Conflict of Interests
Authors have no conflict of interests.Table 3. Numerical optimal conditions and maximum predicted removal
Model Ammonia concentration (mg-N/l) HRT (h) Removal Efficiency (%) Desirability
Mean 60 8.06 66.06 0.55
Linear 32 14.25 81.81 0.93
2FI 32 14.25 79.53 0.88
Quadratic 50 14.25 79.84 0.89
Cubic 32 14.25 82.86 0.96
HRT: Hydraulic retention time
Table 4. Literature review
Wastewater type Reactor Nitrification rate (%) References
Synthetic feed IFAS 79.32 for 2FI% model Current study
Synthetic feed Linpor and Kaldnes 35-40% Rostron et al.15
Refinery wastewater Activated sludge over 90% Fang et al.18
Synthetic feed Activated sludge nearly 100% Campos et al.19
Synthetic feed Activated sludge 98% Ruiz et al.21
Domestic wastewater IFAS over 87% Regmi et al.20
IFAS: Integrated fixed- film activated sludge 0
5 10 15 20 25 30
20 32 60 88 100
N
O3
-/
N
O2
-(
m
g
/l
)
Acknowledgements
The authors wish to acknowledge the financial support of Tarbiat Modares University and Northern Khorasan Water and Wastewater Company (Agreement No. 12377/15/91).
References
1. Van Hulle SWH, Vandeweyer HJP, Meesschaert BD, Vanrolleghem PA, Dejans P, Dumoulin A. Engineering aspects and practical application of autotrophic nitrogen removal from nitrogen rich streams. Chemical Engineering Journal 2010; 162(1): 1-20.
2. Hossini H, Rezaee A, Ayati B, Mahvi AH. Simultaneous nitrification and denitrification using a polypyrrole/microbial cellulose electrode in a membraneless bio-electrochemical system. RSC Adv 2015; 5(89): 72699-708.
3. Li M, Feng C, Zhang Z, Yang S, Sugiura N. Treatment of nitrate contaminated water using an electrochemical method. Bioresour Technol 2010; 101(16): 6553-7.
4. Virdis B, Rabaey K, Rozendal RA, Yuan Z, Keller J. Simultaneous nitrification, denitrification and carbon removal in microbial fuel cells. Water Res 2010; 44(9): 2970-80. 5. Kaelin D, Manser R, Rieger L, Eugster J,
Rottermann K, Siegrist H. Extension of ASM3 for two-step nitrification and denitrification and its calibration and validation with batch tests and pilot scale data. Water Res 2009; 43(6): 1680-92. 6. Iacopozzi I, Innocenti V, Marsili-Libelli S, Giusti E. A modified Activated Sludge Model No. 3 (ASM3) with two-step nitrification-denitrification. Environmental Modelling & Software 2007; 22(847): 861.
7. Francis CA, Roberts KJ, Beman JM, Santoro AE, Oakley BB. Ubiquity and diversity of ammonia-oxidizing archaea in water columns and sediments of the ocean. Proc Natl Acad Sci U S A 2005; 102(41): 14683-8.
8. Onnis-Hayden A, Majed N, Schramm A, Gu AZ. Process optimization by decoupled control of key microbial populations: distribution of activity and abundance of polyphosphate-accumulating organisms and nitrifying populations in a full-scale IFAS-EBPR plant. Water Res 2011; 45(13): 3845-54.
9. Rosso D, Lothman SE, Jeung MK, Pitt P, Gellner WJ, Stone AL, et al. Oxygen transfer and uptake, nutrient removal, and energy footprint of parallel full-scale IFAS and activated sludge processes. Water Res 2011; 45(18): 5987-96.
10.Jiménez-Contreras E, Bailón-Moreno R, Torres-Salinas D, Ruiz-Baños R, Ruiz-Pérez R, Moneda-Corrochano DL. Response Surface Methodology and its Application in Evaluating Scientific activity. Scientometrics 2009; 79(1): 201-18.
11.Box GE, Wilson KB. On the Experimental Attainment of Optimum Conditions. Journal of the Royal Statistical Society 1951; 13(1): 1-45. 12.Bashir MJK, Aziz HA, Yusoff MS, Adlan M.
Application of response surface methodology (RSM) for optimization of ammoniacal nitrogen removal from semi-aerobic landfill leachate using ion exchange resin. Desalination 2010; 254(1−3): 154-61.
13.Kim YM, Park D, Jeon CO, Lee DS, Park JM. Effect of HRT on the biological pre-denitrification process for the simultaneous removal of toxic pollutants from cokes wastewater. Bioresour Technol 2008; 99(18): 8824-32.
14.Cho S, Fujii N, Lee T, Okabe S. Development of a simultaneous partial nitrification and anaerobic ammonia oxidation process in a single reactor. Bioresour Technol 2011; 102(2): 652-9.
15.Rostron WM, Stuckey DC, Young AA. Nitrification of high strength ammonia
wastewaters: comparative study of
immobilisation media. Water Res 2001; 35(5): 1169-78.
16.Mourabet M, El Rhilassi A, El Boujaady H, Bennani-Ziatni M, El Hamri R, Taitai A. Removal of fluoride from aqueous solution by adsorption on hydroxyapatite (HAp) using response surface methodology. Journal of Saudi Chemical Society 2012.
17.Mirazimi SMJ, Rashchi F, Saba M. Vanadium removal from roasted LD converter slag: Optimization of parameters by response surface methodology (RSM). Separation and Purification Technology 2013; 116: 175-83.
Research 1993; 27(12): 1761-5.
19.Campos JL, Mosquera-Corral A, Sanchez M, Mendez R, Lema JM. Nitrification in saline wastewater with high ammonia concentration in an activated sludge unit. Water Res 2002; 36(10): 2555-60.
20.Regmi P, Thomas W, Schafran G, Bott C, Rutherford B, Waltrip D. Nitrogen removal
assessment through nitrification rates and media biofilm accumulation in an IFAS process demonstration study. Water Res 2011; 45(20): 6699-708.
![Figure 1. Schematic representation of returne active sludge, 6) internal recirculation, 7) activated sludge (IFAS) process [1) feed tank, 2) fixed film, 3) media, 4) sedimentation tank, 5) experimental setup for integrated fixed-film blower, 8) air diffuser]](https://thumb-us.123doks.com/thumbv2/123dok_us/30513.2003515/2.595.314.548.457.667/schematic-representation-recirculation-activated-sedimentation-experimental-integrated-diffuser.webp)