Please cite this article as: G. V. R. Sagar, T. Debela, Implementation of Optimal Load Balancing Strategy for Hybrid Energy Management System in DC/AC Microgrid with PV and Battery Storage, International Journal of Engineering (IJE), IJE TRANSACTIONS A: Basics Vol. 32, No. 10, (October 2019) 1437-1445
International Journal of Engineering
J o u r n a l H o m e p a g e : w w w . i j e . i rImplementation of Optimal Load Balancing Strategy for Hybrid Energy Management System in
DC/AC Microgrid with PV and Battery Storage
G. V. R. Sagar*a, T. Debelab
a Ravindra College of Engineering for Women, India b Haramaya University, Ethiopia
P A P E R I N F O
Paper history: Received 17 April 2019
Received in revised form 07 July 2019 Accepted 29 July 2019
Keywords:
Battery Energy Storages System Energy Management Microgrids
Power Electronic Converters Maximum Power Point Tracking
A B S T R A C T
The proposed paper presents the DC/AC microgrid modeling using the Energy storage units and photovoltaic (PV) panels. The modal consists of a two stage power conversion. The power is supplied to the both DC and AC loads by this PV solar panels. The suitable way to explore the PV generation model is by using manufacturer datasheet. A bidirectional converter is connected to the battery storage system and dc bus. To keep the bus voltage stable, the storage system absorbs the excess power whenever generation is more and delivers power to the load when generation is less. This system eliminates hazards of islanding by supply the local loads continuously incase of grid discontinuity. This paper emphasizes on control and stability of dc bus voltage and energy management scheme. Matlab/Simulink is used for integration of system modeling and efficiency of the system is verified by simulation.
doi: 10.5829/ije.2019.32.10a.13
1. INTRODUCTION1
In the conventional power generation system using fossil fuels have many drawbacks like environmental pollution, high price of fuel costs, limited resources, and also the demand of energy is increasing nowadays. To reduce the reliance on fossil fuels and power generation from renewable energy resources, the best alternative is solar power. Consequently, these resources are environmental friendly [1], clean and plenty in nature. However, the varying output with the fluctuation of the environmental condition like solar irradiation and temperature of the solar energy system is the main drawback. To overcome this drawback, solar PV, battery energy storage system (BESS) and ac grid microgrid system is one of the ultimate solutions for managing the energy production from renewable energy source to assure the load demand. The increased efficiency and well balanced stability of the power supply for different load needs are achieved by an optimum grouping and integration of well-intended sizing PV, battery and ac grid system for a given location. Many research studies on modeling, designing and simulation of hybrid power energy systems have been
*Corresponding Author Email:[email protected] (G. V. R. Sagar)
reported in [2-7]. In [8] the wind farm synergy to maintain the fluctuating power of the wind farm and a control technique for optimum utilization of the battery energy storage with optimum control technique was developed. The conventional feedback-based control approaches which include the operating constraints of BESS such as SOC (state of charge) limit, charge/discharge rate, and lifetime was used in the study.
Modeling and performance analysis of the
Wind/Solar/battery hybrid microgrid system to boost the use of renewable energy source for matching the load demand in residential application was proposed in [9]. In [10], modeling and study of battery energy storage system for integrating intermittent renewable energy resources with energy storage for grid connected systems was presented.
under uneven environmental conditions the load can be supplied from BESS. Whenever, if SOC of the battery energy is smaller than 60% then, the ac grids supply power to the load. In case of power surplus after charging battery the extra energy is also sold to the grid. To avoid hazard of islanding, using pulse width modulation the ac load is fully supplied power from the dc grid. Thus in case of grid interruptions, PV and BESS supplies power continues to ac load.
This paper is written in four sections. Section II explains architecture of AC/DC microgrid. Validation of proposed work by simulation is covered in section III and section IV concludes the work.
2.DC/ACMICROGRIDARCHITECTURE
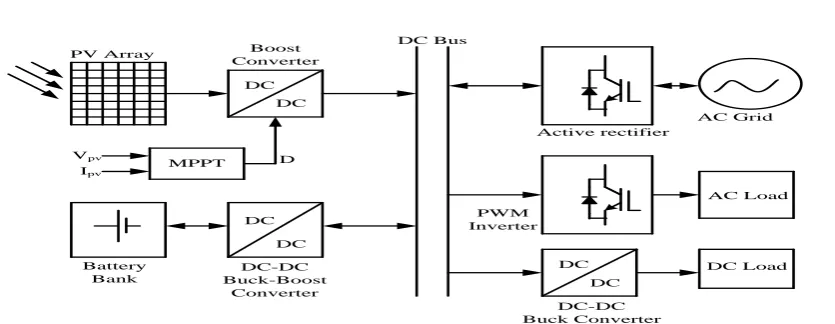
The complete architecture of the DC/AC micro grid structure proposed in this work is illustrated in Figure 1. It comprises three main blocks like PV power generation, battery energy storage system, ac grid and loads (both ac and dc loads). The dc bus acts as pipelined between PV generation unit DC/DC boost converter with MPPT function. Using bidirectional mode via DC/DC converter, the BESS can store energy and deliver/take power to/from the dc bus in discharging and charging. Based on the PV and BESS standing as well as the load demands, the AC grid can deliver power to or receive power from the dc micro grid via bidirectional AC/DC rectifier/inverter. The detailed operation and control of each block is explained in the continuing sections.
2. 1. Control of PV System In general the energy transfer efficiency (i.e. solar power into electrical power) is poor for photovoltaic plants. Therefore, it is necessary to fully recover the available entire mechanical energy into electrical energy. Accordingly, the PV system runs at the Peak Power Point (PPP). For this reason, Perturb and Observe (P&O) based Maximum Power Point Tracking (MPPT) is included in the boost converter. The duty cycle of the MPPT converter is directly used as a control parameter to control the PV system is the direct duty ratio error as shown in Figure 2 [11].
Maximum Power Point Tracking Equation (1) (a) & (b) for solar:
𝛥𝐼𝑝𝑣 = 𝐼𝑝𝑣(𝑘) − 𝐼𝑝𝑣(𝑘 − 1) (1a)
𝛥𝑉𝑝𝑣 = 𝑉𝑝𝑣(𝑘) − 𝑉𝑝𝑣(𝑘 − 1) (1b)
where, IPV (k) and VPV (k) are the instantaneous sampled current and voltage of the solar array.
The governing Equations (2) (a), (b) & (c) are in C-based MPPT algorithm.
𝛥𝐼𝑝𝑣
𝛥𝑉𝑝𝑣= −
𝐼𝑝𝑣
𝑉𝑝𝑣, 𝑎𝑡 𝑀𝑃𝑃𝑇 (2a)
𝛥𝐼𝑝𝑣 𝛥𝑉𝑝𝑣> −
𝐼𝑝𝑣
𝑉𝑝𝑣 (2b)
𝑒𝑓𝑡 𝑜𝑓 𝑀𝑃𝑃𝑇 𝑜𝑛 𝑃𝑝𝑣𝑣
𝛥𝑉𝑝𝑣 𝑐𝑢𝑟𝑣𝑒
𝛥𝐼𝑝𝑣
𝛥𝑉𝑝𝑣< −
𝐼𝑝𝑣
𝑉𝑝𝑣 (2c)
PV Array
MPPT
Vpv
Ipv
Battery Bank
Boost Converter
DC-DC Buck-Boost
Converter
DC-DC Buck Converter
AC Load
DC Load PWM
Inverter
AC Grid Active rectifier
DC
DC
DC
DC
DC
DC D
DC Bus
Figure 1. The proposed system architecture
MPPT Control
PV System d PWM
Vpv ipv
Figure 2. MPPT control with direct duty ratio
𝑟𝑖𝑔ℎ𝑡 𝑜𝑓 𝑀𝑃𝑃𝑇 𝑜𝑛 𝑃𝑝𝑣 𝑣
𝛥𝑉𝑝𝑣 𝑐𝑢𝑟𝑣𝑒 where Δ=change of current or voltage
duty ratio is:
𝐷𝑟𝑒𝑓(𝑘) = 1 −𝑉𝑝𝑣𝑟𝑒𝑓(𝑘)𝑉𝑑𝑐𝑟𝑒𝑓(𝑘) (3)
This reference duty ratio is used to generate switching logic for boost converter.
Modeling of DC/DC Boost Converter: 𝐿𝑑𝑖𝑙
𝑑𝑡 = 𝑉𝑖 − (1 − 𝑑)𝑣𝑜 (4)
𝐶𝑑𝑉𝑜
𝑑𝑡 = (1 − 𝑑)𝑖𝑙 − 𝑖𝑜 (5)
In boost converter model Equations (4) and (5), where vi
and vo are the input and output voltages, respectively, iL is
the inductor current, io is the output current flowing into
the dc-link, d is the duty ratio, L is the inductance, and Co
is the output capacitance.
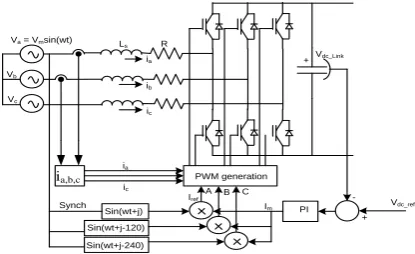
2. 2. Control of Grid Connected Converter The supply network and DC network are connected by a bidirectional AC/DC rectifier shown in Figure 3. The simple control technique of active rectifier comprises of regulating output dc voltage at a specified limit with a feedback loop rule [12]. This DC voltage is measured and compared with the reference V*dc. The error or difference signal generated from this comparison serves to control the switches of the PWM rectifier. The power flow is determined based on this DC link voltage value. When the DC load current I0 is positive (rectifier operation), the capacitor is discharged and the error signal becomes positive. Consequently, the control block receives power from the supply by generating the corresponding PWM signals for the switches of the converter. On the other hand, the capacitor is overcharged when I0 becomes negative (inverter operation), and the error signal requests the controller to discharge the capacitor return power to the alternating current network.
2. 3. Control of Load Side Voltage Source Inverter
For ac loads, the voltage source inverter (VSI) is used to supply power. At load side frequency and voltage is regulated using this inverter function. A sine pulse width
ia,b,c
Sin(wt+j) Va = Vmsin(wt)
Vb
Vc
Sin(wt+j-120)
Sin(wt+j-240)
PI PWM generation
Iref
A B C ia
ib
ic
Ls R
ia
ic
Vdc_Link
+
Vdc_ref
-+ Im
Synch
Figure 3. Current controlled bidirectional VSI
modulation (SPWM) is used in this paper to maintain the output voltage disparity due to power fluctuation or load dynamics.
Control Approach for Three-Phase VSC:
The three-phase VSC is controlled to achieve the objective of reactive power compensation, harmonics mitigation, grid current balancing, and regulation of dc link voltage to desiredadjustable reference value. A total of nine quantities are sensedto control the SECS, which are line voltages (vsaband vsbc), dc link voltage (vdc) and grid currents (igaand igb), load currents (iLaand iLb), PV array voltage (vPV), and PV array current (iPV). The phase voltages are estimated from the sensed line voltages, and then the synchronization signals are estimated from the phase voltages. To estimate the synchronization signals, at first amplitude of phase voltages is estimated. The amplitude of phase voltages is estimated as given in Equation (6).
𝑉𝑧 = √(2(𝑣𝑠𝑎2+𝑣𝑠𝑏2+𝑣𝑠𝑐2)(𝑥+𝑎)𝑛
3 ) (6)
This amplitude is used to determine the synchronization signals of CPI voltage that contains the phasor information of all phase voltages. The synchronization signals are estimated as:
𝑎 =𝑉𝑠𝑎
𝑉𝑧 , 𝑍𝑏 = 𝑉𝑠𝑏
𝑉𝑧 , 𝑍𝑐 = 𝑉𝑠𝑐
𝑉𝑧 (7)
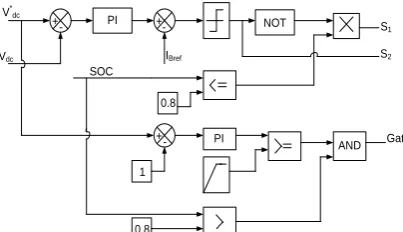
2. 4. Control of Battery Energy Storage System
Battery and bidirectional dc-dc converter (BDC) controller setup is shown in Figure 4. The main purpose of the bi-directional dc-dc converter is to regulate constant dc-link voltage (V*dc) as a reference value besides to charge/discharge current to/from batteries bank based on the necessary load power. The voltage of the battery is less as compared to the reference dc-link voltage and power exchanged is also achieved by using bi-directional dc converter control. The reference power for BDC is generated by power management control scheme. The battery reference current (IBref) is calculated using Equation (8):
𝐼𝐵𝑟𝑒𝑓=
𝑃𝐵𝐷𝑟𝑒𝑓/𝐵𝐶𝑟𝑒𝑓
𝑉𝐵 (8)
Based on IBref value the switching mode of the converter is determined. In this paper, the battery voltage is chosen at around 324 V, whereas V*dc = 650V. The battery depth of discharge is considered 20% [13] and is depending on the idea that it should provide the electric power to the loads of a 7.5 kW (at half load) for approximately three hours to reduce power demand of the grid in peak hrs.
1
0.8 0.8 SOC
PI NOT
AND Gate
S1
S2
IBref
V* dc
PI
Vdc
+
-+ +
Figure 4. Battery bidirectional dc-dc converter control
L =Vbatt∗(Vdclink−Vbatt)
Ibatt∗fs∗Vdclink
(9)
BuckmodeC = KL∗Ibatt
8∗fs∗Vbatt(ripple) (10)
Boostmode C = DBoost∗Idclink
fs∗Vdclink(ripple) (11)
where: 𝑉Batt, 𝑉dc_link, 𝐼dclink, 𝐼Battery; are the battery, dc bus voltage and currents respectively, 𝑉Batt(ripple) indicates ripple in battery voltage and KL is estimated ripple in inductor current. In this proposed work, L = 2mH.
When there is lack/excess of ac/dc load power present, the battery storage is used to maintain power balance by discharge/charge within particular limit. In this proposed work, when solar power is surplus then it first supplies power to the battery bank and it charges up to upper boundary of charge carrying capacity. After that, the extra power is injected to the grid through bi-directional active rectifier. In this case, the upper boundary of SOC and present condition of SOC are compared and the manager switching judgment is prepared. Whereas in islanding condition the loads are get powered from PV and battery bank. In this way, the ac loads are supplied power from the dc bus through the PWM inverter.
Figure 5. Matlab Simulink Model
This is done because when the disturbances occur in the ac grid, the ac load continues to operate by the islanding mode of operation and provides better relatively than grid connected solar inverter. In case of PV power generation and battery fails to satisfy the load demand due to low SOC of the battery, the ac grid supplies power to the load. For maintaining the dc-link voltage, based on the above process, the lower and upper limits for the battery bank SOC are kept at 0.2 and 0.8, respectively [13].
MATLAB MODEL OF SOC
The implementation of state of charge battery using MATLAB/SIMULINK is presented in this section and its MATLAB model is shown in Figure 5. This simulation focuses on knowing the state of charge of a battery by connecting it to a load with constant charging and discharging.
Case 1; Charge model (𝑖∗< 0)
𝑓2(𝑖𝑡, 𝑖∗, i, Exp) = Eo − K. 𝑄
𝑖𝑡+0.1𝑄. 𝑖 ∗−
𝐾.𝑄−𝑖𝑡𝑄 . 𝑖𝑡 + 𝐿𝑎𝑝𝑙𝑎𝑐𝑒−1(𝐸𝑥𝑝(𝑠)
𝑆𝑒𝑙(𝑠). 1 𝑠)
(12)
Case 2; Discharge model (𝑖∗> 0)
𝑓1(𝑖𝑡, 𝑖∗, i, Exp) = Eo − 𝐾. 𝑄
𝑄−𝑖𝑡. 𝑖𝑡. 𝑖 ∗−
𝐾. 𝑄
𝑄−𝑖𝑡. 𝑖𝑡 + 𝐿𝑎𝑝𝑙𝑎𝑐𝑒
−1(𝐸𝑥𝑝(𝑠) 𝑆𝑒𝑙(𝑠). 0)
(13)
where, Eo= constant voltage (V)
Exp(s) = Exponential Zone dynamics (V)
Sel(s) = Represents the battery mode. Sel(s) = 0 during battery discharge. Sel(s) = I during battery charging. K=Polarization constant (Ah-1) or polarization resistance (ohms)
i* = Low frequency current dynamics (A) i = Battery current (A)
it = Extracted capacity (Ah)
Q = Maximum battery capacity (Ah)
Modeling of Battery
The battery terminal voltage vB is as follows:
VB = VOC – RIB (14)
where, vOCis the open-circuit voltage, iB is the battery current, and R is the equivalent battery resistance.
3. DC/AC MICROGRID OPERATION
operation is known as inverter mode. The second operation is when the generated power is less than load power (PS<PL) the converter operates as rectifier in order to stable the dc bus voltage. ii) The islanding mode of operation.
3. 1. The Proposed Energy Management of the Microgrid System A 15 kW photovoltaic system is used in the proposed work to feed power at the best environmental conditions. The BESS is also used in parallel with the PV array. The main purpose of BESS is to store the surplus power from DC bus and deliver it back later in case when it is required. The BESS is also used to compensate the power constraints of PV system. To track the load demand, a control technique is developed by using PV/battery hybrid system as shown in Figure 6. The battery charging current is 10% of the ampere hour (Ah) rating of the battery. Thus the extra power is sent to the ac-grid after BESS charges up to its maximum charging current rate. The entire energy management is controlled by the conventional switching
algorithm. Accordingly, as per the required inputs shown in Table 2, the proposed energy management system generates the control signals for the converters connected to input/output of the microgrid system.
4.SIMULATIONRESULTSANDDISCUSSIONS
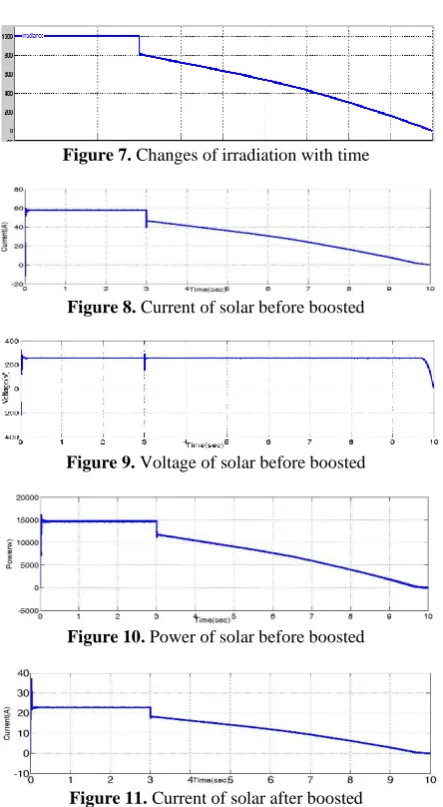
The proposed model is simulated in Matlab/Simulink environment. For the PV system the direct duty cycle control P&O MPPT based method is implemented. BESS is included via PWM bi-directional converter and for ac loads three-phase SPWM control technique inverter is used. In case of grid connected converter, a current controlled VSI is used for active rectifier control scheme. Simulation result for case 1for different parameters like power, voltage and current are shown in Figures 7 to 17. Figure 10 shows the power before boosted and Figure 13 shows after boosted case, here we can observe the slope of the curve.
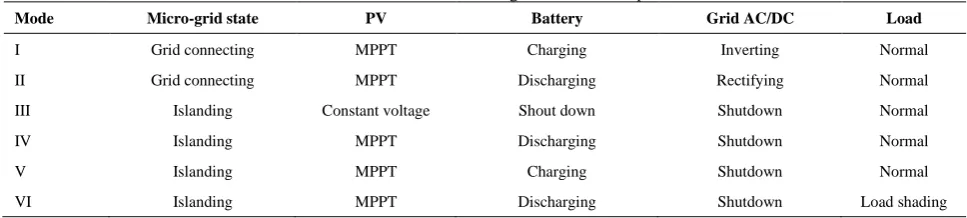
TABLE 1. Indicate the DC/AC Micro grid in different operation mode
Mode Micro-grid state PV Battery Grid AC/DC Load
I Grid connecting MPPT Charging Inverting Normal
II Grid connecting MPPT Discharging Rectifying Normal
III Islanding Constant voltage Shout down Shutdown Normal
IV Islanding MPPT Discharging Shutdown Normal
V Islanding MPPT Charging Shutdown Normal
VI Islanding MPPT Discharging Shutdown Load shading
Grid
Healthy? Islanding
Grid-connected
IB > IBmax
Yes No
Yes
No Read: PPV, PG, PL, PB
SOC & IB
Yes Soc > socmax
PBCref= PL-PPV
PGref= PL-PPV-PB
Dis. Batt No
PL-PPV-PB>0
Soc > socmin
PG_s
No
PG_i
PL > PPV
No Soc > socmin
IB > IBmax
Yes
PDBref= PL-PPV
PL= PG+PPV+PB
PL-PPV-PB>0
No
No
Yes No
Yes No
Yes
No
Yes
PL > PPV
Increase Load
PV MPPT
Char. Batt Soc < socmax
Yes Yes
Soc < socmin
disch. Batt
discon. Batt
No Yes
No Dis. Batt
Yes No
PGref= PL-PPV-PB
Yes
TABLE 2. Input/output of proposed power management system
Abbreviations Description
PL Load Power
PG Grid Power
Ppv PV Power
SOC Battery State of Charge
PBDref Battery discharging reference
PBCref Battery charging reference
PGref Grid reference power
PG_i Power injecting to grid
PG-S Power supplied from grid
IB Battery charging current
IBmax Maximum battery charging current
Figure 7. Changes of irradiation with time
Figure 8. Current of solar before boosted
Figure 9. Voltage of solar before boosted
Figure 10. Power of solar before boosted
Figure 11. Current of solar after boosted
Figure 12. Voltage of solar source after boosted
Figure 13. Power of solar after boosted
Figure14. Solar power and Battery power
Figure15. Battery SOC%
Figure16. Power of AC load, DC load and grid
Figure 17. Battery current
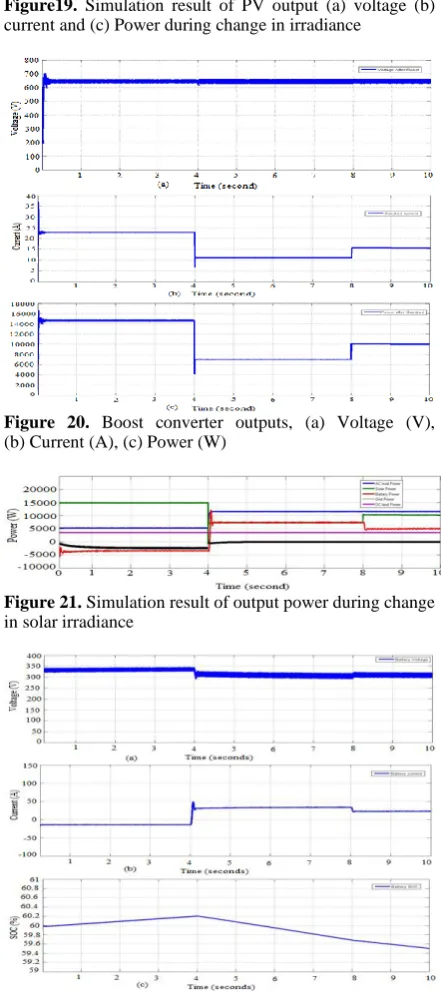
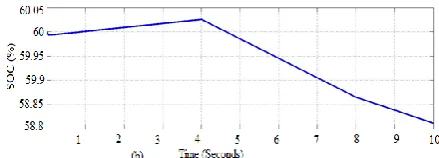
From Figure 21, it can be observed that when solar generation is more (PG>PL, from 0 to 4 seconds), the surplus power is delivered to grid and battery (battery is charging from 60 to 60.2%SOC), the resulting increase in battery voltage and a negative battery current indicates charging. When the generation is less than load (from 4 to 8 seconds), battery feeds deficient power to the load and the battery get discharged from 60.2 to 59.5% SOC, resulting decrease in battery voltage and a positive battery current indicates discharge mode of operation. This combination of supply tries to keep the power and voltage variation minimum under varying irradiance. Therefore, Figure 23 illustrates that using battery energy storage it is possible to keep the bus voltage stable having less variation. The steady state output power is 14.6 kW and the overall efficiency of 95.7% is achieved. The main reason of losses is due to switching losses in the converter. Figure 25 shows the simulation result of grid-connected ac current. In islanding mode, the dc grid bus is maintained by the PV and BESS. Rectifier/inverter is always linked offline with grid. Figure 26 shows the simulation result of islanding operation mode. The figure shows that during 0-4 second periods, when solar PV is operating at rated power, load is increased. From 4 – 8 seconds, PV generation decreased but load increased, the battery is discharging to supply deficient power for the load. After 8 seconds battery discharging is decreased because PV generation is increased. Figures, 27(a) and 27(b) show current and SOC of battery respectively in islanding operation. The effect of variation of irradiance under constant temperature (250C) in grid-connected and islanding mode is implemented by carrying out the simulation in the MATLAB/Simulink environment. The DC/AC microgrid architecture shown in Figure 1 is modeled in Matlab/Simulink.
The switches of BESS are IGBTs. To meet the required bus voltage the boost converter provides the desired boosted dc link voltage. From the design consideration, value of the boost converter parameter is chosen as L = 2.5mH, Cin = Cout = 47 µF for 10 kHz switching frequency. It is ensured that even if irradiance changes as shown in Figure 20, the output voltage is maintained constant (Figures 21(a) and 25).
Figure 18. Irradiance at constant temperature (250C)
Figure19. Simulation result of PV output (a) voltage (b) current and (c) Power during change in irradiance
Figure 20. Boost converter outputs, (a) Voltage (V), (b) Current (A), (c) Power (W)
Figure 21. Simulation result of output power during change in solar irradiance
Figure 23. Simulation result of DC bus voltage
Figure 24. Simulation result of ac grid current in grid-connected mode (Zoomed portion)
Figure 25. Zoomed portion of load side inverter output voltage and current waveform
Figure 26. Simulation result of output power during change in solar irradiance (islanding mode)
Figure 27(a). Simulation result of AC load current during islanded mode
Figure 27(b). Simulation result of BESS during islanded mode SOC (%)
5.CONCLUSION
In this paper, DC/AC microgrid with PV power generation and BESS is studied for dc and ac load applications. To fulfill the power management, control techniques for BESS regulation converter and grid connected bidirectional active rectifier are designed. The BESS stores power generated by the PV plant enabling to continue operation in maximum power point during high load demand. Similarly, the grid can be used to support the system by supplying additional active power for the load. In the same way, the power generation from PV system is effective used to keep the system energy management. Simulations were performed and validate the effectiveness of the proposed control system.
6. REFERENCES
1. Hoffert, M.I., Caldeira, K., Benford, G., Criswell, D.R., Green, C., Herzog, H., Jain, A.K., Kheshgi, H.S., Lackner, K.S., Lewis, J.S. and Lightfoot, H.D, "Advanced technology paths to global climate stability: Energy for a greenhouse planet" , Science, Vol. 298, No. 5595, (2002) 981-987.
2. J.Wang and F.Yang, "Optimal capacity allocation of standalone wind/solar/battery hybrid power system based on improved particle swarm optimization algorithm", IET Renewable Power Generation, Power Generation, Vol.7, No.5, (2013) 443-448. 3. C. Wang and M. H. Nehrir, "Power management of a stand-alone
wind/photovoltaic/fuel cell energy system", IEEE Transactions Energy Conversion, Vol.23, No.3, (20008) 957-967.
4. A. Mohamed and T. Khatib, "Optimal sizing of a PV/wind/diesel hybrid energy system for Malaysia", IEEE Industrial Technology International Conference, (2013) 752 – 757. 5. E. Mazhari, et al, “Hybridsimulation and optimization-based
design and operation of integrated photovoltaic generation, storage units, and grid”, Simulation Modelling Practice and Theory, Vol. 19, No. 1, (2011), 463–481.
6. Moriana, I., I. San Martin, and P. Sanchis. "Wind-photovoltaic hybrid systems design." In SPEEDAM ,(2010) 610-615. IEEE.
7. Borowy, Bogdan S., and Ziyad M. Salameh. "Methodology for optimally sizing the combination of a battery bank and PV array in a wind/PV hybrid system." IEEE Transactions on Energy Conversion, Vol. 11, No. 2 (1996): 367-375.
9. Al-Falahi, M.D., Jayasinghe, S.D.G. and Enshaei, H.,"Modeling and performance analysis of hybrid power system for residential application", Australasian Universities Power Engineering Conference, 2015, 1-6.
10. Kircicek, Y., Aktas, A., Ucar, M., Ozdemir, S. and Ozdemir, E., June. Modeling and analysis of a battery energy storage system supplied from photovoltaic power source. In 7th International Ege Energy Symposium & Exhibition. 2014.
11. M.Killi and S.Samanta, "Modified perturb and observe MPPT algorithm for drift avoidance in photovoltaic systems", IEEE Trans.Ind. Electro.Vol. 62, No. 9, (2015), 5549-5559.
12. Rodríguez, José R., Juan W. Dixon, José R. Espinoza, Jorge Pontt, and Pablo Lezana. "PWM regenerative rectifiers: State of the art." IEEE Transactions on Industrial Electronics, Vol. 52, No. 1, (2005), 5-22.
13. Samrat, N. H., Ahmad, N.B., Choudhury, I.A. and Taha, Z.B., "Modeling, control, and simulation of battery storage
photovoltaic-wave energy hybrid renewable power generation systems for island electrification in Malaysia." The Scientific World Journal, (2014).
7.APPENDIX
TABLE3. Solar array parameters
Max. power 15[kW] Short circuit current 5.96[A]
Voltage at MPP 54.7[V] Open circuit voltage 64.2[V]
Current at MPP 5.58[A] No of series connected
modules 5
No of cell per
module 96
No of parallel
connected modules 10
Implementation of Optimal Load Balancing Strategy for Hybrid Energy Management System in
DC/AC Microgrid with PV and Battery Storage
G. V. R. Sagara, T. Debelab
a Ravindra College of Engineering for Women, India b Haramaya University, Ethiopia
P A P E R I N F O
Paper history: Received 17 April 2019
Received in revised form 07 July 2019 Accepted 29 July 2019
Keywords:
Battery Energy Storages System Energy Management Microgrids
Power Electronic Converters Maximum Power Point Tracking
هديكچ
دیرگ ورکیم یزاسلدم هلاقم نیا
DC / AC
( کیئاتلووتف یاهلناپ و یژرنا هریخذ یاهدحاو زا هدافتسا اب ار
(PV
یم هئارا
راب ود هب ورین نیا .دشاب یم تردق لیدبت هلحرم ود لماش لادوم .دهد
DC
و
AC
یدیشروخ لنپ نیا اب
PV
یم هضرع
دیلوت لدم فشک یارب بسانم شور .دوش
PV
فتسا اب هریخذ متسیس هب هفرط ود لدبم .تسا هدننک دیلوت یاه هداد زا هدا
یرتاب و یرتاب یزاس
DC
لسن هک ردق ره یزاس هریخذ متسیس ،تسا رادیاپ سوبوتا ژاتلو ظفح یارب .تسا هدش لصو
د هب ار راب تردق دوش یم دیلوت رت نییاپ لسن هک ینامز و دنک یم بذج ار دح زا شیب تردق ،دشاب رتلااب .دروآ یم تس
دیکات هلاقم نیا .درب یم نیب زا هکبش للاحنا زا یشان موادم روط هب یلحم یاهراب هضرع اب ار دم و رزج تارطخ متسیس نیا ژاتلو یرادیاپ و لرتنک رب
DC
رازفا مرن .تسا یژرنا تیریدم ژاتلو و
Matlab / Simulink
متسیس یزاس لدم ماغدا یارب
س ییاراک و دیدرگ هدافتسا .تسا هدش دییات یزاس هیبش اب متسی