Please cite this article in press as: Melkamu ,Zeru.A. Linear Mixed Effect Model with Application to Random Blood Sugar Data
J Biostat Epidemiol. 2018; 4(4): 244-251
Journal of Biostatistics and Epidemiology
J Biostat Epidemiol. 2018;4(4): 244-251
Original Article
Linear Mixed Effect Model with Application to Random Blood Sugar Data
Melkamu Ayana Zeru
Department of Statistics, College of Computing and Informatics, Haramaya University, Dire Dawa, Ethiopia
ARTICLE INFO ABSTRACT
Received 25.06.2018 Revised 01.10.2018 Accepted 23.11.2018 Published 20.12.2018
Key words:
Linear mixed model; Random blood sugar, Type-1 Diabetes
Background & aim: Diabetes mellitus is a common, chronic, metabolic syndrome characterized by hyperglycemia as a cardinal biochemical feature. Type-1 diabetes is a continuing hormonal deficiency disorder that has significant short-term impacts on health and lifestyle and is associated with major long-term complications like heart failure, kidney, hypertension, eye damage, etc. which reduced life expectancy. The main objective of this study was to assess the risk factor that increase prevalence of type-1 diabetes mellitus and to determine their relationship with outcome of type-1 diabetes mellitus over time.
Methods & materials: To address this objective linear mixed effect model was applied using the random blood sugar of 970 diabetic patient children during treatment period of 3 years at Hiwot Fana hospital which have been implemented in statistical packages STATA, SAS and R.
Result: This study found that the mean progression of random blood sugar level of diabetic children was decreased over time after they starts their follow up and medications. The linear distribution also accounts 92 % variability of the data was explained by the covariates which were included in the study. The variable age, residence, family history, nutrition status, early diet, body mass index, electrolytes and renal function test had significant effect on the change of sugar level (p < 0.05).
Conclusion: The cumulative incidence of type-1 diabetes mellitus disease was increased due to presence of co-infections and decreased with pharmacological diabetes treatment. The linear mixed effects model fitted was appropriate for the estimation of sugar levels based on the risk factor variables for type-1 diabetes mellitus patient children.
Abbreviations: RBS = Random blood sugar; FH = Family history; UM = under malnutrition; OM = Over malnutrition; RFT= Renal function test; NS=Nutritional status
Introduction
Diabetes mellitus is a common, chronic, metabolic syndrome characterized by hyper-glycemia as a cardinal biochemical feature. It is not a single entity rather a heterogeneous group of disorders in which there are distinct genetic patterns as well as other etiologic and patho-physiologic mechanisms that lead to impairment of glucose tolerance. The classification of diabetes is based upon the pathophysiology of each form of the disease. Type-1 diabetes results from cellular mediated autoimmune destruction of pancreatic β-cells, usually leading to loss of insulin secretion (1). The incidence of childhood onset diabetes is increasing in many countries. There are clear indications of geographic
Email: [email protected]
differences in trends but the overall annual increase is estimated at around 3% (2).
Linear Mixed Effect Model with Application to Random Blood Sugar Data Vol 4 No 4 (2018)
245 patients, found a slightly higher incidence of
female to male patients, although this was not statistically significant (6).
Several studies have highlighted the relevance of residual β-cell function as measured by fasting blood glucose (random blood glucose) in patients with type- 1 diabetes (7). In particular evidence the patients who maintain a stimulated C-peptide after diagnosis show improved metabolic control which evaluated by haemoglobinA1c (HbA1c) and reduced risk of developing long-term complications (8). In cross-sectional studies, youth with type-1 diabetes mellitus perform worse than no diabetic peers on tests of cognitive function across multiple do- mains (9). Past cross-sectional research has suggested that early age of diabetes onset has a negative effect on cognitive function in adults with T1DM (10).Type-1 diabetes is a continuing hormonal deficiency disorder that has significant short-term impacts on health and lifestyle and is associated with major long-term complications and reduced life expectancy. Diabetes can lead to serious complications, like heart, kidney, eye damage, etc.
Longitudinal mixed study in San Diego, California, with the database contains 2000 to 2002 found that the variable age, duration of disease, total cholesterol, BMI, dietary and malnutrition were significantly associated with glucose level and with the experience of longitudinal study on diabetes, many factors are associated with type-1 diabetes. Those are age, gender, treatment, diabetes duration, body mass index (BMI), exercise, insulin dose, family history, duration and others. There was a significant correlation between the total insulin secretory response and control of glucose, measured by HbA1c (P = 0.003) and insulin secretory response is an important determinant of the rate of metabolic decomposition from autoimmune destruction (11). The main objective of this study was to assess the risk factor for developing type-1 diabetes mellitus in pediatric patients over time using the random blood sugar in a follow up study at Hiwot Fana specialized hospital during treatment period of 3 years and to determine their relationship and also to determine outcome of type-1 diabetes mellitus in pediatric patients. Parts of the paper are organized as follows. Section 2 describes the materials and methods used in the study, section 3 presents the results and discussion and conclusions are provided in section.
Materials and Methods
Data Description and Study Design
This study was a retrospective cohort study based on data from diabetic patients. The data used in this study were obtained from Haramaya University Specialized Hospital, Ethiopia. The data consists longitudinal measurement on type-1 diabetes mellitus of each experimental unit (12), describe repeated measures as the situation in which measurements are made of the same characteristic on the same observational unit but on more than one occasion. This is what is meant by the term longitudinal data.
The usual test of diabetes is a random fasting blood glucose test before eating and its cut- off value for fasting glucose is 126mg/dL ( >7.0 mmol/dl) and random blood glucose level is >200mg/dl(11.1 mmol/l). The target populations of this study were all type-1 diabetic patients whose attend Hiwof fana specialized hospital and have been active in follow-up for their diabetes at least 2 times in four month interval in the hospital from September, 2016 to September, 2018 who has a minimum of two and a maximum of six repeated measurement values. The size of data may be different, because the duration of follow-up were not the same. All patients for this study who were included are those whose age less than 15 that have followed at least two times in three years were included in the study. In this study 970 observations were considered to collect the random blood sugar which was evaluated at fixed time points and measurements of all the patients were taken at 4 ,8,12,16,20 and 24 months ,which had equal time intervals with 4 moths difference between all measurements.
After selecting the proper covariance structure, evaluation of the final model is necessary. In the linear model, the co-linearity of predictors may affect the residual distribution, so the co-linearity among covariates needs to be checked (13). We need to check the distributional assumptions of the maximum likelihood estimation model with random effects and residual terms. To have an idea about the evolution of the data, mean profiles were plotted. The mean, the variance and the correlation structures were then also explored through graphical techniques. In parallel to defining the fixed effects model, a random effects model must be chosen to define a covariance model.
Linear Mixed Effect Model with Application to Random Blood Sugar Data Vol 4 No 4 (2018)
and standard deviation values of 364.62mg/dl and 100.13 mg/dl respectively. Individuals are not only said to be diabetic patients with large levels of RBS, but also for small levels. RBS level higher or lower than the standard value was considered as diabetic. Several potential explanatory variables were also considered in this study. Among the total study subjects of 970 patients included in the study, 489 (50.41%) were female while 481(49.59%) were male which is in line with the result in the study (14). More than half of the study subjects 565 (58.25%) were feed milk while 405 (41.75%) were feed breast, which shows that breast feeding has less probability to exposed for type-1 diabetes mellitus. In the same case 642 (66.19%) and 328(33.8%) were live in urban and rural respectively, it coincide with the
study result of (15). Regarding family history, 715(77.42%) had family history while the remaining 219(22.58%) were had no family history, this value also indicates the prevalence is high among individuals with family his- tory had higher random blood sugar level than non-family history which has similar conclusion with the study (16).
Regarding to the continuous factors of Table 1, the means of the baseline age and body mass index are 8.55 years and 21.89 kilograms/m2 with standard deviations of 2.85 years and 3.19 kilogram/m2 respectively. These variables are standardized to have a mean 0 and variance of 1 for facilitating parameter convergence. As such, their coefficients in the mixed model represent the effect for a unit standard deviation change.
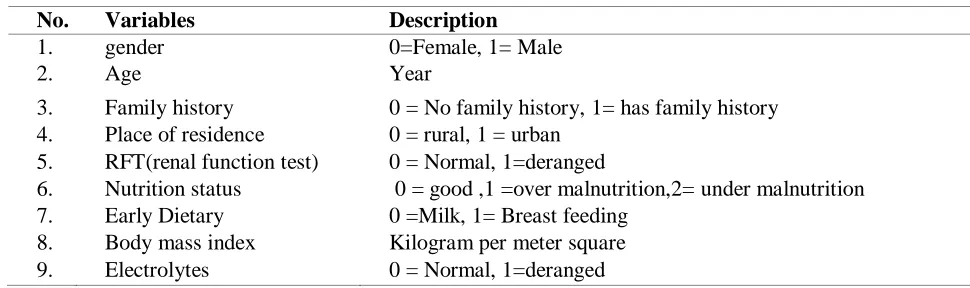
Table 1: Covariates used in the Linear mixed effect model analysis for T1DM data
No. Variables Description
1. gender 0=Female, 1= Male
2. Age Year
3. Family history 0 = No family history, 1= has family history 4. Place of residence 0 = rural, 1 = urban
5. RFT(renal function test) 0 = Normal, 1=deranged
6. Nutrition status 0 = good ,1 =over malnutrition,2= under malnutrition
malnutrition
7. Early Dietary 0 =Milk, 1= Breast feeding 8. Body mass index Kilogram per meter square
9. Electrolytes 0 = Normal, 1=deranged
Longitudinal Data Analysis
The linear mixed effect model is an appropriate statistical model for continuous response data, given that they duly acknowledge dependence between observations within subjects, through the use of random effects. Assume that there are i = 1, 2, . . . , N subjects and j = 1, 2, . . . , ni follow- up continuous
measurements Yij taken for each subject.
The linear mixed effect model is specified as: (1) This model involves two set of covariates Xij
and Zij . The ni × p covariates Xij are associated
with a p-dimensional vector of fixed-effects parameters β and the ni × q set of covariates Zij
are associated with the random effects
bi ∼ N (0, D). In addition,
ij∼ N (0, Ri )represents the residual of the jth observation on the ith subject. Given the random effects bi , the
residuals are often but not always assumed independent. The variance–covariance matrix D indicates the degree of heterogeneity of subjects. When all dependent residuals are considered, a variety of covariance structures are then possible for both D and Ri, such as unstructured,
compound symmetry, and first-order autoregressive matrices.
E(Yij ) = E[E(Yij|bi)] = Xijβ and hence
marginal and conditional parameters are equal. Alternatively, the marginal model is:
ij
X
Y
ij
ij*
* (2) with correlated residualsij
*∼
)
*
,
0
(
i
N
v
The marginal distribution of the response is then, Yij∼ N (Xijβ, Vi ). In this case, correlation
is taken into account through covariance parameters. Again, different specifications of the ij
i ij ij
ij
X
Z
b
Linear Mixed Effect Model with Application to Random Blood Sugar Data Vol 4 No 4 (2018)
247 covariance structure can be imposed for the
covariance as shown above for D and Ri . It is
well known that the marginal model resulting from equation (1) is a special case of equation (2). The hierarchical linear mixed effect model therefore implies a specific marginal model with
ij
*
∼ N (0, Vi *) whereV
i
Zi
tDZ
R
i. A very important fact is that the implied marginal model removes the positive definiteness restrictions on the D and Ri matrices, merelyrequiring that Vi be positive definite, thus weaker
restrictions on the covariance parameters apply. Maximum likelihood and restricted maximum likelihood are popular estimation methods for the mixed model parameters (17). But from these two methods, restricted maximum likelihood is used to obtain best less biased estimates of the covariance parameters (18).The empirical maximization algorithm and Newton–Rap son based procedures (19) are common updating methods. These have been implemented in statistical packages STATA, SAS and R.
Result
On this section, statistical results were presented with the combination of descriptive and inferential analysis. 1456 case were considered in this study to collect random blood sugar which was evaluated at fixed time. The ranges for RBS level of those patients were from 264 mg/dl to 584 mg/dl with the corresponding mean and standard deviation of 364.6 mg/dl and 100.2 mg/dl respectively. From these study patients, 512 (52.7 %) were females that shows a greater incidence of the disease which is in line with the study result of (9). In the same fashion, 751 (77.4 %) were had family history with related to type-1 DM; and patients who live in rural were
more exposed and 642(66.2%) were live in rural; who were also affect by Type 1DM, which are similar to the study of (9). regarding the nutritional status, 473(48.76%), 176(18.14%) and 321(33.1 %) were under, normal and over malnutrition. Similarly, there were also 565(58.24 %) patients who starts milk in their early age, particularly before six months after birth, such that children who had breast feeding at early age had less probability for exposed to DM as compared with milk.
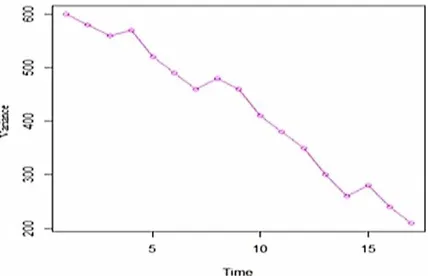
To understand the possible relationships among the RBS level of means over time, the plot of the mean structure is shown in Figure 1. The circled points in the plot show the mean RBS level at each observation time. , the variability of patients were observed and at the initial time the mean RBS of patients was higher and the mean of the RBS level was decreased over time since the follow up starts, this is due to the effect of medication and related measurements taken by the physician as well as the patient itself. This was very essential to determine the type and the rate of progression for T1DM disease in the form of RBS over the linear effect of time.
The variance function were shown in Figure 2, which was clearly shows the non- stationary of the RBS level among the patients which variability varies over time .This also implies the existence of some systematic structure between subjects. The variance function graph also to determine both random intercept and slope were included in the model as a preliminary random effect structure. From Table 2, the estimated subject specific variance is 0.65 with 95% credible interval (0.52, 0.79). Hence, it also supports the assumption of heterogeneous variance for the repeated RBS level.
Linear Mixed Effect Model with Application to Random Blood Sugar Data Vol 4 No 4 (2018)
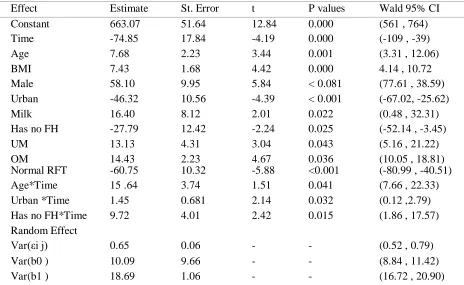
Table 2: Parameter estimates for the linear mixed effect model of RBS change for T1DM patients
Effect Estimate St. Error t P values Wald 95% CI
Constant 663.07 51.64 12.84 0.000 (561 , 764)
Time -74.85 17.84 -4.19 0.000 (-109 , -39)
Age 7.68 2.23 3.44 0.001 (3.31 , 12.06)
BMI 7.43 1.68 4.42 0.000 4.14 , 10.72
Male 58.10 9.95 5.84 < 0.081 (77.61 , 38.59)
Urban -46.32 10.56 -4.39 < 0.001 (-67.02, -25.62)
Milk 16.40 8.12 2.01 0.022 (0.48 , 32.31)
Has no FH -27.79 12.42 -2.24 0.025 (-52.14 , -3.45)
UM 13.13 4.31 3.04 0.043 (5.16 , 21.22)
OM 14.43 2.23 4.67 0.036 (10.05 , 18.81)
Normal RFT -60.75 10.32 -5.88 <0.001 (-80.99 , -40.51)
Age*Time 15 .64 3.74 1.51 0.041 (7.66 , 22.33)
Urban *Time 1.45 0.681 2.14 0.032 (0.12 ,2.79)
Has no FH*Time 9.72 4.01 2.42 0.015 (1.86 , 17.57)
Random Effect
Var(εi j) 0.65 0.06 - - (0.52 , 0.79)
Var(b0 ) 10.09 9.66 - - (8.84 , 11.42)
Var(b1 ) 18.69 1.06 - - (16.72 , 20.90)
The two plots of Figure 3, the first-stage models for linear and quadratic; the overall coefficient
R
2m eta of multiple determinationsindicates what proportion of the total within-subject variability can be explained by the first-stage linear model (17).
Linear Mixed Effect Model with Application to Random Blood Sugar Data Vol 4 No 4 (2018)
249 From the result of this figure, the
R
2m etavalues for both linear and quadratic first-stage models were 0.92 and 0.68 respectively. From those the linear had highest proportion to explain the variability of the random sugar level accounted by the covariates. Even though, in both models most of the proportion of the total within-subject variability were explained, but to identify whether the linear or the quadratic time effect model was essential to fit linear mixed model with the same covariance structure the value of AIC and BIC were also considered. The AIC and BIC for linear model and quadratic model (864 & 923 vs. 876 & 1024) respectively. Hence linear mixed model gives a relatively good fit to the data than the non-linear (quadratic) mixed model. As shown in the result of Table 2, the variable age, BMI, residence, early diet, malnutrition status and RFT significantly affected RBS level child patients in T1DM(p < 0.05). Hence, as age of a patient increased by 1 year, change of RBS level also increased by 7.68mg/dl keeping the other variables constant (p = 0.001) and also for a unit change in BMI, there was also 7.68mg/dl change in RBS(p = 0.000). From these there associated of RBS with age and BMI which is also supported by the study of (20). As the follow up times increased by one unit, the change of RBS level of the patients was decreased by 74.85mg/dl (p < 0.000). The analysis revealed that the rate of change in RBS for patients who has no family history is 0.85 times less likely than patients who has family history (p = 0.025) and similarly patient Child who live in rural are 1.3
times more likely exposed to T1DM than that of who lives in urban (p = 0.001), these result is also in line with the study of (21). In the same fashion, the composition of diet is one of the best known dietary patterns which affect child health including the development of T1DM. In this study also children who had normal malnutrition status has lowest RBS values that shows there exist statistical significance difference in the rate as well as in the prevalence of T1DM in children who had over malnutrition(p = 0.036) and under malnutrition(p = 0.043). Similarly, child’s who does not get enough breast feeding at their earlier age (mostly who feed milk) had greater glucose level (16.4) times to the child who had breast feeding at early ages, particularly up to six months after birth(p=0.022). Hence early diet and malnutrition status have positive significant effect on the development of T1DM which parallel with the study of a longitudinal study conducted by Mohan et al., 2009. Therefore, the parents and the child themselves must restrict the types and amounts of foods they eat to monitor their blood glucose levels at specific times. The renal function test (RFT) is one the indicator factor for the development of T1DM in children. Based on the values of RFT, this study also confirms that the deranged RFT values has higher probability to develop T1DM in Child, numerically the RBS level of children with normal RFT was decreased by 60mg/dl as compared with deranged RFT values(p <= 0.001).
The interaction effect of residence and family history with time is given below as:
(3)
(4)
Based on these two line equations (3), the rate of change should determine based on the difference of the slopes, and hence as the follow up time increased by one unit, the average rate of RBS for T1DM child patients who lives in urban was decreased by the amount of 1.45mg/dl as compared to that of patients who lives in rural(p<=0.001) and in same way figures from equation(4), states that the for a unit increment in follow up time, the rate of change in RBS level child whose family has DM history was increased
by 9.72mg/dl as child patients whose family has no disease history(p=0.015).
Discussion and Conclusion
The cumulative incidence of T1DM disease was increased due to presence of confections and decreased with pharmacological diabetes treatment. The linear mixed effects model fitted was appropriate for the estimation of sugar levels in T1DM patient children based on the risk factor variables. The pattern in mean change of sugar
Linear Mixed Effect Model with Application to Random Blood Sugar Data Vol 4 No 4 (2018)
levels revealed a linear distribution that decreased over time staring from follow up which also showed estimate of time was negative in the model. The estimated subject specific profile also supports the heterogeneous variability of RBS level within measurements of patient child’s. About 92% variation of the random blood sugar was explained by the covariates which were included in the model. Among the risk factor of T1DM, age, BMI, residence, family history, early diet nutritional status and renal function test had statistically significance effect on the value of RBS level which is an indicators of the disease(p<0.05) while there were no significant difference of RBS between male and female. The increasing prevalence and incidence of type-1 diabetes and its long-term complications in Ethiopia could have devastating human and economic toll if the trends remain unabated in the future.
Acknowledgment
The author is grateful to the Editors and reviewers of Journal Biostatistics and Epidemiology for their helpful comments and suggestions on the latest version of this article. The author is also grateful to acknowledge Hiwot Fana Specialized referral hospital in providing of the data for this study.
Conflict of Interest
The authors declare that there is no conflict of interest on the publication of this article.
References
1. Gale E. The rise of childhood type-1 diabetes in the 20th century. Diabetes. Med Klin. 2002, 51:3353–61
2. Karvonen M. Incidence and trends of childhood type-1 diabetes worldwide 1990-1999. Diabet. Med. 2006, 23:857–866.
3. Silva A, Amanda F. Treatment of type 2 diabetes in youth. Diabetes Care. 2011, 34:S177– S183.
4. Patterson C, Dahlquist G, Gyurus E, Green A, Soltesz G. Incidence trends for childhood type-1 diabetes in europe during 1989–2003 and predicted new cases 2005–2020: A multi-center prospective registration study. The Lancet. 20069, 373:2027–2033.
5. Pundziute L, yckå A, Dahlquist G, Nyström L. The incidence of type-1 diabetes has not increased but shifted to a younger age at
diagnosis in the 0-34 years group in sweden 1983-1998. Diabetologia. 2002, 45:783–791. 6. Kalk W, Huddle K., Raal F. The age of onset and sex distribution of insulin- dependent diabetes mellitus in Africans in south Africa. Postgrad Med J. 1993, 69:552–556.
7. Palmer J, Fleming G, Greenbaum C. C-peptide is the appropriate outcome measure for type-1 diabetes clinical trials to preserve beta-cell function: report of anada workshop, 21–22 October 2001. Diabetes. 2004, 57:1934.
8. Control T, Group C. Effect of intensive therapy on residual beta-cell function in patients with type 1 diabetes in the diabetes control and complications trial. A randomized, controlled trial. Annals of Intern Med. 1998, 128:517–523 9. Tonol I, Heyman E, Roelands, B. Type-1 diabetes-associated cognitive decline: a meta-analysis and update of the current literature. Diabetes Journal. 2014, 6:499–513
10. Gaudieri P, Chen R, Greer T, Holmes C. Cognitive function in children with type-1 diabetes: a meta-analysis. Diabetes Care. 20058, 31:1892–1897.
11. Chynna S, William A, Stephen G, Umesh M, Melissa C. Insulin secretion in type. American Diabetes Association. 2004, 52: 426–433. 12. Crowder M, Hand D. Analysis of repeated measures. Chapman and Hall.
13. Cheng J, Endwards L, Komro, K. Real longitudinal data analysis for real people: Building a good enough mixed model statistics in medicine. Statistics in Medicine. 2010, 29:504– 520.
14. Gillespie K, Gale E. Diabetes and gender. Diabetologia, 2001, 44:3–15.
15. Miller L, Willis J, Pearce J, Barnett R, Darlow B, Scott R. Urban-rural variation in childhood type-1 diabetes incidence in canter bury, new zealand, 1980-2004. Health place. 2011, 17:248– 256.
16. Harrison T, Hindorff L, Kim H, Wines R, Bowen D, McGrath B, Edwards K . Family history of diabetes as a potential public health tool. Am J Prev Med. 2003, 24:152–159.
17. Verbeke G, Molenberghs G. Linear mixed models for longitudinal data. New York,NY 10010, USA Verlag New,175 Fifth Avenue. 2000, 8:568.
Linear Mixed Effect Model with Application to Random Blood Sugar Data Vol 4 No 4 (2018)
251 19. Fitzmaurice G, Davidian M, Molenberghs
G. Longitudinal data analysis, handbooks of modern statistical methods. Chapman and Hall /CRC. 2009, 10:625–628.
20. Tyler T, Blader S. Identity and cooperative behavior in groups. Group processes and intergroup relations. 2001, 4:207–226