Croat. j. for. eng. 35(2014)2 201
Productivity Analysis of an Un-Guyed
Integrated Yarder-Processor with Running
Skyline
Bruce Talbot, Giovanna Ottaviani Aalmo, Karl Stampfer
Abstract
An excavator-based integrated yarder-processor was evaluated in a clearfelling in central Norway. The machine is unique because, as it uses a running skyline setup, yarding and processing cannot take place simultaneously as is the case with many European integrated tower yarders. Felling productivity was 10.6 m3 E
15h-1, yarding 9.2 m3 E15h-1 and processing
10.9 m3 E
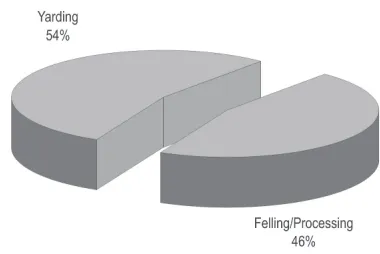
15h-1. Given that yarding and processing take place alternately accounting for 54%
and 46% of a system hour, the overall system productivity was 4.9 m3 E
15h-1 (processed and
stacked). The processing rate was approximately 30% of what is achieved by single grip har-vesters, indicating the effect of space limitations, a possible over-dimensioned processing head, and the need to simplify the assortment list under such conditions. An increase in processing productivity would require a second feller-chokersetter in the crew, although neither would then be used to full capacity. Un-choking alone accounted for 19% of the yarding cycle time and might be reduced by applying self-releasing chokers. System productivity needs to be increased by 30–50% to make it competitive. Much of this could be achieved simply by deploy-ing the machine in stands with larger mean tree volumes than those observed (0.27 m3).
Keywords: steep terrain, timber harvesting, cable yarding, un-guyed yarder
Un-guyed yarders are considered to offer a number of advantages under conditions of (i) space restric-tions: mobility on the landing during operation to al-low for trucks to pass, to prevent congestion by mov-ing continuously away from tree piles or log stacks or obstructions experienced in the corridor, un-guyed yarders allow for the forest road to effectively be used as a continuous landing, (ii) Short corridors or low volume densities: only the tail-spar needs to be rigged, un-guyed yarders have a lower setup time and there-with a competitive advantage on shorter corridors where higher rigging times are not justified by the lim-ited volume extracted, and (iii) local and seasonal availability: excavators are relatively low cost and readily available base machines that have a range of applications and can be used seasonally for forest work by e.g. farmers (Johansson 1997).
The configuration and functionality of un-guyed excavator based yarders varies considerably. Each con-cept offers benefits and restrictions pertaining to
com-1. Introduction
plexity, versatility, stability, productivity and economy. Base machines range from c. 15 to 40 tonnes. Winches range from single drum to 3-drum systems, both me-chanically and hydraulically driven. Some use a block mounted on the boom for lift, while others are fitted with towers of varying height, mounted on the ma-chine, the boom, or the boom tip. Some of the configu-rations retain the bucket for stability, others have re-placed this with a timber grapple, while yet others have a felling/processing head attached to the boom tip. Excavator-based yarders can be distinguished from other yarders built on similar undercarriages, in that part or all of the boom is retained and not replaced with a gantry setup as are the Madill type yarders.
Torgersen and Lisland (2002) provided an overview of the perceived advantages and disadvantages of these configurations in considering their potential application in Norway. Excavator-based yarders are considered to be well suited to the inland conditions in Norway with small crews (2–3 people), small trees in (0.2–0.4 m3 per
stem), generally small work objects (c. 1–3 ha.) and with low harvesting volumes (150–220 m3 ha–1). There is a
need to develop more versatile harvesting systems in Norway where some 150 million m3 of timber is mature
or maturing on slopes with an inclination steeper than 33% (Larsson and Hylen 2007) equating to the volume of 15 national annual cuts.
Recent cable yarding productivity studies of rele-vance include Spinelli et al. (2010) who studied two small-scale units in hardwood stands the Apennine’s,
Ghaffariyan et al. (2009) who developed production equations for two tower yarders in predominantly fir stands in Alpine conditions, and Zimbalatti and Proto (2009) who report on productivity rates for three differ-ent tower yarders extracting timber for firewood pro-duction in Calabria. However, apart from Torgersen and Lisland (2002), only limited work has been pub-lished on the productivity rates achieved by this ma-chine genre. Largo et al. (2004) studied a Timbco feller-buncher based yarder and a Caterpillar excavator based yarder in thinning operations in Idaho. Both were fitted with two-drum winches and used in a live, gravity sys-tem, and operated with 2-man crews. The work of Stampfer et al. (2006) is relevant in that they studied installation times for tower yarders, an important po-tential area for time saving on un-guyed yarders.
The lack of literature addressing this specific topic indicates that no previous productivity studies have been published for this type of fully integrated ma-chine. As the use of excavator-based yarders appears to be on the increase globally, results from the present work might be useful in identifying areas for improve-ment or application.
1.1 Aim
The aim of the present paper was to analyze the productivity levels achieved by a new fully integrated yarder-processor combination operating in a clear cut in the inland forest region of Norway.
Croat. j. for. eng. 35(2014)2 203
2. Materials and methods
2.1 Site information and work conditions
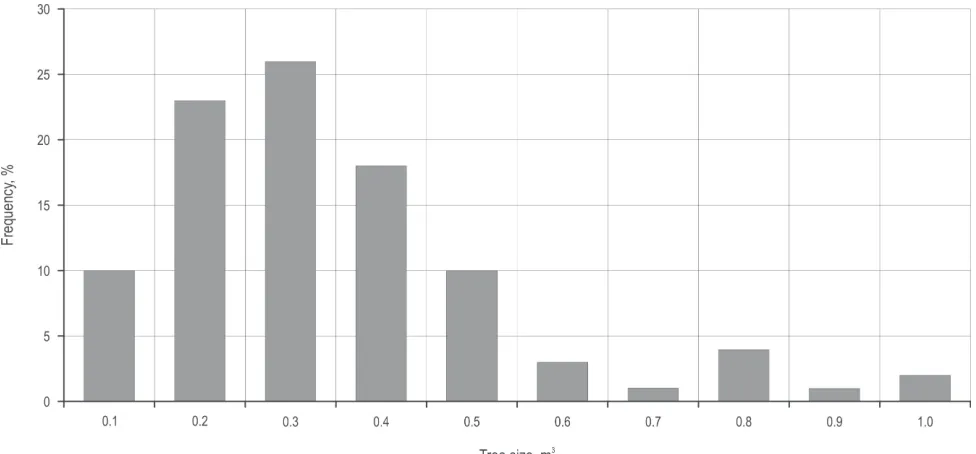
Studies were carried out over 4 days in a mixed Nor-way spruce (Picea abies) and Scots pine (Pinus sylves-tris) stand located in the upper Gudbrandsdalen valley in central Norway (UTM N 6,835,676 m, E 531,062 m). Working conditions on the site could be classified as good, an even and moderate north facing slope of ~43% with no notable surface obstacles. The diameters of 98 trees were measured, and diameter-height rela-tionships of an additional 20 trees were measured in calculating single tree volumes. The mean tree volume was 0.27 m3 (s.d. 0.21), while the smallest was 0.04 m3
and the largest 1.12 m3 (Fig. 1). For the time study, trees
were classified into 3 size classes with the following mid volumes; (1) small 0.17 m3, (2) medium 0.31 m3
and (3) large 0.56 m3. Stumps in three randomly
lo-cated circular plots (r=10 m) were counted after har-vesting, indicating a stand density of 610 stems ha–1
and a stand volume of roughly 140 m3 ha–1, a poor
stand equating to a site index40 of 11 m (Tveite 1977).
The operation studied was a clearcut. Weather condi-tions were warm and dry.
2.2 Technical machine data
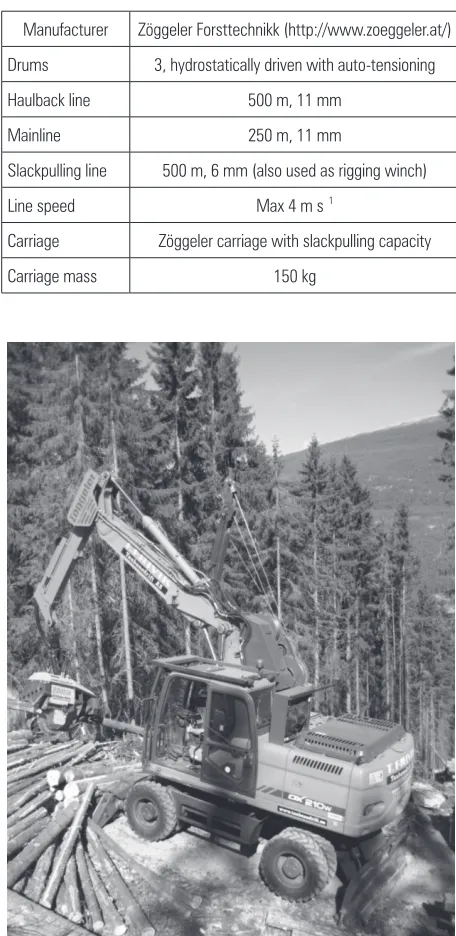
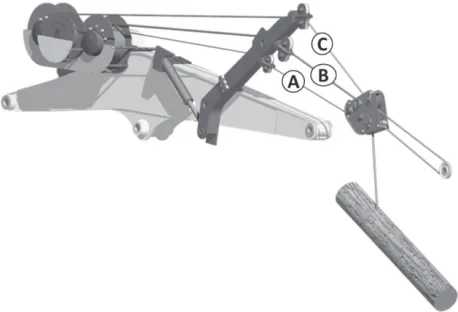
The machine studied was an excavator-based yard-er developed by Zöggelyard-er Forsttechnik in Austria (Fig. 2), which is unique in that it is fully integrated with both yarding and processing capability, but unlike similar tower yarders, these operations cannot take place simultaneously. The hydraulic winch (Table 1) has 3 in-line drums mounted on the boom, each fitted with auto-tensioning, which allows for slack to be spent or taken up continuously while slewing during processing or stacking without pulling up the tail spar or applying undue tension on the boom (Fig. 3). The lightweight carriage uses the slackpulling line in feed-ing the mainline out to be used as a skid line.
The winch was mounted on a 21 t Doosan DX210W wheeled excavator, stabilized with a dozer blade in the
Table 2 Technical information on the base machine and processing head
Base machine Processing head
Model Doosan DX210W Model Zöggeler ZBH58
Mass 20,500 kg Mass 1,480 kg
Motor Doosan 6 cyl. 6 liter Maximum cut diameter 70 cm
Rated power (gross) 127 kW at 2000 rpm Optimal oil supply 300 l min–1
Hydraulic pumps 2x232 l min–1 Loading grapple 150 cm/0.7 m3
Table 1 Technical information on the winch
Manufacturer Zöggeler Forsttechnikk (http://www.zoeggeler.at/)
Drums 3, hydrostatically driven with auto-tensioning Haulback line 500 m, 11 mm
Mainline 250 m, 11 mm
Slackpulling line 500 m, 6 mm (also used as rigging winch)
Line speed Max 4 m s–1
Carriage Zöggeler carriage with slackpulling capacity
Carriage mass 150 kg
front and outrigger at the rear. The excavator is fitted with a two-piece boom, and a telescopic replacement for the boom arm. A specially designed processing head with loading arms (Zöggeler ZBH58) was fitted to the boom arm for processing the trees and stacking logs (Table 2).
2.3 Time and productivity studies
The machine yarded uphill in a running skyline setup. Corridor length was short, varying between 80 and 120 m. The operation involved a 2-man crew, one machine operator and one feller-chokersetter, with multiple years of experience on tower yarders, but only around 4 months of operating experience on the Zöggeler machine. The standard work method ad-opted by the crew was studied. This alternated be-tween yarding (involving both crew members) and processing (machine operator) with simultaneous fell-ing (feller-chokersetter). The switch between work functions took place for every 5–7 loads (11–16 trees).
Time studies were carried out using Haglöf SDI®
software running in a Windows CE® environment on
an Allegro MX datalogger from Juniper Systems™, which allows for continuous recording at the cen-timinute (min × 10–2) level. Work elements and
vari-ables measured for each operation are provided in Table 3 in the results section to avoid duplication. The number of trees in each size class was recorded for each load. Estimates of haul-out distance (distance car-riage travels into the stand) were calibrated intermit-tently using a laser range finder sighting back to the base machine. Lateral distance was estimated visually as the time keeper worked in close proximity to the feller-chokersetter.
After chokersetting and yarding, felling (motor-manual) and processing (mechanized) took place simultaneously and were studied individually. Fell-ing alternated with chokersettFell-ing approximately ev-ery 20–25 minutes and so provided the feller-choker-setter with a varying workload over the day. Felling cycles started and ended when the tree hit the ground, and included elements such as moving, clearing underbrush, and brushing low branches (Table 3). Felling times for 217 trees were included in the final analysis.
Processing was recorded at tree level but time for the processing of individual logs within each tree was also recorded. Processing commenced when the pro-cessing head took hold of a new tree from the landing, and included other functionality such as the handling of residues, sorting, stacking and clearing the landing. Processing times for 254 trees and 745 logs were in-cluded in the final analysis.
Down-rigging, moving and rigging of new corri-dors was measured for 3 moves using wristwatch time. To minimize waiting time on the yarder, only the centerline of the new corridor was felled for a new rigging, the remaining trees were felled during normal operation. Time study data was cleaned of outliers, the distributions of individual time elements checked, and the regression models were developed and adapted using R statistical software.
3. Results
Results are presented separately for each of the 3 discrete operations: felling, yarding, and processing. Mean E15 times were 91.5 s tree–1 for felling, 240 s
cy-cle–1 for yarding, and 88.3 s tree–1 for processing (Table
3). For felling, cutting out the felling notch and per-forming the felling cut was the single most time con-suming element, at c. 36 s tree–1. Values are here
aver-aged out over all effective observations and can therefore appear shorter than their actual duration when occurring – e.g. the felling wedge was used 99 times out of 217 observations with a mean of 24.7 s per time used, but 11.3 s per observation mean. Felling productivity was 10.6 m3 E
15h–1.
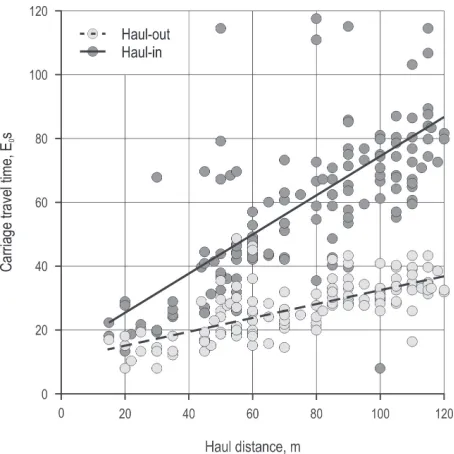
For yarding, mean cycle time was 240 E15s and
mean extraction distance 75.4 m, requiring 27 s for the outhaul and twice that for the inhaul under load, as can be seen in the simple regression on time for haul-ing-out empty and hauling-in under load (carriage speed 1.67 ms–1) in Fig. 4. At 42 s per load, un-choking
was the second highest single time element after haul-ing in. Overall yardhaul-ing productivity was 9.2 m3 E
15h–1. Fig. 3 Illustration of the 3-drum inline winch and hydraulically lifted
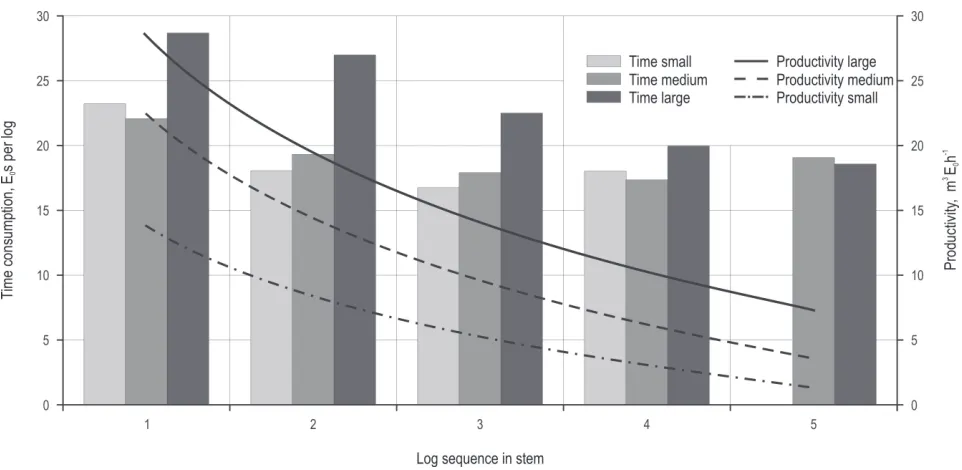
Croat. j. for. eng. 35(2014)2 205 For processing, it took around 17 s to take hold of the tree, get it into position and dress the butt-end when necessary, and a further 45 s on average to pro-cess the logs. Sorting logs into the correct stacks was time consuming, adding another 18 s per tree. Process-ing productivity was relatively low at 10.9 m3 E
15h–1,
but highly dependent on tree and log size. Fig. 5 shows how the processing time per log is relatively constant, while the productivity in m3 E
0h–1 decreases
exponen-tially. Here the common preparation time per tree is distributed to the logs by their volume proportion. Time elements associated with processing, such as stacking and handling biomass, are not included in Fig. 5.
Time consumption models were developed against effective time (ET) per unit. Various models were test-ed and those reporttest-ed here were selecttest-ed on their goodness of fit and F-value.
3.1 Felling
Only two independent variables could be included in the effective time consumption model for felling:
Table 3 Means and standard deviations (in parentheses) for all work elements and numerical variables measured in the field study
Felling (n=217) Yarding (n=149) Processing (n=254) Move to tree, s 18.3 (16.2) Haul-out, s 27.2 (8.7) Prepare, s 17.1 (14.8)
Haul distance, m 75.4 (28.7)
Clear brush, s 4.4 (6.6) Lateral-out, s 23.2 (9.6) Process logs, s 45.0 (25.4) Lateral distance, m 6.5 (3.9) Logs per tree, n 2.9 (1.4) Prepare, s 11.4 (15.9) Choke, s 24.8 (14.7) Residue handling, s 2.8 (2.7)
Trees per load, n* 2.27 (0.99)
Cut, s 35.9 (22.8) Lateral-in**, s 35.5 (18.1) Stacking logs, s 17.6 (45.1) Wedge, s 11.3 (8.6) Haul-in, s 58.7 (24.9)
Un-choke, s 42.2 (11.2) Time tree–1, E
0s 81.3 (70.2) Time load–1, E0s 212 (59.8) Time tree–1, E0s 82.5 (109.5) Delay time, s 10.2 (56.3) Delay time, s 27.8 (113) Delay time, s 5.8 (5.3) Time tree–1, E
15 s 91.5 (118.5) Time load–1, E15 s 240 (131.6) Time tree–1, E15s 88.3 (120.9) Trees, E0 hr–1 44.3 Trees, E0 h–1 38.6 Trees, E0 h–1 43.6 Prod. m3, E
0 h–1 11.9 Prod. m3, E0 h–1 10.4 Prod. m3, E0 h–1 11.7 Trees, E15h–1 39.3 Trees, E15h–1 34 Trees, E15h–1 40.8 Prod. m3, E
15h–1 10.6 Prod. m3, E15h–1 9.2 Prod. m3, E15h–1 10.9
* Movement between multiple trees during choking was accrued to lateral-out time
** Lateral-in is not a discrete element when winching with a running skyline as the load is hauled tangentially toward the yarder, and not to the corridor centerline first. In this study, lateral-in was used to record the break-out process, i.e. the time taken to get the load into motion toward the tower, thereby maintaining integrity of the distance based haul-in component
TS, a categorical variable explaining the tree size class-es and WDG, a binary variable indicating whether a wedge was used for directional felling or not. The gen-eral model to predict effective time consumption for felling per tree (ETfell) is given by equation 1, where b0
is the estimate of the intercept and b1–2 are the
coeffi-cients to be estimated. The model assumptions were checked using a full residual analysis:
ETfell ~ b0 + b1TS + b2WDG +e (1)
Regression results for the effective time consump-tion model for felling are reported in Table 4.
This regression model produced R2 = 0.35, F (3,162)=
=29.8, p<0.001. All independent variables were signifi-cant and positive confirming that the effective time to implement the felling operation increases with in-creasing tree sizes and with the use of the wedge. The low R2 is likely due to the fact that the moving distance
between the trees was not recorded, but accounted for a relatively large part of the effective time.
Table 4 Regression model parameters for felling
Coefficients Standard error t stat P value
Intercept b0 43.09 4.89 8.80 <0.001***
Treesize 2 b1 16.17 7.28 2.22 <0.05**
Treesize 3 b1 42.34 12.01 3.52 <0.001***
Wedge (1) b2 41.59 7.28 5.71 <0.001***
R-squared 0.35
Adjusted R-squared 0.34
F-statistic 29.8 (on 6 and 162 DF) <0.001
No. observations 217
Signif. codes: 0 ‘***’ 0.001 ‘**’ 0.01 ‘*’ 0.05 ‘.’ 0.1 ‘ ’ 1
Fig. 5 Processing time (E0s) per log, by tree size category and log sequence in the stem. The lines represent logarithmic approximations of
processing productivity rates achieved by tree size and log sequence, as read against the right hand vertical axis in m3 E
0h–1is travelling under
Croat. j. for. eng. 35(2014)2 207
3.2 Yarding
The general model for predicting the effective time for yarding was given by equation 2 as:
ETyard ~ b0 + b1HD + b2LatDist + b3TC + e (2)
Where ETyard is the effective time for yarding, b0
estimates the intercept and b1–3 are the coefficients to be estimated, HD is the haul distance, LD is the lateral distance and TC is the number of trees per cycle. The results for this multiple linear regression model are given in Table 5.
The regression model yields an adjusted R2 of 0.55,
F (3,121)=51.59, p<0.001. Results show that the variable lateral distance was significant at a 10% level, while the other variables were all statistically significant at 1%. All coefficients were positive, confirming the pos-itive correlation between time needed to perform the yarding task and the distances of the trees yarded from the tower and the line in addition to the number of tree parts of each load.
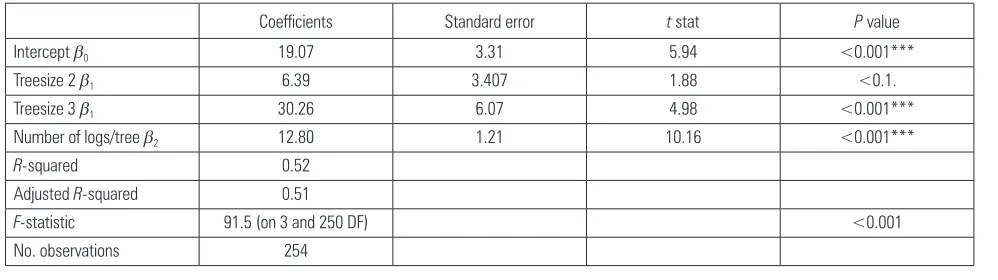
3.3 Processing
The time consumption prediction model for pro-cessing that best fitted the data consisted of a categor-ical variable representing the tree size TS and the num-ber of logs obtained for each tree, LOGN (equation 3). b0 is the estimate of the intercept and b1–2 are the coef-ficients to be estimated.
ETproc ~ b0 + b1TS + b2LOGN +e (3)
Analysis of the residual plots indicated no system-atic pattern and the underlying assumptions for re-gression were supported. The coefficients, all signifi-cant, are also all positive following the expected result of an effective time increase with increasing tree sizes
and number of logs obtained per tree. Note that time for sorting and stacking logs, and handling biomass are not included in this model.
3.4 System performance
Table 3 showed the time consumption for each work phase individually. As the machine cannot yard and process simultaneously, system productivity is limited by the least productive work phase. Each sys-tem hour was made up of yarding (54%) and the slow-er of felling or processing (46%), which in this case are almost identical at E15 time (Fig. 6). The resultant
sys-tem productivity was 4.9 m3 E
15h-1. Relocation, rigging
of the tail spar and corridor changes (it took roughly 2.5 h with 1 person) are not included in the E15h.
4. Discussion
A fully integrated machine configuration such as this that cannot yard and process simultaneously is
Table 5 Regression model parameters for yarding
Coefficients Standard error t stat P value
Interceptb0 73.6 12.78 5.76 <0.001***
Hauling Distance b1 1.17 0.11 10.35 <0.001***
Lateral Distanceb2 1.61 0.82 1.97 <0.01.
Trees/Cycleb3 19.19 3.28 5.85 <0.001***
R-squared 0.56
Adjusted R-squared 0.55
F-statistic 51.59 (on 3 and 121 DF) <0.001
No. observations 149
Signif. codes: 0 ‘***’ 0.001 ‘**’ 0.01 ‘*’ 0.05 ‘.’ 0.1 ‘ ’ 1
restricted by the weakest performing work phase. Fell-ing productivity should largely coincide with process-ing to avoid operational delays. If unavoidable, it is preferable that delays befall the feller-chokersetter as that represents only c. 20% of the total system cost, and because such a delay implies rest time for this worker.
As a yarder, the machine showed good perfor-mance rates. Cycle times were short, some 240 E15s on
average (15 turns per hour), partially due to the short corridor lengths, limited lateral yarding, and the fact that the running skyline configuration makes the skid-line immediately available to the chokersetter. The winch is powerful enough to yard larger loads than the 0.61 m3 observed, and this would significantly
im-prove productivity, but the chokers were well utilized at 2.3 trees on average, meaning that larger loads should come from larger trees. Roughly 19% of the yarding cycle time was used for unchoking, and this required the operator to climb up and down from the cab frequently, not without some risk. Research sug-gests that the use of self-releasing chokers could be useful in a setting such as this (Stampfer et al. 2010).
While felling and yarding are relatively effective, processing at 10.9 m3 E
15 h-1 is considerably slower than
that for single grip harvesters. Gerasimov et al. (2012) found mean productivities of 31.3 m3 E
15h-1 during
pro-cessing of trees of 0.16–0.30 m3 and 46.1 m3 per
pro-cessing machine hour for stem volumes ranging be-tween 0.31 and 0.5 m3, in a study including over
4 million trees. This is roughly 3 times higher than the processing productivity observed in this study. While processing is somewhat constrained by the working position and limited space available to the yarder, this considerable gap can likely only be explained by the operator and processing head, which might be better suited to larger trees found in central Europe. The op-erator was highly skilled on the Konrad Woody 60™ processing head, but the controls for the Zöggeler
head are configured differently and the operator might have required a longer period of adaption. An increase in processing speed would require another worker in the system as the feller appears to be work-ing near maximum speed. However, a second feller-chokersetter would only be partly employed. An in-crease in mean tree size would likely provide the easiest path to increasing system productivity, espe-cially with regard to processing.
The system hour consisted of 54% yarding and 46% processing/felling. With their similar machine, Torg-ersen and Lisland (2002) found the opposite distribu-tion of 41–59%, probably as yarding was carried out over longer distances and the processor was more ru-dimentary (i.e. stroke delimber). However, their re-sults at 6.2 m3 E
0 h-1 sorted at roadside, were similar
with those presented in this study.
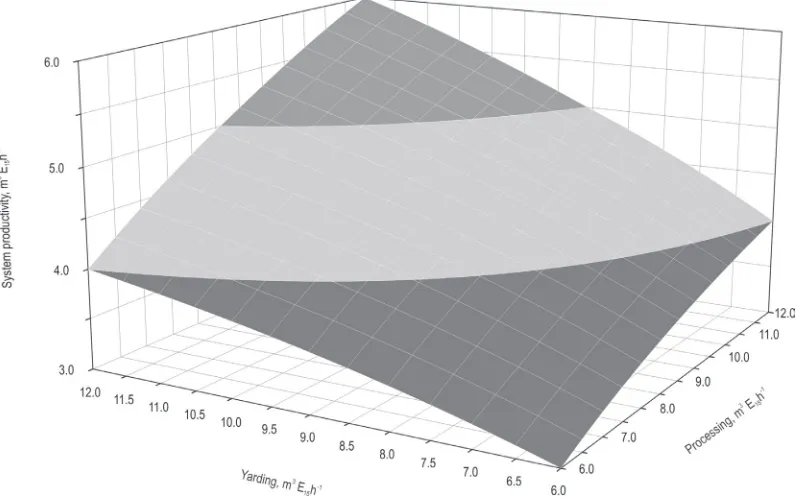
Fig. 7 shows the influence of an increase or decrease in yarding or processing/felling productivity on overall system productivity. It illustrates how considerable in-creases in either or both dimensions are required in making marginal increases in system productivity.
Rigging was generally handled by the feller alone. The machine operator used the time to clean up on the landing, and mark timber piles for different customers. Corridors were short (80–120 m), no intermediate sup-ports were used, all corridors were for uphill yarding, and the low cable tensions during operations allowed for light equipment and limited efforts on tail spar rig-ging. Most of the 2.5 h rigging time involved felling the centreline, and so was productive. By comparison, Stampfer et al. (2006) show how a small tower yarder working under similar conditions would require roughly 5 h installation time with a crew of 2. In their study of two non-guyed yarders in Idaho, Largo et al. (2004) report corridor changes of as low as 30 minutes.
Detailed system costs were not calculated, but es-timates indicate required hourly prices of roughly
Table 6 Regression model parameters for processing
Coefficients Standard error t stat P value
Interceptb0 19.07 3.31 5.94 <0.001***
Treesize2b1 6.39 3.407 1.88 <0.1.
Treesize 3b1 30.26 6.07 4.98 <0.001***
Number of logs/treeb2 12.80 1.21 10.16 <0.001***
R-squared 0.52
Adjusted R-squared 0.51
F-statistic 91.5 (on 3 and 250 DF) <0.001
No. observations 254
Croat. j. for. eng. 35(2014)2 209 US$ 200 for the machine and operator, US$ 45 for the
feller-chokersetter, including the chainsaw and all social on-costs (1 US$=6.12 NOK or 0.74 EUR). At a cost of roughly US$ 245 and a productivity of 4.9 m3 E
15h–1, the
system is some way from being profitable in the pres-ent application, but is currpres-ently applied in areas with subsidies for special harvesting conditions. System productivity would need to be raised by 30–50% or the capital outlay reduced, to make the machine competi-tive in the free market. Opportunities for achieving this might include using a cheaper, reconditioned base machine, deploying the machine in stands with larger mean tree sizes, increasing operator productivity in processing through training and simplifying the somewhat complex number of assortments made.
5. Conclusions
The single machine system works well in terms of balance with a 2-man crew, but system productivity remains too low. The simplest method of increasing productivity while maintaining balance would be to deploy the machine in stands with slightly larger trees. Processing rate was approximately 30% of that of a single grip harvester in similar tree sizes, and is the main bottleneck to increased system performance. A higher processing rate would result in the need for a second worker in the field, as the feller already works at or near the maximum rate. With two workers
in-field, neither would be fully employed. While this may still be economically beneficial, even given the high cost of workers in Norway, an important motivation for purchasing this system was the fact that it could be operated by a 2-man team.
To fully understand the potential of this interesting machine concept, more studies under varying condi-tions would be required. A full system analysis would also be required considering the costs, workload and productivity of a second man in the field and the sep-aration of the yarding and processing functionality to two base machines.
Acknowledgements
The authors wish to acknowledge the financial support received from the Research Council of Nor-way (projects ES500223 and 225329), and project own-er Mjøsen Skog SA. Thanks also to contractor T. Frivik Taubanedrift AS for permitting the study of their ma-chine, the manufacturer, Zöggeler Forsttechnik for an open process of cooperation, and forestry students Julian della Pietra (BOKU, Vienna), and Even Hoffart (NMBU, Ås) for assistance with the fieldwork.
6. References
ductivity analysis. In: Talbot, B. & Berkett, H., editors. Pro
-ceedings of the IUFRO unit 3.06 Conference on Forest Opera
-tions in Mountainous Condi-tions; June 2–5; Honne, Norway; 58–61.
Gerasimov, Y., Senkin, V., Väätäinen, K., 2012: Productivity of single-grip harvesters in clear-cutting operations in the north
-ern European part of Russia. Eur J Forest Res 131(3): 647–654. Ghaffariyan, M. R., Stampfer, K., Sessions, J., 2009: Production Equations for Tower Yarders in Austria. Int J For Eng. 20(1): 17–21.
Gingras, J-F., 2013: Update on steep slopes operations research at FP-Innovations in Canada. In: Talbot, B. & Berkett, H., edi
-tors. Proceedings of the IUFRO unit 3.06 Conference on Forest Operations in Mountainous Conditions; June 2–5; Honne, Norway; 15–17.
Johansson, J., 1997: Earth-Moving Equipment as Base Ma
-chines in Forest Work: Final Report of an NSR Project (NSR 37/93). SLU / Dept. of operational efficiency Research Note No. 294, 1–75.
Largo, S., Han H-S., Johnson, L., 2004: Productivity and Cost Evaluation for Non-guyline Yarders in Northern Idaho. In: Proceedings of the Council on Forest Engineering (COFE) conference – Machines and People, The Interface; April 27–30; Hot Springs, Arkansas; 1–6.
Larsson, J. Y., Hylen, G., 2007: Skogen i Norge. Statistikk over skogforhold og skogressurser i Norge registrert i perioden 2000-2004 [Statistics of Forest Conditions and Forest Resour
-ces in Norway]. Viten fra Skog og landskap 1/07. Norwegian Forest and Landscape Institute. ISBN 978-82-311-0006-5. In Norwegian with English summary. 1–91.
McEwan, A., Brink, M., van Zyl, R., 2013: Guidelines for dif
-ficult terrain ground-based harvesting operations in South
Africa. In: Talbot, B. & Berkett, H., editors. Proceedings of the IUFRO unit 3.06 Conference on Forest Operations in Moun
-tainous Conditions; June 2–5; Honne, Norway; 27–28. Spinelli, R., Magagnotti, N., Lombardini, C., 2010: Perfor
-mance, Capability and Costs of Small-Scale Cable Yarding Technology. Small-Scale Forestry 9(1): 123–135.
Stampfer, K., Leitner, T., Visser, R., 2010: Efficiency and Ergo
-nomic Benefits of Using Radio Controlled Chokers in Cable Yarding. Croat.j.for. eng. 31(1): 1–9.
Stampfer, K., Visser, R., Kanzian, C., 2006: Cable Corridor In
-stallation Times For European Yarders. Int J For Eng. 17(2): 71–77.
Torgersen, H., Lisland, T., 2002: Excavator-Based Cable Log
-ging and Processing System: A Norwegian Case Study. Int J For Eng. 13(1): 11–16.
Tuer, K., Saunders, C., MacIntosh, G., 2013: Steep ground har
-vesting project – Forestry Commission Scotland: Evaluation, Innovation and Development in Scottish Skyline Operations. In: Talbot, B. & Berkett, H., editors. Proceedings of the IUFRO unit 3.06 Conference on Forest Operations in Mountainous Conditions; June 2–5; Honne, Norway; 21–23.
Tveite B., 1977: Bonitetskurver for gran [Site index curves for spruce]. Meddelelser fra Norsk institutt for skogforsking 33.1: 1–84. In Norwegian.
Yoshimura, T., Noba, T., 2013: Productivity analysis of thin
-ning operation using a swing yarder on steep slopes in wes
-tern Japan. In: Talbot, B. & Berkett, H., editors. Proceedings of the IUFRO unit 3.06 Conference on Forest Operations in Mountainous Conditions; June 2–5; Honne, Norway; 35–36. Zimbalatti, G., Proto, A. R., 2009: Cable logging opportunities for firewood in Calabrian forests. Biosyst Eng 102(1): 63–68.
Received: March 15, 2014 Accepted: June 13, 2014
Authors’ address: Bruce Talbot, PhD.*
e-mail: [email protected] Giovanna Ottaviani Aalmo, PhD. e-mail: [email protected]
Norwegian Institute for Forest and Landscape Section for Forest Technology and Economics P.O. Box 115
1431 Ås NORWAY
Prof. Karl Stampfer, PhD. e-mail: [email protected] University of Natural Resources and Applied Life Sciences Vienna
Department of Forest and Soil Sciences Institute of Forest Engineering
Peter Jordan Straße 82/3 1190 Vienna
AUSTRIA