A structural equation modeling
approach for examining position effects
in large‑scale assessments
Okan Bulut
*, Qi Quo and Mark J. Gierl
Background
Large-scale assessments in education are typically administered using multiple test forms or booklets in which the same items are presented in different positions or loca-tions within the forms. The main purpose of this practice is to improve test security by reducing the possibility of cheating among test takers (Debeer and Janssen 2013). This practice also helps test developers administer a greater number of field-test items embedded within multiple test forms. Although this is an effective practice for ensuring the integrity of the assessment, it may result in context effects—such as an item position effect—that can unwittingly influence the estimation of item parameters and the latent trait (Bulut 2015; Hohensinn et al. 2011). For example, test takers may experience either increasing item difficulty at the end of the test due to fatigue or decreasing item difficulty due to test-wiseness as they become more familiar with the content (Hohensinn et al.
2008).
It is often assumed that position effects are the same for all test takers or for all items and thus do not have a substantial impact on item difficulty or test scores (Hahne 2008).
Abstract
Position effects may occur in both paper–pencil tests and computerized assessments when examinees respond to the same test items located in different positions on the test. To examine position effects in large-scale assessments, previous studies often used multilevel item response models within the generalized linear mixed modeling framework. Using the equivalence of the item response theory and binary factor analy-sis frameworks when modeling dichotomous item responses, this study introduces a structural equation modeling (SEM) approach that is capable of estimating various types of position effects. Using real data from a large-scale reading assessment, the SEM approach is demonstrated for investigating form, passage position, and item posi-tion effects for reading items. The results from a simulaposi-tion study are also presented to evaluate the accuracy of the SEM approach in detecting item position effects. The implications of using the SEM approach are discussed in the context of large-scale assessments.
Keywords: Position effect, Large-scale assessment, Structural equation modeling, Item response theory
Open Access
© The Author(s) 2017. This article is distributed under the terms of the Creative Commons Attribution 4.0 International License (http://creativecommons.org/licenses/by/4.0/), which permits unrestricted use, distribution, and reproduction in any medium, provided you give appropriate credit to the original author(s) and the source, provide a link to the Creative Commons license, and indicate if changes were made.
METHODOLOGY
However, this assumption may not be accurate in operational testing applications, such as statewide testing programs. For example, in a reading assessment where items are often connected to a reading passage, it is challenging to maintain the original tions of the items from field test to final form to eliminate the possibility of any posi-tion effects (Meyers et al. 2009). Similarly, the positions of items cannot be controlled in computerized adaptive tests in which item positions typically differ significantly from one examinee to another (Davey and Lee 2011; Kolen and Brennan 2014; Meyers et al.
2009). Therefore, non-negligible item position effects may become a source of error in the estimation of item parameters and the latent trait (Bulut et al. 2016; Hahne 2008).
Several methodological studies have focused on item position effects in national and international large-scale assessments, such as the Trends in International Mathemat-ics and Science Study (Martin et al. 2004), a mathematics assessment of the Germany Educational Standards (Robitzsch 2009), a mathematical competence test of the Aus-trian Educational Standards (Hohensinn et al. 2011), the Graduate Record Examination (Albano 2013), the Program for International Student Assessment (Debeer and Janssen
2013; Hartig and Buchholz 2012), and a German nationwide large-scale assessment in mathematics and science (Weirich et al. 2016). In these studies, item position effects were estimated as either fixed or random effects using multilevel item response theory (IRT) models within the generalized linear mixed modeling framework. This approach is also known as explanatory item response modeling (De Boeck and Wilson 2004), which is equivalent to Rasch modeling (Rasch 1960) with explanatory variables.
An alternative way of estimating IRT models is with a binary factor analysis (FA) model in which the item parameters and latent trait can be estimated using tetrachoric correlations among dichotomous item responses (Kamata and Bauer 2008; McDonald
1999; Takane and de Leeuw 1987). In addition to estimating the item parameters and latent trait, the binary FA model can be expanded to a structural equation model (SEM) in which item difficulty parameters can be predicted by other manifest (i.e., observed) variables (e.g., item positions, passage or testlet positions, and indicators of test forms). The purpose of this study is to (1) introduce the SEM approach for detecting position effects in large-scale assessments; (2) demonstrate the methodological adequacy of the SEM approach to model different types of position effects using an empirical study; and (3) examine the accuracy of the SEM approach in detecting position effects using a sim-ulation study.
Theoretical framework IRT and factor analysis
The FA model is a regression model in which the independent variables are latent vari-ables and the dependent varivari-ables are manifest varivari-ables (Ferrando and Lorenzo-Seva
2013). Previous studies on the relationship between the FA and IRT frameworks showed that the unidimensional two-parameter normal ogive IRT model is equivalent to a one-factor FA model when binary manifest variables are predicted by a continuous latent variable (e.g., Brown 2006; Ferrando and Lorenzo-Seva 2005; Glöckner-Rist and Hoijtink
2003; MacIntosh and Hashim 2003; Takane and de Leeuw 1987). The two-parameter normal ogive IRT model can be written as
where yi is the dichotomous item responses for item i, θ is the latent trait (i.e., ability),
ai is the item discrimination parameter, bi is the item difficulty parameter, and is the standard normal cumulative distribution function. Using the parameterization described in Asparouhov and Muthén (2016), the one-factor FA model for binary manifest varia-bles that corresponds to the two-parameter IRT model in Eq. 1 can be written as follows:
where y∗i is the continuous latent response underlying the observed item response for item i, νi is the intercept term for item i, which is typically assumed to be zero, i is the factor loading for item i, which is analogous to item discrimination in traditional IRT models, η is the latent trait, which is often assumed to follow a normal distribution as η∼N(0, 1)1, and εi is the residual term2 for item i (for compactness in the notation, no person subscript is included). In case of the Rasch model (Rasch 1960) or the one-parameter IRT model, factor loadings in the one-factor FA model are fixed to “1” or con-strained to be equal across all items.
In the one-factor FA model, there is also a threshold parameter (τi) for each dichoto-mous item, which corresponds to item difficulty (bi in Eq. 1) in traditional IRT models. Based on the threshold parameter, an observed item response yi becomes
Although factor loadings and intercepts in the one-factor FA model are analogous to item discrimination and item difficulty in IRT, these factor analytic terms can be for-mally transformed into item parameters in the traditional IRT scale (Asparouhov and Muthén 2016; Muthén and Asparouhov 2002). Assuming that the latent trait is nor-mally distributed as η∼N(α,ψ ) and η=α+√ψ θ where θ is the IRT-based latent
trait with mean 0 and standard deviation 1, the item discrimination parameter can be computed as ai=i/√ψ, and the item difficulty parameter can be computed as
bi=(τi−iα)/i√ψ [see Brown (2006) and Takane and de Leeuw (1987) for a review of similar transformation procedures].
Modeling position effects
As Brown (2006) noted, the use of the FA model provides greater analytic flexibility than the IRT framework because traditional IRT models can be embedded within a larger model that includes additional variables to explain the item parameters as well as the latent trait (e.g., Ferrando et al. 2013; Glöckner-Rist and Hoijtink 2003; Lu et al. 2005). Using the structural equation modeling (SEM) framework, an IRT model can be defined as a measurement model in which there is a latent trait (e.g., reading ability) underly-ing a set of manifest variables (e.g., dichotomous items in a readunderly-ing assessment). In the structural part of the SEM model, the causal and correlational relations among the latent trait, the manifest variables, and other latent or manifest variables (e.g., gender and atti-tudes toward reading) can therefore be tested.
(2) y∗i =νi+iη+εi,
1 The mean and variance are fixed to 0 and 1, respectively, to identify the scale of the latent variable. 2 The residuals are typically assumed to have a normal distribution (Kamata and Bauer 2008).
yi=
A well-known example of this modeling framework is the Multiple Indicators Multi-ple Cause (MIMIC) model for testing uniform and nonuniform differential item func-tioning in dichotomous and polytomous items (e.g., Finch 2005; Lee et al. 2016; Woods and Grimm 2011). In the MIMIC model, a categorical grouping variable (e.g., gender) is used as an explanatory variable to explain the relationship between the probability of responding to an item correctly and the grouping variable, after controlling for the latent trait. Based on the results of this analysis, one can conclude that the items become sig-nificantly less or more difficult depending on which group the examinee belongs to.
In the current study, instead of a categorical grouping variable, item position will be used as a continuous, explanatory variable to predict whether there is any relationship between item difficulty and the varying positions of the items on the test. Using the FA model in Eq. 2, the SEM model for examining linear item position effects can be written as follows:
where pi is a manifest variable that shows the positions of item i across all examinees
who responded to item i (e.g., 1, 15, 25, and 50 if item i is administered at the 1st, 15th, 25th, or 50th positions), βi is the linear position effect based on one unit change in the position of item i, and the remaining terms are the same as those from Eq. 2. In Eq. 3, if βi =0, it can be concluded that the difficulty of item i does not depend on its position on the test. If, however, βi�=0, then the difficulty of item i either linearly increases or decreases as a function of its position on the test (i.e., pi).
It is also possible to extend the SEM model in Eq. 3 to examine the interaction between the latent trait and item position, if the relation between the difficulty of an item and its position on the test is assumed to be moderated by the latent trait. To estimate the inter-action effect, an interinter-action term as a product of item position and the latent trait needs to be included as an additional predictor in the model (Moosbrugger et al. 2009). The SEM model for examining linear position effects and interaction effects can therefore be written as follows:
where pi is the positions of item i across all examinees who responded to item i,βi is the linear position effect, ωi is the interaction effect for item i, and the other terms are the same as those in Eq. 3. If, ωi�=0, then the difficulty of item i increases or decreases as a result of the interaction between the latent trait and item positions (i.e., ηpi in Eq. 4).
There are several methods used for estimating the interaction between the latent trait and manifest variables (e.g., item and testlet positions), such as the Latent Moderated Structural Equations (LMS) approach (Klein and Moosbrugger 2000), the Quasi-Maxi-mum Likelihood (QML) approach (Klein and Muthén 2007), the constrained approach (Jöreskog and Yang 1996), and the unconstrained approach (Marsh et al. 2004). The examples of interaction effects in SEM with binary manifest variables can be found in Woods and Grimm (2011) and Lee et al. (2016).
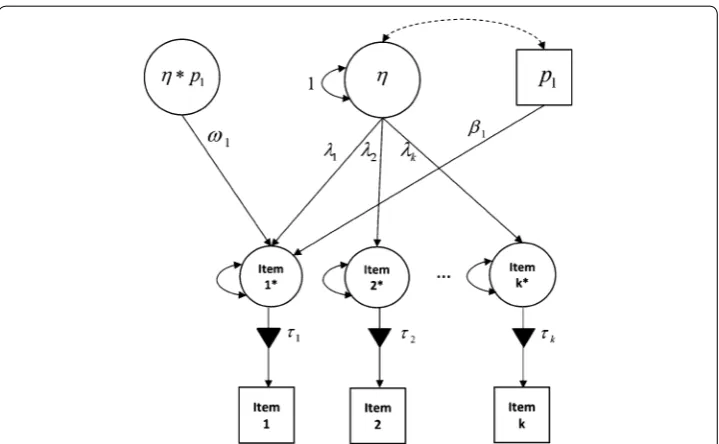
Figure 1 shows a path diagram of an SEM model based on k dichotomous items. In the model, item 1 is tested for linear position effects and interaction effects. Although Fig. 1
only shows the estimation of item position effect for item 1, all items on the test (or a (3) y∗i =iη+βipi+εi,
group of items) could be evaluated together for item position effects in the same model. It should be noted that the correlations between item positions and the latent trait (i.e., a double-headed arrow as in Fig. 1) are optional. If item positions are randomly deter-mined for each examinee (i.e., independent of examinees’ latent trait levels), then the correlation between item positions and the latent trait can be excluded from the model for the sake of model parsimony. However, the ordering of items can sometimes depend on examinees’ latent trait level. For example, in a computerized adaptive test, two exami-nees can receive the same item at different positions because of how they responded to earlier items on the test (e.g., van der Linden et al. 2007). Furthermore, in a fixed-form and non-adaptive test, examinees can still start and exit the test with different items, depending on test administration rules related to examinees’ response patterns (e.g., Bulut et al. 2016; Li et al. 2012). When examining item position effects in such assess-ments, a correlational link between item positions and the latent trait should be included in the model to account for this dependency.
Model constraints and assumptions
The proposed SEM approach requires the use of constraints to ensure model identifica-tion and accurate estimaidentifica-tion of model parameters. Using the marginal parameterizaidentifica-tion with a standardized factor (Asparouhov and Muthén 2016; Millsap and Yun-Tein 2004; Muthén and Asparouhov 2002), the variance of y∗i is constrained to be 1 for all items; the mean and the variance of the latent trait (η) are constrained to be 0 and 1, respectively [see Kamata and Bauer (2008) for other parameterizations in the binary FA model]. Fur-thermore, additional constraints might be necessary depending on which the IRT model is used. For example, if the Rasch model is the underlying IRT model for the data, all factor loadings in the model must be constrained to be 1. The general assumptions of
Fig. 1 The structural equation model for examining item position effects (Noteη= Latent trait; 1 to k=
fac-tor loadings; τ1 to τk= item thresholds; p1= positions of item 1 on the test; β1= linear item position effect for
IRT must also hold in order to estimate the IRT model with item position effects within the SEM framework. These assumptions include a monotonic relationship between the probability of responding to an item correctly and the latent trait, the unidimensionality of the latent trait, local independence of items, and invariance in the item parameters and the latent trait across different subgroups in a population.
Model estimation
The proposed SEM models for examining item position effects can be estimated using commercial software programs for the SEM analysis, such as Mplus (Muthén and Muthén 1998–2015), LISREL (Jöreskog and Sörbom 2015), AMOS (Arbuckle 2011), and EQS (Bentler and Wu 2002), or non-commercial software programs, such as the sem (Fox et al. 2016), lavaan (Rosseel 2012), OpenMx (Pritikin et al. 2015), and nlsem (Umbach et al. 2017) packages in R (R Core Team 2016). It should be noted that these software programs differ with regard to their algorithms for estimating SEM models with binary variables, model estimators (e.g., ULS, MLR, and WLSMV), the capability to estimate interaction effects, and methods for handling missing data. Therefore, when choosing the most suitable program, researchers should consider the research ques-tions that they aim to address, the statistical requirements of their hypothesized SEM model(s), and data characteristics (e.g., the number of items, amount of missing data).
As noted earlier, item position effects can be examined one item at a time using Eqs. 3
and 4. However, it is more convenient to estimate the position effects for all items within the same SEM model and then create a simplified model by removing non-significant effects from the model. Since the simplified model would be nested within the origi-nal model that includes the position effects for all items, the two models can be com-pared using a Chi square (χ2) difference test. The procedure for the χ2 difference test varies depending on which model estimator (e.g., the robust maximum likelihood esti-mator ‘MLR’ or the weighted least square with mean- and variance-adjusted Chi square ‘WLSMV’ in Mplus) is used for estimating the SEM model. For example, the χ2 dif-ference test using the corrected loglikelihood values or the Satorra–Bentler χ2 statis-tic (Satorra and Bentler 2001) are widely used when the model estimator is MLR. The reader is referred to Brown (2006, p. 385), Asparouhov and Muthén (2006), and the Mplus website (www.statmodel.com/chidiff.shtml) for detailed descriptions of the χ2 difference testing in SEM. When the SEM models are not nested, the model selection or comparison can be done on the basis of information-based criteria that assess rela-tive model fit, such as Akaike information criterion (AIC; Akaike 1974) and the Bayesian information criterion (BIC; Schwarz 1978).
Comparison with other approaches
2013). Although there are some empirical studies that used the factor analytic methods for modeling position effects (e.g., Bulut et al. 2016; Schweizer 2012; Schweizer et al.
2009), the current study represents the first study that utilized the SEM framework as a methodological approach for examining item position effects.
The proposed SEM approach has four noteworthy advantages over the other methods mentioned above when it comes to modeling item position effects. First, the proposed approach overcomes the limitation of examining position effects only for dichotomous items, which is the case with the approaches based on the GLMM framework (e.g., Hartig and Buchholz 2012). Using the SEM framework, assessments that consist of polytomously scored items can also be examined for item position effects. Second, the proposed approach is applicable to assessments in which item parameters are obtained using the two-parameter IRT model. Because the one-factor FA model is analogous to the two-parameter IRT model, it is possible to estimate item position effects when both item difficulty and item discrimination parameters are present in the model. Third, the proposed approach can be used with multidimensional test structures in which there are multiple latent traits underlying the data. Fourth, once significant item position effects are detected, other manifest and/or latent variables (e.g., gender, test motivation, and test anxiety) can be incorporated into the SEM model to explain the underlying reasons of the found effects. For example, Weirich et al. (2016) recently found in an empirical study that item position effects in a large-scale assessment were affected by the exami-nees’ test-taking efforts. Response time effort (Wise and Kong 2005) and disability sta-tus (Abedi et al. 2007; Bulut et al. 2016) are other important factors highlighted in the literature.
Next, the results from an empirical study first are presented to demonstrate the use of the proposed SEM approach for investigating three types of position effects that are likely to occur in large-scale assessments: test form (or booklet) effect, passage (or testlet) position effect, and item position effect. Real data from a large-scale reading assessment are used for the empirical study. The interpretation of the estimated posi-tion effects and model comparisons are explained. Then, the results from a Monte Carlo simulation study are presented to investigate the extent to which the proposed SEM approach can detect item position effects accurately. For both the empirical and Monte Carlo studies, Mplus (Muthén and Muthén 1998–2015) is used because of its flexibility to formulate and evaluate IRT models within a broader SEM framework and its exten-sive Monte Carlo simulation capabilities (e.g., Glöckner-Rist and Hoijtink 2003; Lu et al.
2005).
Empirical study Data
the students. The sample used in this study consisted of 11,734 third-grade students who completed the reading test of the statewide assessment on a computer.
Instrument
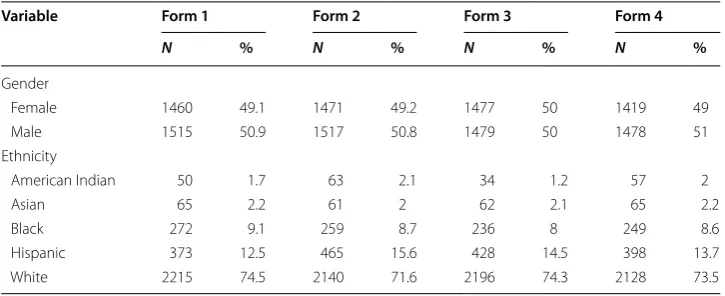
The reading test consisted of 45 multiple-choice items related to seven reading passages. The positions of reading passages and items varied across students, while the positions of the items within each passage remained unchanged. This process resulted in four different patterns of item positions on the test, which were referred to as test forms in this study. Table 1 shows the demographic characteristics of the students across the four forms. The forms were similar in terms of sample sizes and students’ demographic characteristics.
Model formulations
Four SEM models were specified and analyzed. The first model (M1) was the baseline
model because it did not include any predictors for item position effects. M1 was
equiva-lent to the Rasch model because the item parameters in the selected reading assessment were originally calibrated using the Rasch model. The remaining three models (i.e., M2
to M4) were designed to evaluate form effects, passage position effects, and item
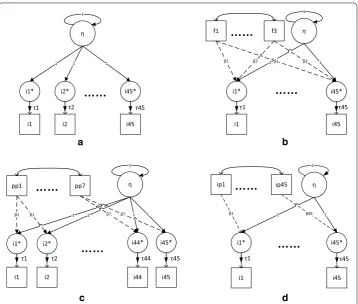
posi-tion effects, respectively. The proposed models are shown in Fig. 2. In each model, a uni-dimensional latent variable (i.e., reading ability) predicted a set of manifest variables (i.e., reading items). For models M2–M4, there were also additional predictors for the form,
passage position, and item position effects.
Rasch model (M1)
The first model was the Rasch model. It did not include any predictors for examining positions effects. Under the SEM framework, M1 is equivalent to a one-factor model
with all factor loadings fixed to 1 (see Fig. 1a). The latent variable defines the reading ability and the intercepts of the items are equivalent to item difficulties.
Form effects model (M2)
This model examined the form effects using indicators of test forms as categorical pre-dictors. The SEM formulation of M2 can be written as follows:
Table 1 Demographic summary of the students across test forms
Variable Form 1 Form 2 Form 3 Form 4
N % N % N % N %
Gender
Female 1460 49.1 1471 49.2 1477 50 1419 49
Male 1515 50.9 1517 50.8 1479 50 1478 51
Ethnicity
American Indian 50 1.7 63 2.1 34 1.2 57 2
Asian 65 2.2 61 2 62 2.1 65 2.2
Black 272 9.1 259 8.7 236 8 249 8.6
Hispanic 373 12.5 465 15.6 428 14.5 398 13.7
where form1, form2, and form3 are the dummy codes for the three test forms (using the fourth test form as the reference form), β1, β2, and β3 are the regression coefficients that represent the differences between the overall difficulty of the three test forms and the reference test form. Note that β1, β2, and β3 do not have the subscript for items, indicat-ing that the form effects were constrained to be the same across all items. Under the SEM framework, M2 is equivalent to a one-factor model with all factor loadings fixed to
1 and with form1 to form3 as additional predictors (see Fig. 1b).
Passage position effects model (M3)
This model examined passage position effects by incorporating passage positions into the SEM model as predictors. Given item i belongs to passage h, the SEM formulation of M3 can be shown as
where passage positionh is the position of passage h across all examinees and βh is the regression coefficient that represents the impact of one unit change in the position of passage h on the difficulty of items linked to passage h. Note that the passage position effect was constrained to be the same for all items linked to passage h. Under the SEM (5) y∗i =iη+β1form1+β2form2+β3form3+εi,
(6) y∗i =iη+βh∗passage position
h+εi,
a b
c d
framework, M3 is equivalent to a one-factor model with all factor loadings fixed to 1 and
with passage positionh as an additional predictor (see Fig. 1c).
Item position effects model (M4)
The last model examined individual item position effects by incorporating item posi-tions into the model as predictors. The SEM formulation of M4 is given as:
where item positioni is the position of item i across all examinees, and βi is the regres-sion coefficient that represents the impact of one unit change in the position of item i on the difficulty of item i. Unlike the first three models summarized above, this model allows the effect of item position on each item to vary across items. Under the SEM framework, M4 is equivalent to a one-factor model with all factor loadings fixed to 1 and
with item positioni as an additional predictor (see Fig. 1d).
Model estimation
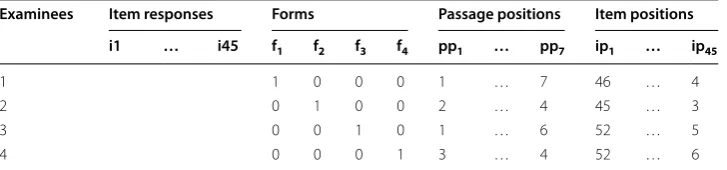
Table 2 demonstrates the layout of the data structure for estimating the four SEM mod-els (M1 to M4) summarized above. The SEM models were estimated using the maximum
likelihood estimation with robust standard errors ‘MLR’ in Mplus 7 (Muthén and Muthén 1998–2015). The MLR estimator was chosen over the maximum likelihood esti-mator because it adjusts the standard errors of the parameter estimates when the data do not meet the multivariate normality assumption, which is often the case with binary and ordinal manifest variables (Li 2016). Mplus also provides alternative model estima-tors—such as WLSMV3 and MLM—for the estimation of FA and SEM models with binary manifest variables [see Brown (2006), chapter 9, for a discussion of the estimators for categorical data]. The Mplus codes for estimating the passage and item position effects are provided in “Appendices 1 and 2”.
All of the SEM models converged in less than two minutes. The estimated regression coefficients for the form, passage, and item position effects were evaluated. Then, the baseline model (i.e., M1) was compared to the other SEM models (M2 to M4) using a
Chi square difference test based on loglikelihood values and scaling correction factors obtained from the SEM models. The scaling correction term (ccorrection) and the adjusted Chi square value (χadjusted2 ) for the difference test can be computed as follows:
(7) y∗i =iη+βi∗item position
i+εi,
3 When the WLSMV estimator was used, the SEM models in the empirical study did not converge due to high correla-tions among passage and item position variables.
Table 2 The layout of the data structure for the SEM analysis
i1 to i45: dichotomous item responses; f1 to f4: dummy variables for the test forms; pp1 to pp7: passage positions; ip1 to ip45: item positions. Only one examinee from each test form was used to demonstrate the data layout
Examinees Item responses Forms Passage positions Item positions i1 … i45 f1 f2 f3 f4 pp1 … pp7 ip1 … ip45
1 1 0 0 0 1 … 7 46 … 4
2 0 1 0 0 2 … 4 45 … 3
3 0 0 1 0 1 … 6 52 … 5
where df is the number of parameters in the model, c is the scaling correction factor, L
is the loglikelihood value from the estimated model, and subscripts 0 and 1 represent the baseline (i.e., M1) and the comparison models (either M2, M3, or M4), respectively.
Finally, the relative fit of the non-nested SEM models (M2, M3, and M4) was compared
using the AIC and BIC model-fit indices.
Results Rasch model
The Rasch model (M1) was the baseline model without any predictors for form, passage
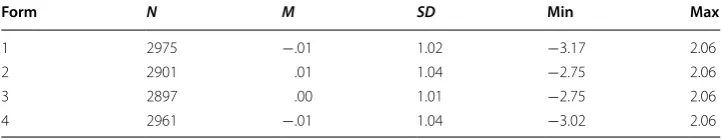
position, or item position effects. Table 3 shows the descriptive statistics of the latent trait estimates obtained from the Rasch model across the four test forms. The distribu-tions of the latent trait from the four test forms were similar when the form effects, pas-sage position effects, and item position effects were ignored.
Form effects
M2 included the indicators for the test forms in the SEM model to examine the overall
differences in the item difficulty levels across the four forms. Using one form as the ref-erence form, the estimated regression coefficients indicated the overall difficulty differ-ences between the reference form and the other three forms. The estimated regression coefficients for the form effects ranged from −0.032 to 0.032. None of the form effects was statistically significant at the alpha level of α =.05, suggesting that the forms did not differ in terms of their overall difficulty.
Passage position effects
Table 4 shows the estimated passage positions effects from M3. The results indicated that
passages 1, 4, and 5 showed significant passage position effects (−.029, −.044, and −.08, respectively). For example, if the position of passage 5 is increased by 1, then difficulties of the items linked to passage 5 would increase by .08 logit. Using the estimated passage position effect, the adjusted difficulty of each item linked to passage 5 can be computed. For example, the first item associated with passage 5 has a difficulty of −2.228. For the (8) ccorrection=
(df0∗c0−df1∗c1)
(df0−df1)
, and
(9) χadjusted2 = −2(L0−L1)
ccorrection
, withdfadjusted=df0−df1,
Table 3 Descriptive statistics of latent trait estimates from the Rasch model across four test forms
Form N M SD Min Max
1 2975 −.01 1.02 −3.17 2.06
2 2901 .01 1.04 −2.75 2.06
3 2897 .00 1.01 −2.75 2.06
students who received passage 5 in the first position on the test, the estimated difficulty of the item becomes −2.228+(1∗.08)= −2.148. If the same passage is administered in
the fifth position, the difficulty of the same item becomes −2.228+(5∗.08)= −1.828 .
Using the estimated position effects in Table 4, the impact of changes in passage posi-tions on item difficulty can be calculated for other items and passages in a similar fashion.
Item position effects
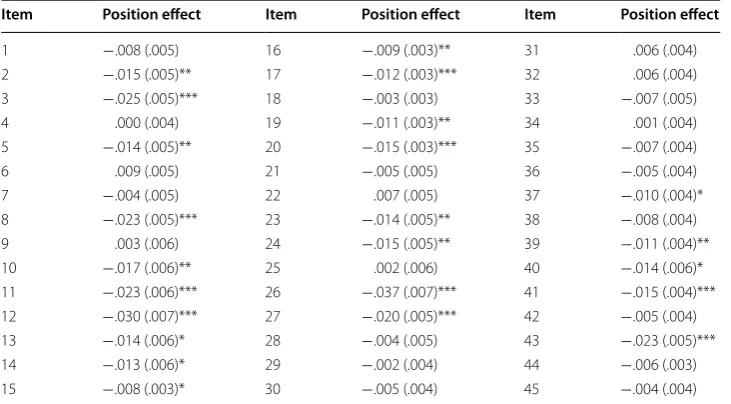
Table 5 shows the estimated item positions effects from M4. The results indicated that 23
out of the 45 items showed significant item position effects. The regression coefficients for item position effects ranged from −.009 to −.037. All of the significant position effects were negative. This finding suggests that as the positions of the items increase (e.g., the item moves from the 1st position to the 15th position), the difficulties of the items also increase and thus the probability of correctly answering the items decrease. The largest item position effect was −.037 for item 26, which had an estimated difficulty Table 4 Summary of estimated passage position effects
The order of passages in Form 1 was used as the reference. Standard errors of the estimated effects are shown in the parentheses
* p < .05, ** p < .01, *** p < .001
Passage Number of items Position effect
1 6 −.029 (.014)*
2 6 .000 (.021)
3 8 .023 (.013)
4 6 −.044 (.015)**
5 6 −.080 (.014)***
6 6 .004 (.014)
7 7 −.008 (.008)
Table 5 Summary of estimated item position effects
* p < .05; ** p < .01; *** p < .001
Item Position effect Item Position effect Item Position effect
1 −.008 (.005) 16 −.009 (.003)** 31 .006 (.004)
2 −.015 (.005)** 17 −.012 (.003)*** 32 .006 (.004)
3 −.025 (.005)*** 18 −.003 (.003) 33 −.007 (.005)
4 .000 (.004) 19 −.011 (.003)** 34 .001 (.004)
5 −.014 (.005)** 20 −.015 (.003)*** 35 −.007 (.004)
6 .009 (.005) 21 −.005 (.005) 36 −.005 (.004)
7 −.004 (.005) 22 .007 (.005) 37 −.010 (.004)*
8 −.023 (.005)*** 23 −.014 (.005)** 38 −.008 (.004)
9 .003 (.006) 24 −.015 (.005)** 39 −.011 (.004)**
10 −.017 (.006)** 25 .002 (.006) 40 −.014 (.006)*
11 −.023 (.006)*** 26 −.037 (.007)*** 41 −.015 (.004)***
12 −.030 (.007)*** 27 −.020 (.005)*** 42 −.005 (.004)
13 −.014 (.006)* 28 −.004 (.005) 43 −.023 (.005)***
14 −.013 (.006)* 29 −.002 (.004) 44 −.006 (.003)
of −3.244. If item 26 was administered in the first position on the test, then the esti-mated difficulty of the item would become −3.244+(1∗.037)= −3.207. If, however, the same item was administered at the 45th position (i.e., the last question) on the test, then the estimated difficulty of the item would become −3.244+(45∗.037)= −1.579 . This finding suggests that changes in the position of this item could substantially increase or decrease the probability of answering the item correctly. Adjusted difficul-ties of other items with regard to their positions on the test can be calculated in the same way.
Model comparison
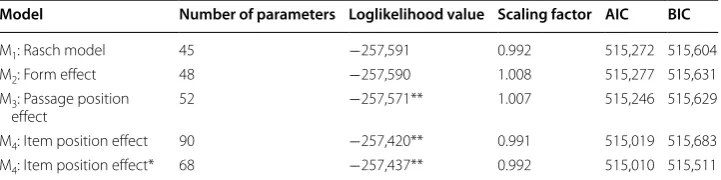
Table 6 shows model fit information from the SEM models. In addition to the four mod-els described earlier, there was a variant of M4 that only included the significant item
position effects in M4. Using the Chi square difference test described in Eqs. 8 and 9, the
SEM models with either passage position or item position effects (M3 and M4) indicated
significantly better model-data fit than the Rasch model (M1), whereas the SEM model
with form effects (M2) was not better than the Rasch model in terms of model-data fit.
This finding is not surprising given the non-significant form effects in M2. Among the
four models that included additional predictors, M2 with form effects indicated the
worst model fit, whereas M4 with only significant item position effects indicated the best
model fit based on both AIC and BIC.
Simulation study
The empirical study demonstrated that the SEM approach is capable of detecting differ-ent types of position effects in large-scale assessmdiffer-ents. In the second part of this study, the Monte Carlo simulation capabilities of Mplus (Muthén and Muthén 1998–2015) were used to investigate the extent to which the proposed SEM approach can detect item position effects accurately. More specifically, the recovery of the SEM model in the presence of a linear position effect on item difficulty was evaluated. Hit rates in detecting items with the linear position effect and Type I error rates in flagging items with no posi-tion effects were examined via simulated data sets.
Simulation design
To model the item characteristics of a large-scale assessment, item difficulty parame-ters obtained from the Rasch model in the empirical study were used as the population
Table 6 Summary of the model fit information from the SEM models
* This model only included the significant item position effects in M4
** The model fits the data significantly better than M1 at the alpha level of α = .05
Model Number of parameters Loglikelihood value Scaling factor AIC BIC
M1: Rasch model 45 −257,591 0.992 515,272 515,604
M2: Form effect 48 −257,590 1.008 515,277 515,631
M3: Passage position
effect 52 −257,571** 1.007 515,246 515,629
M4: Item position effect 90 −257,420** 0.991 515,019 515,683
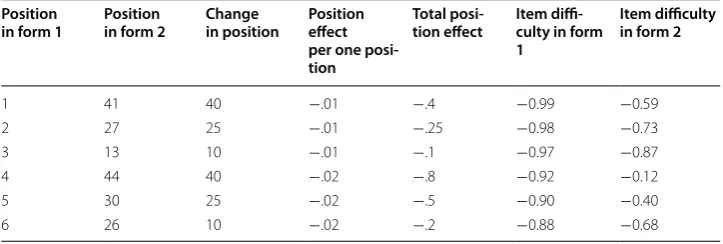
parameters when generating item responses in the simulation study. The item difficulty parameters ranged from −2.894 to 0.196 (M = −1.22, SD = 0.63). Examinees’ latent traits were drawn from a standard normal distribution, η∼N(0, 1). Two test forms with 45 dichotomous items were created. Six items were manipulated to have linear posi-tion effects and the difficulty of the remaining items were not influenced by posiposi-tion changes. Table 7 shows how item difficulty parameters of the six items were manipulated as a result of their positions across the two test forms. There was no correlation between item positions and the latent trait because item positions were randomly determined independent of the latent trait.
The simulation study consisted of three factors: (a) the magnitude of the linear posi-tion effect on item difficulty (.01 and .02 per one posiposi-tion change); (b) sample size (1000, 5000, and 10,000 examinees); and (c) the size of position change for the six manipulated items across two forms (+10, +25, and +40 positions). The chosen values for the linear position effect were similar to those found in the empirical study as well as the position effects reported in earlier studies (e.g., Debeer and Janssen 2013). Similarly, sample size values resemble the number of examinees from previous empirical studies on item posi-tion effects (e.g., Bulut et al. 2016; Debeer and Janssen 2013; Qian 2014; Weirich et al.
2016). For each crossed condition, 1000 data sets were generated.
Model estimation
Each simulated data set was analyzed in Mplus using the SEM model in Eq. 7. Hit rates (i.e., correctly detecting items with a linear position effect) and Type I error rates (i.e., falsely flagging items with no position effects) were evaluated. Furthermore, recovery of item difficulty parameters was studied descriptively with root mean squared error (RMSE) and mean error (ME) as follows:
(10) RMSE= 1
K
K �
k=1 �
�n
i=1(bi− ˆbi)2 n
,
(11) ME= 1
K
K
k=1 n
i=1(bi− ˆbi) n
,
Table 7 Summary of the items with linear position effects in the simulation study Position
in form 1 Position in form 2 Change in position Position effect per one posi-tion
Total
posi-tion effect Item diffi-culty in form 1
Item difficulty in form 2
1 41 40 −.01 −.4 −0.99 −0.59
2 27 25 −.01 −.25 −0.98 −0.73
3 13 10 −.01 −.1 −0.97 −0.87
4 44 40 −.02 −.8 −0.92 −0.12
5 30 25 −.02 −.5 −0.90 −0.40
where bi is the true value of item difficulty of item i,bˆi is the estimated value of item
difficulty for item i, and n is the total number of items (i.e., 45), and K is the number of replications (i.e., 1000).
Results
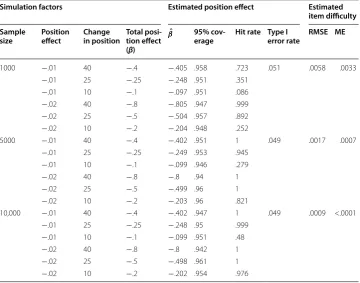
Table 8 shows the results of the simulation study. The 95% coverage indicates the propor-tion of replicapropor-tions for which the 95% confidence interval contains the populapropor-tion value of the linear position effect. Hit rate is the proportion of replications for which the items with position effects were correctly flagged for exhibiting a linear position effect at the α=.05 level. Type I error rate is the average proportion of replications for which the items with no position effects were falsely flagged for exhibiting a linear position effect at the α=.05 level. For every crossed condition, the estimated values of the position effect were very similar to the population values of the position effect. Furthermore, the 95% coverage col-umn in Table 8 shows that the 95% confidence intervals of the estimated position effects covered the population values of the position effects 94% or more of the time. These find-ings suggest that the SEM model could successfully recover the position effect parameters, even when the size of the position effect was small and sample size was not large.
Hit rates appeared to vary depending upon sample size, the magnitude of the posi-tion effect, and the size of posiposi-tion change between two forms. When the magnitude of the position effect was larger (β = −.02 per one position change), hit rates were very high, except for the condition where sample size was 1000 and the size of position change between two forms was 10. Hit rates improved as sample size, the magnitude
Table 8 Hit rates and Type I error rates in the simulation study
Simulation factors Estimated position effect Estimated item difficulty Sample
size Position effect Change in position Total posi-tion effect (β)
ˆ
β 95%
cov-erage Hit rate Type I error rate RMSE ME
1000 −.01 40 −.4 −.405 .958 .723 .051 .0058 .0033
−.01 25 −.25 −.248 .951 .351
−.01 10 −.1 −.097 .951 .086
−.02 40 −.8 −.805 .947 .999
−.02 25 −.5 −.504 .957 .892
−.02 10 −.2 −.204 .948 .252
5000 −.01 40 −.4 −.402 .951 1 .049 .0017 .0007
−.01 25 −.25 −.249 .953 .945
−.01 10 −.1 −.099 .946 .279
−.02 40 −.8 −.8 .94 1
−.02 25 −.5 −.499 .96 1
−.02 10 −.2 −.203 .96 .821
10,000 −.01 40 −.4 −.402 .947 1 .049 .0009 <.0001
−.01 25 −.25 −.248 .95 .999
−.01 10 −.1 −.099 .951 .48
−.02 40 −.8 −.8 .942 1
−.02 25 −.5 −.498 .961 1
of the magnitude of the position effect, and the size of position change between two forms increased. Hit rates for the condition in which the magnitude of the position effect was −.01 per one position change and the size of position change was 10 remained low, despite increasing sample size from 1000 to 10,000. The average Type I error rates for the items with no position effects were near the nominal rate (α =.05), which indicates that the SEM model did not falsely flag items for exhibiting position effects. The RMSE and ME values for the estimates of item difficulty were quite small, suggesting that the recovery of the item difficulty parameters was good. The size of the RMSE and ME val-ues decreased even further as sample size increased.
Discussion and conclusions
Item position effect, which often is viewed as a context effect in assessments (Brennan
1992; Weirich et al. 2016), occurs when the difficulty or discrimination level of a test item varies depending on the location of the item on the test form. For example, the difficulty of an item can increase in later positions due to a fatigue effect or decreas-ing test-takdecreas-ing effort (Hohensinn et al. 2011; Weirich et al. 2016). To investigate item position effects, researchers have proposed different approaches using logistic regres-sion (e.g., Davey and Lee 2011; Pomplun and Ritchie 2004), multilevel IRT models based on the GLMM framework (e.g., Albano 2013; Li et al. 2012; Weirich et al. 2014), and test equating (e.g., Pommerich and Harris 2003; Meyers et al. 2009; Store 2013). The purpose of the current study was to introduce a factor analytic approach for modeling item posi-tion effects using the SEM framework. In the first part of the study, the methodological capabilities of the proposed SEM approach were illustrated in an empirical study using data from an operational testing program in reading. Test form, passage position, and item position effects were investigated. In the second part of the study, a Monte Carlo simulation study was conducted to evaluate the accuracy of the SEM approach in detect-ing item position effects. The simulation study showed that the SEM approach is quite accurate in detecting linear item position effects, except for the conditions in which both the number of examinees and the magnitude of the item position effect are small.
different positions, test forms with completely randomized item ordering for each exami-nee, and multiple matrix booklet designs (Gonzalez and Rutkowski 2010).
Significance and future research
The current study has important implications in terms of educational testing practices. First, this study evaluated position effects in a large-scale assessment. The proposed SEM approach can help practitioners identify problematic test items with significant position effects and thereby leading to large-scale assessments with improved test fair-ness. Second, this study presents a straightforward and efficient approach to investigate different types of position effects (e.g., item position effect, passage position effect, and form effect). Hence, the proposed approach can be easily applied to assessments with a large number of items and examinees. Third, the results of this study can provide guid-ance for further research on position effects in computer-based and computerized adap-tive tests. For example, future research can focus identifying which types of items are more likely to exhibit position effects in based assessments and computer-ized adaptive tests. This can help practitioners select the most appropriate items when designing computer-based assessments and computerized adaptive tests.
This study introduced the SEM model that incorporates interaction effects, but did not investigate the statistical properties of the proposed model. Thus, further research is needed to evaluate the adequacy and accuracy of the proposed SEM model in detecting interaction effects. Given the increasing popularity of multidimensional IRT models, it would also be worthwhile to evaluate position effects in large-scale assessments that meas-ure multiple latent traits. Finally, as Debeer and Janssen (2013) pointed out, there is a lack of research on the underlying reasons of item position effects in large-scale assessments. Future research with the SEM approach can include item-related predictors (e.g., cognitive demand, linguistic complexity) and examinee-related predictors (e.g., gender, test motiva-tion, anxiety) to explain why item position effects occur in large-scale assessments.
Authors’ contributions
OB and MJG developed the theoretical framework for the analysis of position effects using structural equation modeling. Furthermore, OB and QG carried out simulation and real data analyses for the study. All authors read and approved the final manuscript.
Competing interests
The authors declare that they have no competing interests.
Appendix 2: Mplus code for testing item position effects
Received: 27 July 2016 Accepted: 5 February 2017
References
Abedi, J., Leon, S., & Kao, J. C. (2007). Examining differential item functioning in reading assessments for students with dis-abilities. Minneapolis, MN: University of Minnesota, Partnership for Accessible Reading Assessment. Retrieved from
https://nceo.umn.edu/docs/OnlinePubs/PARA/examiningdif/examiningDIFreport.pdf
Akaike, H. (1974). A new look at the statistical model identification. IEEE Transactions on Automatic Control,19(6), 716–723. Albano, A. (2013). Multilevel modeling of item position effects. Journal of Educational Measurement,50(4), 408–426. Alexandrowicz, R., & Matschinger, H. (2008). Estimation of item location effects by means of the generalized logistic
regression model: A simulation study and an application. Psychology Science Quarterly,50, 64–74. Arbuckle, J. L. (2011). IBM SPSS Amos 20 user’s guide. Armonk, NY: IBM Corporation.
Asparouhov, T., & Muthén, B. (2006). Robust Chi square difference testing with mean and variance adjusted test statistics
(Mplus Web Notes No. 10). Retrieved from https://www.statmodel.com/download/webnotes/webnote10.pdf
Asparouhov, T., & Muthén, B. (2016). IRT in Mplus (Technical Report). Retrieved from https://www.statmodel.com/down-load/MplusIRT.pdf
Bentler, P. M., & Wu, E. R. J. C. (2002). EQS 6 for Windows user’s guide. Temple City, CA: Multivariate Software Inc. Brennan, R. L. (1992). The context of context effects. Applied Measurement in Education,5, 225–264. Brown, T. A. (2006). Confirmatory factor analysis for applied research. New York: Guilford.
Bulut, O. (2015). An empirical analysis of gender-based DIF due to test booklet effect. European Journal of Research on Education,3(1), 7–16.
Bulut, O., Lei, M., & Guo, Q. (2016). Item and testlet position effects in computer-based alternate assessments for students with disabilities. International Journal of Research & Method in Education. doi:10.1080/1743727X.2016.1262341. Core Team, R. (2016). R: A language and environment for statistical computing. Vienna: R Foundation for Statistical
Computing.
Davey, T., & Lee, Y. H. (2011). Potential impact of context effects on the scoring and equating of the multistage GRE revised general test (Research Report 11–26). Princeton, NJ: Educational Testing Service.
De Boeck, P., & Wilson, M. (2004). Explanatory item response models: A generalized linear and nonlinear approach. New York, NY: Springer.
Debeer, D., & Janssen, R. (2013). Modeling item-position effects within an IRT framework. Journal of Educational Measure-ment,50(2), 164–185.
Ferrando, P. J., Anguiano-Carrasco, C., & Demestre, J. (2013). Combining IRT and SEM: An hybrid model for fitting responses and response certainties. Structural Equation Modeling,20, 208–225.
Ferrando, P. J., & Lorenzo-Seva, U. (2005). IRT-related factor analytic procedures for testing the equivalence of paper-and-pencil and internet-administered questionnaires. Psychological Methods,10(2), 193–205.
Ferrando, P. J., & Lorenzo-Seva, U. (2013). Unrestricted item factor analysis and some relations with item response theory
(Technical Report). Department of Psychology, Universitat Rovira i Virgili, Tarragona. Retrieved from http://psico.fcep. urv.es/utilitats/factor/documentation/technicalreport.pdf
Finch, H. (2005). The MIMIC model as a method for detecting DIF: Comparison with Mantel-Haenszel, SIBTEST, and the IRT likelihood ratio. Applied Psychological Measurement,29, 278–295.
Fox, J., Nie, Z., & Byrnes, J. (2016). sem: Structural equation models. [Computer software]. http://CRAN.R-project.org/ package=sem
Gonzalez, E., & Rutkowski, L. (2010). Principles of multiple matrix booklet designs and parameter recovery in large-scale assessments. IEA-ETS Research Institute Monograph,3, 125–156.
Hahne, J. (2008). Analyzing position effects within reasoning items using the LLTM for structurally incomplete data.
Psychology Science Quarterly,50(3), 379–390.
Hartig, J., & Buchholz, J. (2012). A multilevel item response model for item position effects and individual persistence.
Psychological Test and Assessment Modeling,54, 418–431.
Hohensinn, C., Kubinger, K. D., Reif, M., Holocher-Ertl, S., Khorramdel, L., & Frebort, M. (2008). Examining item-position effects in large-scale assessment using the linear logistic test model. Psychology Science Quarterly,50, 391–402. Hohensinn, C., Kubinger, K. D., Reif, M., Schleicher, E., & Khorramdel, L. (2011). Analysing item position effects due to test
booklet design within large-scale assessment. Educational Research and Evaluation,17, 497–509.
Jöreskog, K., & Sörbom, D. (2015). LISREL 9.2 for Windows [Computer software]. Skokie, IL: Scientific Software International, Inc.
Jöreskog, K., & Yang, F. (1996). Nonlinear structural equation models: The Kenny-Judd model with interaction effects. In G. A. Marcoulides & R. E. Schumacker (Eds.), Advanced structural equation modeling (pp. 57–89). Mahwah, NJ: Lawrence Erlbaum.
Kamata, A., & Bauer, D. J. (2008). A note on the relation between factor analytic and item response theory models. Struc-tural Equation Modeling,15, 136–153.
Kingston, N. M., & Dorans, N. J. (1984). Item location effects and their implications for IRT equating and adaptive testing.
Applied Psychological Measurement,8, 147–154.
Klein, A., & Moosbrugger, H. (2000). Maximum likelihood estimation of latent interaction effects with the LMS method.
Psychometrika,65, 457–474.
Klein, A., & Muthén, B. (2007). Quasi-maximum likelihood estimation of structural equation models with multiple interac-tion and quadratic effects. Multivariate Behavioral Research,42, 647–673.
Kolen, M. J., & Brennan, R. L. (2014). Test equating, scaling, and linking: Methods and practices (3rd Edition). New York, NY: Springer.
Kolen, M. J., & Harris, D. J. (1990). Comparison of item preequating and random groups equating using IRT and equiper-centile methods. Journal of Educational Measurement,27, 27–39.
Lee, S., Bulut, O., & Suh, Y. (2016). Multidimensional extension of multiple indicators multiple causes models to detect DIF.
Educational and Psychological Measurement. doi:10.1177/0013164416651116.
Li, C.-H. (2016). Confirmatory factor analysis with ordinal data: Comparing robust maximum likelihood and diagonally weighted least squares. Behavior Research Methods,48(3), 936–949.
Li, F., Cohen, A., & Shen, L. (2012). Investigating the effect of item position in computer-based tests. Journal of Educational Measurement,49(4), 362–379.
Lu, I. R. R., Thomas, D. R., & Zumbo, B. D. (2005). Embedding IRT in structural equation models: A comparison with regres-sion based on IRT scores. Structural Equation Modeling,12(2), 263–277.
MacIntosh, R., & Hashim, S. (2003). Variance estimation for converting MIMIC model parameters to IRT parameters in DIF analysis. Applied Psychological Measurement,27(5), 372–379.
Marsh, H. W., Wen, Z., & Hau, K. T. (2004). Structural equation models of latent interactions: Evaluation of alternative esti-mation strategies and indicator construction. Psychological Methods,9, 275–300.
Martin, M. O., Mullis, I. V. S., Gonzalez, E. J., & Chrostowski, S. J. (2004). TIMSS 2003 international science report: Findings from IEA’s Trends in International Mathematics and Science Study at the fourth and eighth grades. Chestnut Hill, MA: Boston College.
McDonald, R. P. (1999). Test theory: Unified treatment. Mahwah, NJ: Lawrence Erlbaum Associates Inc.
Meyers, J. L., Miller, G. E., & Way, W. D. (2009). Item position and item difficulty change in an IRT-based common item equating design. Applied Measurement in Education,22(1), 38–60.
Millsap, R. E., & Yun-Tein, J. (2004). Assessing factorial invariance in ordered-categorical measures. Multivariate Behavioral Research,39, 479–515.
Moosbrugger, H., Schermelleh-Engel, K., Kelava, A., & Klein, A. G. (2009). Testing multiple nonlinear effects in structural equation modelling: A comparison of alternative estimation approaches. In T. Teo & M. S. Khine (Eds.), Structural equation modeling in educational research: Concepts and applications (pp. 103–136). Rotterdam: Sense.
Moses, I., Yang, W., & Wilson, C. (2007). Using kernel equating to assess item order effects on test scores. Journal of Educa-tional Measurement,44, 157–178.
Muthén, B. O., & Asparouhov, T. (2002). Latent variable analysis with categorical outcomes: Multiple-group and growth modeling in Mplus (Mplus Web Note No. 4). Retrieved from https://www.statmodel.com/download/webnotes/Cat-MGLong.pdf
Muthén, L. K., & Muthén, B. O. (1998–2015). Mplus User’s Guide Seventh Edition. Los Angeles, CA: Muthén & Muthén. Pommerich, M., & Harris, D. J. (2003). Context effects in pretesting: Impact on item statistics and examinee scores. Paper
pre-sented at the Annual Meeting of the American Educational Research Association, Chicago, IL.
Pomplun, M., & Ritchie, T. (2004). An investigation of context effects for item randomization within testlets. Journal of Educational Computing Research,30(3), 243–254.
Pritikin, J. N., Hunter, M. D., & Boker, S. M. (2015). Modular open-source software for item factor analysis. Educational and Psychological Measurement,75(3), 458–474.
Qian, J. (2014). An investigation of position effects in large-scale writing assessments. Applied Psychological Measurement, 38(7), 518–534. doi:10.1177/0146621614534312
Rasch, G. (1960). Probabilistic models for some intelligence and achievement tests. Chicago, IL: The University of Chicago Press.
Robitzsch, A. (2009). Methodische Herausforderungen bei der Kalibrierung von Leistungstests [Methodical challenges in the calibration of achievement tests]. In D. Granzer, O. Köller, A. Bremerich-Vos, M. van den Heuvel-Panhuizen, K. Reiss, & G. Walther (Eds.), Bildungsstandards Deutsch und Mathematik (pp. 42–106). Weinheim: Beltz.
Satorra, A., & Bentler, P. M. (2001). A scaled difference Chi square test statistic for moments structure analysis. Psycho-metrika,66, 507–514.
Schwarz, G. (1978). Estimating the dimension of a model. The Annals of Statistics,6, 461–464.
Schweizer, K. (2012). The position effect in reasoning items considered from the CFA perspective. International Journal of Educational and Psychological Assessment,11, 44–58.
Schweizer, K., Schreiner, M., & Gold, A. (2009). The confirmatory investigation of APM items with loadings as a function of the position and easiness of items: A two dimensional model of APM. Psychology Science Quarterly,51, 47–64. Store, D. (2013). Item parameter changes and equating: An examination of the effects of lack of item parameter invariance
on equating and score accuracy for different proficiency levels (Unpublished doctoral dissertation). Greensboro, NC: The University of North Carolina.
Takane, Y., & de Leeuw, J. (1987). On the relationship between item response theory and factor analysis of discretized variables. Psychometrika,52, 393–408.
Umbach, N., Naumann, K., Hoppe, D., Brandt, H., Kelava, A., & Schmitz, B. (2017). nlsem: Fitting structural equation mixture models. [Computer software]. http://CRAN.R-project.org/package=nlsem
van der Linden, W. J., Breithaupt, K., Chuah, S. C., & Zhang, Y. (2007). Detecting differential speededness in multistage test-ing. Journal of Educational Measurement,44, 117–130.
Weirich, S., Hecht, M., & Bӧhme, K. (2014). Modeling item position effects using generalized linear mixed models. Applied Psychological Measurement,38(7), 535–548.
Weirich, S., Hecht, M., Penk, C., Roppelt, A., & Bӧhme, K. (2016). Item position effects are moderated by changes in test-taking effort. Applied Psychological Measurement. doi:10.1177/0146621616676791.
Wise, S. L., & Kong, X. (2005). Response time effort: A new measure of examinee motivation in computer-based tests.
Applied Measurement in Education,18(2), 163–183.