Students' Perceptions of Computerized
TOEFL Test
PARVANE AZADI NOUBANDEGANI Tarbiat Modares University- Tehran
Bio Data:
Parvaneh Azadi Nobandegani is a M.A. graduate in the field of Teaching English as a foreign language from Tarbiat Modares University of Tehran. She has been teaching English in different language institutes in cities of Tehran and Shiraz.
Abstract
The present study investigated students' perception of computerized TOEFL test. Subject of this study were 100 adult male and female students who took the iBT TOEFL test in Iran. Participants were provided with a researcher-developed questionnaire on the advantages and disadvantages of Computer-Based Test (CBT) compared to Paper-Based Test (PBT). The collected data were analyzed using descriptive statistics and factor analysis to investigate the perceptions of the students. Results of this study showed that students perceived the disadvantages of CBT were more than its advantages.
Keywords: Computer-Based Test (CBT), Paper-Based Test (PBT), TOEFL
test, Students' Perceptions
Introduction
An abundance of literature has been written regarding the application of Computer Assisted Language Testing, (CALT), but few studies have been done considering learners' perceptions of computerized language tests. Although it is being proved that these tests can be very useful in the realm of language testing, something which is not clear is whether students prefer these tests over paper and pencil tests (Pino-Silva, 2008). This issue is the topic which will be considered in the present research.
much more difficult to develop for computer-assisted testing (Silye and Wiwczaroki, 1999). The new technologies such as the CD-ROM and interactive video discussed in Brown (1992a) make it possible for students to interact with a computer. Based on the available literature many advantages and disadvantages have been mentioned for these types of tests by many researchers in this field. Among the advantages which have been mentioned for computer-based tests (CBT) two important issues are really noteworthy. These two points which have been posed by Brown (1997) relate to the administration time and place for high-stake tests and time of delivery and administration. By using computerized tests there is no need for fixed delivery time and also traditional time and place of administration are not important any more.
Purpose of the Study
Computers are beginning to be used to deliver language tests in many settings. A computer-based version of the Test of English as a Foreign Language (TOEFL) was introduced on a regional basis in the summer of 1998. More and more both the computer and the Internet are beginning to be used to deliver tests to users who are at a distance (Pino-Silva, 2008). A large amount of literature on computer-assisted language learning exists about using computers in classrooms and computer assisted language learning issue but less is done about computer-assisted language testing which is considered as one of the important subjects of teaching and testing. However, it should not be denied that a lot of work has been done on the comparisons of students' performances in computer-based and paper-and-pencil tests; and also, there are studies dealing with comparison of the validity and reliability of these tests. But these researches only focus on the comparison of students' performances in computerized tests and paper-based tests or investigating the validity and reliability of these two kinds of tests. Very few studies have been done to investigate the important issue of students' belief and perception about computer-based tests. Since nowadays traditional tests are being replaced with computer-based tests, the researcher believes that investigating examinees' viewpoints can be very valuable to promote these kinds of tests. As far as the examinees' performance is concerned, their perceptions and attitudes are among the psychological factors that can affect the validity and reliability of the test. Although the previous literature mentions many advantages and disadvantages of these tests, it is not clear whether the examinees still prefer computer-based tests over paper-based ones. Therefore, investigating this issue seems really necessary. Based on the aim of this study the following research question is provided:
What are the students' perceptions ofthe advantages and disadvantages of a
computer-based test of TOEFL?
Literature Review
English as a Foreign Language (TOEFL) have performed on computers and internet-based tests (IBT) are replacing the traditional paper-and-pencil tests (Alderson, 2000). In this chapter, the aim is to consider the topic of Computer Assisted Language Testing (CALT) and the related issues.
Comparison of Traditional Paper-Pencil Tests and Computer-Based Tests
Since computer-based testing has been introduced to the field of language testing, there have been many arguments about the possible problems accompanying these kinds of tests and many comparisons have been performed between CBT and traditional pare-and-pencil tests. Dooey (2008) believes that although many advantages can be gained of technology using in language testing, practitioners must be very careful in applying the new technology when using it for high-stake tests like IELTS and TOEFL tests because these tests provide an assessment of English language proficiency. These concerns show that there are some clear and hidden aspects of using technology in testing which may cause some problems or have impacts on the examinee's performance. This section deals with these comparisons done in the past literature. In an article on the impact of individual differences on the equivalence of computer-based and paper-and-pencil educational assessments, McDonald (2002) states that the use of computers and related technologies increasingly impacts on all areas of our daily lives. Bennet (1998) in an article on the impact of computers on educational testing, presents three possible generations of testing system. The first generation is very similar to the traditional paper-pencil test and takes very little advantage of technology. The second generation has included new item formats (e.g. through using multimedia technology). And the third generation is an assessment which is more based on the principles of cognitive psychology which are called computer-adaptive tests. In these tests, questions are tailored to the ability of the test takers. If the test taker can answer a question correctly will next be presented with a somewhat more difficult question and if he /she answers the provided question incorrectly he/she will be presented with an easier item. So, these types of tests which are adaptive are considered more efficient than paper-and-pencil tests which just cover a broader range of ability and require more questions (McDonald, 2002).
However, some believe that computer-assisted tests and paper-based tests are the same, just the test delivery format is changed and beneficial aspects of computer are not effectively used in preparing tests. So, the only advantages of these tests are now the reliability of scoring, savings in time and easier analysis of results (Singletone, 1997).
Factors Affecting Equivalence
argues that regarding the issue of presenting format and putting the examinees in different situations, the problem of equivalence must be considered more carefully. But some other researchers believe that equivalent CBT and P&P test should not be differentially affected by individual differences (Tseng, Tiplady, Macload, and Wright, 1998). However, CBT and P&P test considered different testing experiences for test takers and this problem can be a factor that can affect the reliability of tests.
In a model provided by McDonald (2002), it was showed that test performances result from an interaction between the test taker and test itself, in this model, the key aspect of the test was whether it is paper or computer-based. He wanted to investigate whether the examinee's performance differ regarding the type of test they take or the difference in the kind of testing experience (here delivery format) can affect their performance or not. He states that if these individual reactions differ as a result of the varying test format, they will affect the construct measured by each test.
In an article McDonald (2002), who is analyzing the issue of equivalence in CBT and P&P tests states that reactions to CBT root in individual differences of test takers. He states that still the use of CBT is in its infancy but undoubtedly in the near future it will become a very important part of language testing. He adds that this can affect the attitudes and beliefs about CBT will be changed as a result. He believes that although for example in 10 years ago lack of familiarity with computer was not such an important issue, now with the widespread use of computers in every aspect of life no more it can be un-important. He continues that in the near future use of CBT becomes a norm for assessment comparing to P&P which is now considered as a norm (McDonald, 2002).
Computer experience and familiarity. "The extent to which test takers have experience of using computers has been argued to influence their performance on
computerized test" Brown (2002). As mentioned in the literature, the amount of
computer use can be an indicator of experience (McDonald, 2002). For example, Pelgrum, Jenssen, Reinen, and Plomp, (1993) surveyed 10 countries and found that between 3 and 89% of elementary and secondary school children did not use computers. Weil and Rosen (1995) assessed computer experience in university students from 23 countries between 1992 and 1994, and found this to vary from 25 to 98% between countries. Those who have worked in the field of CBT and computer familiarity note that computer familiarity is considerable in number of ways. For example Taylor, Kirsch, Eignor, and Jamieson (1999), in their study state that computer familiarity includes: " experience, frequency of use, type of use, number of courses involving computers, owning a computer, access to computers, attitudes towards computers, and related technologies". Taylor et al (1999) constructed a measure of computer familiarity. They believed that computer familiarity is a factor which has sub-factors like access, attitudes, and computer use.
Mazzeo, Druesne, Raffeld, Checketts, and Muhlstein (1991) obtained mixed results from a series of studies using college examinations of English and math. In one study a significant negative effect for experience was seen on a math test, and less experienced students obtained higher scores. In a subsequent research by the same authors in which they used math and English tests failed to replicate this finding and so they stated that this finding had been a chance finding. But because of methodological limitations they concluded that further work is needed on familiarity.
Several studies discussed the effect of computer familiarity on performance and the characterization of the learners in terms of computer familiarity (Kirsch, Jamieson, Taylor, & Eignor, 1998; Taylor, Jamieson, Eignor, & Kirsch, 1998). Kirsch, et al (1998) surveyed 90.000 TOEFL examinees in their first phase of their study in April and May of 1996 regarding their access to computers, their attitude about computers, and experience they have with using computers and investigated the relationship among proficiency as measured by paper-and-pencil TOEFL test, background characteristics, and computer familiarity. The study showed that there were differences regarding the computer familiarity defined by native language and region. It was also discussed that a small but significant relationship existed between computer familiarity and TOEFL test scores on the paper-and-pencil test. With regards to the results, it was suggested that computer familiarization was necessary for the individuals who would take the computer-based TOEFL and writing classes could include word-processing.
Computer anxiety. "Computer anxiety refers to the fear experienced when interacting with a computer or anticipating an interaction" (Brown, 2000). Some believe that computer anxiety to some extent overlap with computer confidence and these two are essentially the same (Levine, and Smidth, 1997). Some of the researchers who have studies in the realm of CBT and individual differences like Durndell and Lightbody (1994) first assumed that computer anxiety results from lack of examinee's experiences in using computers, and if they become more familiar with computer use, anxiety must be reduced. But contrary to their first assumption, based on the results of their study they reported that despite the spread of computers, there was no evidence of a decrease in computer anxiety. Todman and Lawreson (1992) who also tried to investigate this issue similarly failed to fix a link between computer experience and anxiety in university students or school children.
There are some other works that support the earlier assumption, namely the belief that computer anxiety results from a lack of familiarity with compute. For example, Levine and Schmidt (1998) found that greater computer use and experience to increase confidence and Weil and Rosen (1995) found computer experience was related to lower levels of "technophobia" in 19 of the 23 countries they studied. A study by Chua, Chen, and Wong (1999) confirmed an inverse association between computer experience and level of computer anxiety, but they found that the extent of this association varies considerably between studies.
anxiety reduces the capacity of working memory (Eysenck, 1988). Some of the symptoms of anxiety are worry and self-concern that they may interfere with the tasks that test takers want to do in a test. In terms of computer use, criteria such as speed of performance or errors have been studied. But these criteria have been found to be independent of anxiety (e.g. Bloom and Szanja), although Tseng, Tiplady, Macleod, and Wright (1998) have provided contrary findings, they found that speed of performance or error relate to anxiety.
Although available evidence show that computer anxiety can have a negative effect on test score but some researchers believe that both using computers and taking tests are considered as potential sources of anxiety ( Gallangar and Gos, 1988). And test anxiety alone can have a significant impact on test performance (McDonald, 2002). Generally anxiety may result from limited computer experience or the test taking situation or both of them.
Computer attitudes. Attitudes towards computer can be a mixture of computer familiarity and computer anxiety or it can overlap the combination of these two factors (McDonald, 2002). May be this is because computer attitudes are usually really shaped by experience and anxiety and confidence and people's attitudes are based on these two factors. The importance of positive attitudes towards computer has been considered a prerequisite for developing computer-skill (McDonald, 2002). Kay and Levine (1993) have suggested that by increasing computer use more positive attitudes towards computers can be gained. Also, in another research by Burke, Norman, and Raju (1987) a similar positive relation between experience and acceptance of CBA was observed. However, it can denote that increased exposure will have a positive effect on attitudes. Al-Ghahtani and King (1999) have highlighted the importance of the actual computer systems or programs; they state that to the extent that computer systems can be compatible with the students' needs, computer usage receives more importance.
A study of attitudes to CBA and P&P testing by Singleton, Horne, and Vincent (1995) has reported that high ability children did not mind taking a reading test on paper, but low ability children saw this as more threatening and they were less willing to participate. Poor readers were much happier to take the computer-based version of the same test, as the computer was not seen as threatening. It was shown that computer tests are more attractive to children. Segall and Moreno (1999) performed a study in a military setting and it was reported that they had positive attitudes towards CBA. Another research was done on adult basic education by Zanddvliet and Farragher (1997) and they also had the same results.
Greaud and Green (1986) investigated the effect of mode of presentation on the numerical operations (NO) and coding speed (CS) subtests of the Armed Services Vocational Aptitude Battery (ASVAB) they administered this test to applicants for the U.S. military services. Fifty college students took short versions of the two subtests. The CAT versions were completed faster by the subjects, who did better on the CAT versions in general. Moreover, when the average number of correct responses per minute was used as the test score, the between-mode correlation coefficients for the coding speed subtest remained low to moderate when corrected for reduction, while the within-mode correlations for both subtests and the between-mode correlations for the numerical operations subtest were high. Based on this study the authors stated that there are two possible explanations: (a) "marking a bubble" on an answer sheet in P&P test and "pressing a button" to enter an answer on a CAT may require different motor skills (p.33); and (b) "keeping track of the location of the items presented as a group was part of the task in the highly-speeded P&P test" while it was not the case for the CAT version, where items were displayed one by one on a computer screen.
Advantages and Limitations of CBT
Over the past few decades, a large literature has examined the effectiveness of computer-assisted language (CALL). The findings indicate that language learners have generally positive attitudes towards using computers in the classrooms. But less is known about the field of computers in language testing. For example, Brown (1992b) and others have investigated both advantages and limitations of computers in language testing. In this section we will mention the most important points posed by different authors specially Brown (1992b).
Brown (1992a) and (1992b) has divided the advantages of using computers in language testing from two angles of testing methodology and human considerations. Here, we will refer to some of the most important points posed by Brown (1992a) and (1992b) and some other authors:
- Regarding the scoring selected-response tests computers are much more accurate than human beings (Brown, 1992b).
- Computers can provide immediate feedback (Brown, 1992b).
- CBT allows tester to examine the specific ability levels of students and it is a precise evaluation of those abilities (Bock and Mislevy, 1982b).
- In CBT students can be provided with quick "diagnostic" feedback (Brown, 1992b).
- "The use of computers allows the students to work at their own pace" (Brown, 1992b).
- CBT takes less time to be finished comparing to PBT (Brown, 1992b).
- In CBT students get less frustrated because provided questions (Brown, 1992b).
- Because in CBT questions are provided one at a time on the screen, the testing procedure is not as tiresome as PBT (Brown, 1992).
- Computer equipments may not always be available or if they are, it might that they are not reliable (Brown, 1992b).
- One of the problems is the screen size limitations specially for developing
long passages for reading (Brown, 1992).
- "Graphic capabilities of many computers especially older ones may be
limited"(Brown, 1992).
- Differences in student's familiarity degree with computers or their ability
to work keyboard can be a differentiating problem (Henning 1991).
- Another disadvantage of CBT is computer anxiety (Henning 1991).
However, these days' experts in the field of language testing specially CBT are trying to delete these limitations through developing computer-adaptive tests particularly for compositions and speech samples or by using the web and other electronic tools.
Although CBT has its own advantages and many students and practitioners like it, there are some possible dangers in such innovations. Many evaluators believe that CBTs are limited in the item types. Multiple-choice items are good and compatible to computers and also cloze and gap-filling techniques are frequently used in CBT because they are appropriate for CBT. But other item types are more difficult to be used in CBT since the items which are used in CBT must be machine-score able (Alderson, 1995).
Methodology
Participants
Participants of this study included 100 male and female students who participated in iBT TOEFL (internet-based test of TOEFL) test administered by ETS (Educational Testing System) in the Assessment department (Sanjesh Organization) in Tehran on
two different administration days, 21st of July and 27th of July 2009. The subjects
were selected randomly among the whole iBT TOEFL participants by the researcher to answer a questionnaire which was considered as the instrument of this study. All the participants were adults aged 20 to 46 who were taking this test for different purposes with different levels of proficiency.
Instrumentation
Questionnaire. A questionnaire which had been developed by the researcher on the basis of the advantages and disadvantages of computer-based test of TOEFL and comparing this kind of test with the paper-based version (PBT) was used as the instrument of this study to collect the required data. Since no standard questionnaire existed on this topic the researcher had to develop a questionnaire. The processes of developing this questionnaire will be explained completely in the following parts.
Procedures
validating phase, the prepared questionnaires were distributed among the participants. In the next section the statistical analysis done in this study will be explained.
Statistical Analysis
In this study some different kinds of statistical tests were used. Descriptive procedures were used to summarize the data. The total score of each scale was computed by averaging over items related to the scale and used in the analysis. For analyzing the data, both descriptive and inferential statistics were used.
To determine whether uni-variate normality exists, the distribution of each observed variable for skewness and kurtosis were examined. These summary statistics are used because for large sample sizes, the normality of the test of Kolmogorov-Smirnov tends toward rejecting the null hypothesis of normal distribution.
Also, Cronbach’s Alpha coefficient was computed for evaluating scale internal consistency reliability for hypothetical scales and scales extracted by factor analysis. In exploratory and descriptive studies, values higher than 0.6, are considered satisfactory (Kline, 2005).
In the part of inferential statistics, Factor Analysis was used for structure detection. The purpose of structure detection is to examine the underlying (or latent) relationships between the variables. Factor analysis was performed by Extraction Method of Principal Axis Factoring and Varimax Rotation with Kaiser Normalization was used to extract the factor structure.
Results and Discussion
Descriptive Statistical Results
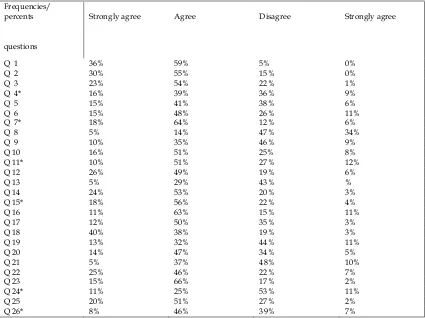
As mentioned in the previous chapter, to investigate the students' perception of computer-based test of TOEFL a questionnaire was developed. This questionnaire contained 26 questions concerned with different points about students' perception of computer-based test of TOEFL and comparing this kind of test with the paper-based version. The questionnaire can be observed in the appendix.
Table 5.1
Descriptive Analysis of the Questions
Frequencies/ percents
questions
Strongly agree Agree Disagree Strongly agree
Q 1 36% 59% 5% 0%
Q 2 30% 55% 15% 0%
Q 3 23% 54% 22% 1%
Q 4* 16% 39% 36% 9%
Q 5 15% 41% 38% 6%
Q 6 15% 48% 26% 11%
Q 7* 18% 64% 12% 6%
Q 8 5% 14% 47% 34%
Q 9 10% 35% 46% 9%
Q 10 16% 51% 25% 8%
Q 11* 10% 51% 27% 12%
Q 12 26% 49% 19% 6%
Q 13 5% 29% 43% %
Q 14 24% 53% 20% 3%
Q 15* 18% 56% 22% 4%
Q 16 11% 63% 15% 11%
Q 17 12% 50% 35% 3%
Q 18 40% 38% 19% 3%
Q 19 13% 32% 44% 11%
Q 20 14% 47% 34% 5%
Q 21 5% 37% 48% 10%
Q 22 25% 46% 22% 7%
Q 23 15% 66% 17% 2%
Q 24* 11% 25% 53% 11%
Q 25 20% 51% 27% 2%
Q 26* 8% 46% 39% 7%
* denotes the items which were deleted in factor analysis.
Now, to investigating the results of all the questions based on the above table the descriptive statistics of each question are reported in detail. As the number of participants of this study was 100 people, frequencies and percents are the same; so the numbers that are mentioned in the following part represent both frequency and percent.
For item number one that is: "Computer familiarity can affect the examinees' performance positively" as we can see in table 4.1, %5 of the respondents disagreed, %59 agreed and %36 of them strongly agree with this subject.
Item number two is as follows: "Not having sophisticated ability to type with computer can affect the test performance in CBT (computer-based test) version in a negative way. Majority of the respondents, %50 agreed with this item, some of them, %30 strongly agreed and a small number of them, %15 disagreed about this point.
In item number three we have: Computer anxiety can affect examinees' performance negatively. Based on the results of the above table, %54 of the respondents show that they agree with this point that computer anxiety can affect examinees' performance negatively, only few strongly disagreed and about %22 disagreed.
nearly closed to each other and the result was %36 and %39 for each one respectively. But %16 strongly agreed and only %9 strongly disagreed.
In item number five we have: CBT may offer reduced control of the test taker over the test compared to PBT (paper-based test) (not allowing review or skipping questions). As can be seen in the table above, %6 of the respondents strongly disagreed, %38 disagreed %41 agreed, and %15 of them strongly agreed with this subject.
For item number six which concerns with the relationship of testing condition of CBT and anxiety, most of the respondents agreed with this item, some of them, %26 disagreed, %11 strongly disagreed and %15 strongly agreed that testing condition in CBT can be a source of anxiety.
Item number seven aims to know whether in their opinion there is a relationship between the experience of working with computer and test anxiety in CBT or not. With %64 the majority of the respondents agreed to this question, only a few strongly disagreed and respectively %12 and %18 disagreed and strongly agreed with this item.
In item number eight we have: There is NOT any difference between PBT (paper-based test) and CBT regarding the accuracy of scoring. %34 of the respondents showed that strongly disagreed, %47 disagreed, %14 agreed, and only %5 of them strongly agreed with this subject.
Question number nine says that, "Examinees experience less fatigue with CBT comparing to PBT. Most of the respondents disagree with this question, and some of them, %35 agreed, the percentages of people who were strongly disagreed and strongly agreed were much closed and they were %9 and %10 respectively.
For item number ten which deals with the issue that Use of computers allows the examinees to work on their own pace, we see that %8 of the respondents strongly disagree, %25 disagreed %51% agreed, and %16 of them strongly agreed with this subject.
For question number eleven that is: Because CBT presents the questions one by one at a time, it can make the test easier to take" based on the results it is observed that majority of the respondents agreed, those who disagreed were %27 and only %10 strongly agreed, also %12 strongly disagreed.
More administration dates options which is claimed to be provided by CBT compared with PBT in the issue which has been dealt with in question number twelve. As it is clear from table 4.1 %6 of the respondents strongly disagreed, %19 disagreed %49 agreed, and %26 of them strongly agreed with this subject.
In the item number thirteen that is "There is Not any difference between CBT
and PBT regarding the immediate availability of test results" percent of the people who had disagreed to it is more than others, in addition, %29 of the participants agreed with this item and %23 strongly disagreed only a few percents strongly agreed.
Item number fifteen deals with the choice of CBT which reduces the handwriting problems. Referring to the above table %56 showed that they agreed that CBT reduces handwriting problems. Only a few strongly disagreed and %22 and %18 respectively disagreed and strongly agreed.
Item sixteen of the questionnaire concerns the possibility of occurring some problems regarding the disability of the test-takers' disability to use mouse and keyboard. Percents show that the majority of the participants agreed with this point and percents of those who strongly disagreed and strongly agreed were equal. The remaining disagreed with this item.
Item number seventeen:" CBT provides more convenient times for test takers to take the test", as it is observed in table 1, %3 of the respondents strongly disagreed, %35 disagree %50 agreed, and %12 of them strongly agreed with this subject.
In item eighteen the percent of those who agreed and strongly agreed that reading from computer screen is more difficult than reading from pages were much closed to each other and they were %38 and %40 respectively. Furthermore, %19 showed that they disagreed and only %3 strongly disagreed.
Item nineteen says that "Marking the correct choice on the answer sheet in PBT and pressing a button in CBT can have different results in performance. Most people disagreed, while only %11 strongly disagreed and %32 and %13 agreed and strongly agreed with this item respectively.
In item number twenty, majority of the participants agreed that keeping track of the location of items presented as a group in PBT is easier than items in CBT which are presented one by one. Only a few strongly disagreed, and in addition, %34 disagreed and the remaining %14 of them strongly agreed with this point.
The percent of those participants who disagreed that CBT is limited in item type compared to PBT was %48; however, %37 agreed with it and %10 strongly disagreed. Only %5 strongly agreed to it.
In item number twenty two, it is mentioned that for CBT equipments may not always be available or reliable, especially in older systems. As can be seen in the table 4.1, %7 of the respondents strongly disagreed, %22 disagree %46 agreed, and %25 of them strongly agreed with this subject.
Item number twenty three deals with the graphic capabilities of computers in CBT. In this item most of the participants agreed that in CBT the graphic capabilities of some computers specially the older ones may be limited so it may affect the examinee's performance. %17 and %15 respectively disagreed and strongly agreed, but just %2 strongly disagreed.
In next item, percents of those who strongly agreed and strongly disagreed that because in CBT failure may occur during the testing procedures, participants prefer NOT to choose it were equal but most of the participants disagreed with this issue and %25 agreed with it.
At last in item twenty six, most of the participants agreed that in CBT there is not the danger of skipping items. A few of them namely %7 and %8 respectively strongly disagreed and strongly agreed and %39 disagreed.
In the next stage regarding the research question of this study Factor Analysis was used for structure detection. The purpose of structure detection is to examine the underlying (or latent) relationships between the variables. Now the results of factor analysis are resented in the following part.
Factor Analysis (F1)
To investigate the results of the research question, Factor Analysis was used for structure detection. The purpose of structure detection is to examine the underlying (or latent) relationships between the variables. For the performed factor analysis the factors are extracted in their importance order, so that the factor number one is the most important factor. Also, in each factor, the value of loading (correlation between item and factor), determines the order of the variable in the factor, so that the item with greatest absolute value is the most important item (see the questionnaire in appendix 1). For the factor analysis which was performed the results of the Model Adequacy are shown in the table below:
Table 5.2
The Results of Model Adequacy- KMO and Bartlett's Test
Kaiser-Meyer-Olkin Measure of Sampling Adequacy. .625
Bartlett's Test of Sphericity
Approx. Chi-Square 62.164
df 21
Sig. .000
Total Variance Explained 36.679
KMO shows a reasonable fit of the model, and the results of the Bartlet’s test confirm this (p<0.05). Also, the total variance explained was %36.7.
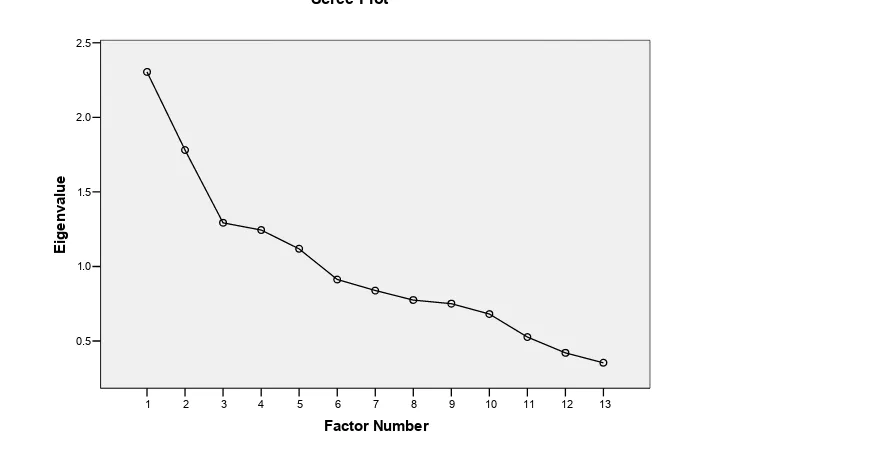
Figure5.1. Screen-plot of the factor importance
7 6
5 4
3 2
1
Factor Number
1.6
1.4
1.2
1.0
0.8
0.6
0.4
Eigenvalue
Scree Plot
Based on the figure above, the entire important factors produced by the analysis are placed in the most descent part of the plot. Based on this plot and other criteria, 3 factors were extracted for this scale.
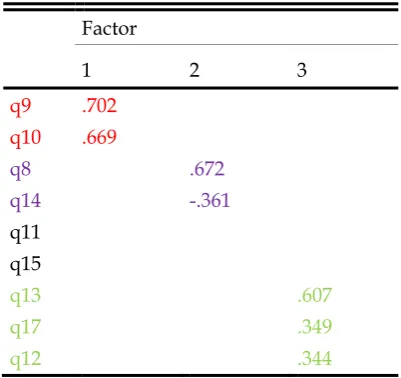
The following table shows the results of factors extracted by the factor analysis for this scale:
Table 5. 3
Rotated Factor Matrix 1
Factor
1 2 3
q9 .702
q10 .669
q8 .672
q14 -.361
q11 q15
q13 .607
q17 .349
q12 .344
Extraction Method: Principal Axis Factoring.
Rotation Method: Varimax with Kaiser Normalization.
F1_1: q9 and q10 F1_2: q8 and q14
F1_3: q 13, q17 and q12
In the next part, results of the Factor Analysis 2 and the related tables and figures will be reported.
Factor Analysis (F2)
As it is seen, in the previous sections based on factor analysis F1, 3 factors were extracted from factor analysis F1. Now in this phase we performed Factor Analysis F2 and the results will be provided here. First of all, in order to show the adequacy of the model in the following table the results of the model adequacy are presented in table 4.4:
Table 5.4
Results of the Model Adequacy for Factor Analysis F1
KMO and Bartlett's Test
Kaiser-Meyer-Olkin Measure of Sampling Adequacy. .603
Bartlett's Test of Sphericity
Approx. Chi-Square 163.238
df 78
Sig. .000
Total Variance Explained 31.427
KMO shows a reasonable fit of the model, and the results of the Bartlet’s test confirm this (p<0.05). Also the total variance explained was %31.43.
Screen plot of the factors importance are shown below:
Figure5. 2. Screen-plot of the factor analysis importance F2
13 12 11 10 9 8 7 6 5 4 3 2 1
Factor Number
2.5
2.0
1.5
1.0
0.5
Eigenvalue
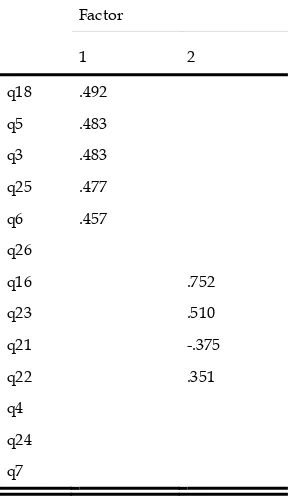
The entire important factors produced by the analysis are placed in the most descent part of the plot. Based on this plot, and other criteria, 2 factors were extracted for this scale. Furthermore, table below shows the results of factors extracted by the factor analysis for this scale:
Table 5.5
Rotated Factor Matrix (a) F2
Factor
1 2
q18 .492 q5 .483
q3 .483
q25 .477 q6 .457
q26
q16 .752
q23 .510
q21 -.375
q22 .351
q4 q24
q7
Extraction Method: Principal Axis Factoring.
Rotation Method: Varimax with Kaiser Normalization.
Based on the results, 2 factors were extracted. Positive values show direct relationship of the item and factor.
As can be seen, items q26, q4, q24 and q7 have been deleted, since their loadings are less than 0.3. For each factor a name must be suggested. They are named as F2_1 to F2_2 as follow:
F2_1: q18, q5, q3, q25 and q6 F2_2: q16, q23, q21 and q22
In the next section in order to elaborate on the factors and subscales resulted from the factor analysis performed in this study in more details the descriptive statistics of the subscales extracted by factor analysis are reported.
Descriptive Statistics of the Subscales Extracted by the Factor Analysis
Table 5.6
Descriptive Statistics of the Subscales Extracted by Factor Analysis
Subscales Mean Median Std. Deviation Skewness Kurtosis Cronbach's Alpha
F1_1 2.6050 2.5000 .68274 .096 -.574 .627
F1_2 2.4400 2.5000 .48346 .382 -.367 .638
F1_3 2.6067 2.6667 .53472 -.134 .157 .617 F2_1 2.8700 2.8000 .49103 .086 -.670 .605
F2_2 2.7350 2.7500 .40797 -.570 -.265 .601
As can be seen, the values of the mean and median are close together for the sub scales. Also, the values of the skewness and kurtosis are within the range of defined. As it is observed, all subscales showed moderate reliability (0.6 and higher).
In the next section in order to evaluate the correlation among the subscales results of Pearson Product Moment Correlation Test of the subscales are reported.
Evaluation of Correlation between Sub Scales
Pearson Product Moment Correlation Test was performed to evaluate the correlation among the resulted sub-scales. Table 4.7 shows the results of Pearson product moment correlation test of the subscales:
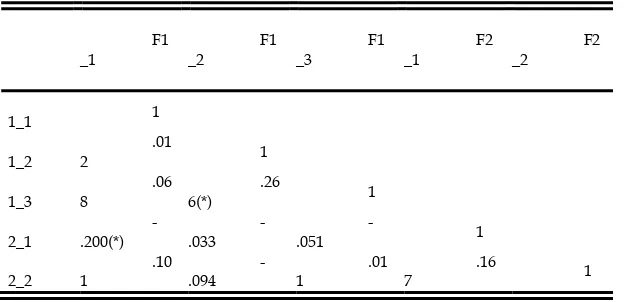
Table5.7
Pearson Correlation between Sub-Scales
F1 _1
F1 _2
F1 _3
F2 _1
F2 _2
1_1 1
1_2
.01
2 1
1_3 8 .06 6(*) .26 1
2_1
-.200(*)
-.033
-.051 1
2_2
.10 1
-.094
.01 1
.16
7 1
* Correlation is significant at the 0.05 level.
As it is observed in the table above, the correlation between two variables which is significant are flagged by (*) (at the 0.05 significance level). Positive values shows direct relationship of the variables and negative values shows inverse relationship between them. Correlations are designated as small (0.10–0.29), medium (0.30–0.49), and large (>0.50).
Based on the results:
1) There is significant and positive correlation between F1-2 and F1_1 (p <
2) There is significant and negative correlation between F1-1 and F2_1 (p < 0.05). So that the score of F2_1 is decreased by increasing the score of F1_1. This correlation is designated as small.
3) All other correlations are non significant (p>0.05).
Discussion
Based on the factor analysis which was performed and discussed in previous sections some items which did not have the required correlation with other items were deleted. Based on the factor analysis results two main factors called Factor 1 and Factor 2 were extracted and every one of these factors had some subscales namely, F1-1, F1-2, F1-3, F2-1, F2-2. Subscale F1-2 consisted of questions number 9 and 10, subscale F1-2 consisted of questions number 8 and 14, and subscale F1-3 consisted of questions number 13, 17, and 12. Subscale F2-1 consisted of questions number 18, 5, 3, 25, and 6, and subscale F2-2 consisted of questions number 16, 23, 21, and 22. In the section every one of these subscales will be discussed. And then the remaining items are discussed based on their groups.
Subscale F1-1, namely questions number 9 and 10 concerns the advantages of using computer in testing with regard to the students' pace and experience of fatigue when taking two different types of tests, PBT (paper-based test) and CBT (computer-based test). As mentioned by Brown (1992b), one of the advantages of using computers in language testing is that the use of computers allows students to work at their own pace and also he adds that students experience less frustration in computer-based tests than on paper-and-pencil tests. In this study, these two points were examined, but most of the subjects disagreed or strongly disagreed with these items, i.e. they did not believe that use of computers can allow the students to work on their space and they also did not believe that examinees experience less fatigue with CBT comparing to PBT. These two items were among the possible advantages of CBT, but the examinees did not agree. So, it is concluded that, this point cannot be considered as an advantage in the eyes of examinees.
Subscale F1-2 namely questions number 8 and 14 concerned with the effectiveness of computers in language testing regarding the accuracy of scoring and the possible greater standardization of test administration context that CBT may have compared to PBT. As mentioned by Educational Testing Service (1996) CBT has greater standardization of test administration conditions and in this study most of the examinees agreed with this item. It can show that since test takers believe that CBT has a greater standardization than PBT, they may prefer it over PBT as they think that it can be more trustable. Also, as mentioned by Brown (1992b), CBT is much more accurate at scoring selected-response tests at reporting scores than PBT. Similarly, in this study the participants believe that there is a difference between CBT and PBT in the accuracy of scoring and it can confirm the statements of Brown (1992b) about the accuracy of scoring. Most of the examinees disagreed with this item. Generally, this means that although some researchers believe that CBT has greater standardization of test administration condition compared to PBT, in this study examinees do not have such a viewpoint.
immediate availability of test results. Based on Brown (1992) one obvious advantage of computer-based testing is that it removes the need for fixed delivery dates and locations normally required by traditional paper-and-pencil-based testing. Group administrations are unnecessary, and users can take the test at a time (although not necessarily at a place) that they themselves choose. CBTs can be available at any time of the day or night, thus it can remove the limitations of test administration or even of group-administration. Another advantage is that results can be available immediately after the test, unlike paper-and-pencil-based tests which require time to be collected, marked and results issued. According to the results of this study most of the examinees agreed that CBT provides more administration dates options compared to PBT and also they believed that CBT provides more convenient times for test takers to take the test. So, this point can be regarded as an advantage for CBT compared to PBT tests. Therefore, results of this research can prove the previous beliefs mentioned by other researchers and this can be considered as one of strengths of CBT compared to PBT.
performances. May be it can be related to the dominance they can have on prints rather than computer screen. Also, most of the participants believed that reading from computer screen is more difficult than reading from the pages. Most of them believed that CBT version of test may prevent participants from reviewing the test. As many researchers believed that computer anxiety was the source of this issue and it can be concluded that CBT can cause this problem.
Subscale F2-2 namely, questions number 16, 23, 21, and 22 dealt with the limitations of CBT. For example, based on a research by Brown (199b) one of the limitations of CBT is that computer equipment may not always be available, or be reliable. Another is that the graphics capabilities of many computers (especially older ones) may be limited. Based on the results of this study most of the examinees agreed that in CBT the disability to use the mouse and keyboard may cause some problems. But most of them disagreed that CBT is limited in item type compared to PBT. Furthermore, almost most of them agreed that for CBT equipments may not always be available or reliable, especially in older systems so this result suggests that this point is one of the problems that may frighten most examinees to take CBT test instead of PBT. In addition, they mostly believed that in CBT the graphic capabilities of some computers specially the older ones may be limited so it may affect the examinee's performance. So, test-takers sometimes cannot trust CBT due to this problem.
After classifying the items into various factors and sub-scales the answers were investigated in order to determine whether the advantages of CBT are more than its disadvantages. The items were compared separately and in their subscales. In this study, the items were designed based on some advantages and disadvantages mentioned in the literature. Nevertheless, surprisingly some of the advantages and also disadvantages which were pointed in the previous studies were not confirmed in this study. However, generally despite all the technical and pedagogical advantages of CBT, number of disadvantages confirmed by the examinees in this study was more than the advantages.
Conclusion of the Study
This study aimed is to investigate the students' perceptions of the advantages and
disadvantages of CBT compared to PBT. A great deal of research has been done to
they were evaluated. Some interesting results were gained after analyzing the data. If the results are classified into two main groups of advantages and disadvantages of CBT, it can be concluded that number of disadvantages of CBT was a little more than the advantages. Among the most important disadvantages, computer anxiety, unreliability of computers equipments, disability to use the mouse and the keyboard, difficulty of reading from the screen, and problems which may occur to keep track of the items can be mentioned as the disadvantages which had been pointed by the test-takers. Computer familiarity was another important point which was mentioned which can have serious effect on examinees' performance; it means that not being familiar with computers may hinder the test-takers to take the test easily. The impact of not having ability to type with computers and possible resulting problems, reduced control of test-takers in CBT , and the fatigue resulted from taking CBT are disadvantages which were mentioned. Also, they believed that CBT is limited in item type and graphic capabilities especially in the older system. Danger of skipping some items in CBT and not allowing the test-taker to review the test are two other weak-points of CBT. However, CBT has its own benefits and advantages like providing more administration dates and time, removing the hand-writing problem, accuracy of scoring in CBT immediate availability of test results in CBT compared to PBT, and finally greater standardization of test administration compared to PBT are some of the advantages of CBT over PBT. All in all, what is noteworthy based on the result of the present study is that in the eyes of the examinees the disadvantages of CBT are more than its advantages.
Implications of the Study
Computer-adaptive testing shows to become a regular component of standardized foreign language assessment in the coming century, particularly for licensing and certification purposes. Many benefits may be gained through using these tests. Since computerized testing is still considered so new in the field of testing, we cannot
assume that performance in a computerized test will be the sameas in a
References
Alderson, J. C., Clapham, C., & Wall, D. (1995). Language test construction and
evaluation. New York: Cambridge University Press.
Alderson, C. (2000). Assessing reading. Cambridge, UK: Cambridge University Press.
Alderson, J. C. (2000). Technology in testing: the present and the future. System
28/4:593–603.
Alderson, C. (2001). Learning-centred assessment using information technology.
Symposium conducted at the 23rd Annual Language Testing Reserach Colloquium, St. Louis, MO.
Al-Gahtani, S. S., & King, M. (1999). Attitudes, satisfaction and usage: Factors
contributing to each in the acceptance of information technology. Behavior and
Information Technology,18(4), 277–297.
Bachman, L. (1990). Fundamental considerations in language testing. New York: Oxford
University Press.
Bachman, L.F., & Palmer, A. (1996). Language testing in practice. Oxford: Oxford
University Press.
Bachman, L. F. (2000). Modern language testing at the turn of the century: Assuring
that what we count counts. Language Testing, 17(1), 1-42.
Bennett, R. E. (1998). Reinventing assessment: speculations on the future of large-scale
educational testing. Princeton, NJ: Educational Testing Service, Policy
Information Center.
Bernhardt, E. B. (1996). If reading is reader-based, can there be a computer adaptive
reading test? Educational Testing Service, 7(34).
Bock, R. D., & Mislevy, R. J. (1982). Adaptive EAP estimation of ability in a
microcomputer environment. Applied Psychological Measurement, 6, 431-444.
Brown, J. D. (1992a). Technology and language education in the twenty-first century:
Media, message, and method. Language Laboratory, 29, 1-22.
Brown, J. D. (1992b). Using computers in language testing. Cross Currents, 19, 92-99.
Brown, H. (1994) Principles of language learning and teaching. Englewood Cliffs, NJ:
Prentice Hall Regents.
Brown, J. D. (1997). Computers in language testing: Present research and some
future directions. Language Learning and Technology, 1(1), 44–59.
Burke, M. J., Normand, J., & Raju, N. S. (1987). Examinee attitudes toward
computer-administered ability testing. Computers in Human Behavior, 3(2), 95–107.
Canale, M. (1986). The promise and threat of computerized adaptive assessment of
reading comprehension. Technology and language testing, pp. 30–45.
Washington, DC: TESOL Publications.
Carslon, R. (1994). Computer-adaptive testing: A shift in the evaluation paradigm.
Journal of Educational Technology Systems, 22, 213-224.
Chalhoub-Deville, B. (2001). Language testing and technology: Past and future.
Language Learning and Technology, 5(2), 95–98.
Chapelle, C. (2001). Computer applications in second language acquisition: Foundations for
teaching, testing and research. Cambridge: Cambridge University Press.
Chua, S. L., Chua, D. T., Chen A. F., & Wong, L. (1999). Computer anxiety and its
Deville, M. (1998). Issues in computer-adaptive testing of second language reading
proficiency. Center for Advanced Research on Language Acquisition of the
University of Minnesota, p. 18.
Deville, M., & Deville, C. (1999). Computer adaptive testing in second language
contexts. Annual Review of Applied Linguistics,19, 273–299.
Dillon, A. (1992). Reading from paper versus screens: A critical review of the
empirical literature. Ergonomics, 35(10),1297-1326.
Dimock, P. H., & Cormier, P. (1991). The effects of format differences and computer experience on performance and anxiety on a computer-administered test.
Measurement and Evaluation in Counseling and Development, 24(3), 119–126.
Dooey, P. (2008). Problems of transition to a new era. Language testing and technology.
Department of Languages and Intercultural.
Dunkel, A. (1991). Research on the effectiveness of computer-assisted instruction
and computer-assisted language learning. In Dunkel, P. (Ed.),
Computer-assisted Language Learning and Testing. (pp. 5-36). New York: Newbury House.
Durndell, A., & Lightbody, P. (1993). Gender and computing: Change over time?
Computers in Education, 21, 331-336.
Eignor, D., Taylor, C., Kirsch, I., & Jamieson, J. (1988). Development of a scale for
assessing the level of computer familiarity of TOEFL examinees (TOEFL Research
Report 60).Princeton, NJ: Educational Testing Service.
Eysenck, M. W. (1988). Anxiety and attention. Anxiety Research, 1(1), 9–15.
ETS. (1998). Computer-Based TOEFL Score User Guide. Educational Princeton, NJ:
Educational Testing Service.
Educational Testing Service, (1999). Description of the computer-based TOEFL test.
Princeton, NJ: Educational Testing Service.
Fulcher, G. (1999). Computerizing an English language placement test. ELT Journal,
53(4), 289–299.
Fulcher, G. (2001). Resources in language testing page. Retrieved from
http://www.surrey.ac.uk/ELI/ltr.html.
Gallagher, A., Bridgeman, B., & Cahalan, C. (2002). The Effect of computer-based
tests on racial/ethnic and gender groups. Journal of Educational Measurement,
39, 33–ı47.
Gallagher, M., & Millar, R. (1996). A survey of adolescent worry in Northern Ireland.
Pastoral Care in Education, 14(2), 26–32.
Gos, M. W. (1996). Computer anxiety and computer experience: a new look at an old
relationship. The Clearing House, 69(5), 271–276.
Gould, J. D., Alfaro, L., Barnes, V., Finn, R., Grischkowsky, N., & Minuto, A. (1987). Reading is slower from CRT display than from paper: Attempts to isolate a
single-variable explanation. Human Factors, 29, 269-299.
Green, B., Bock, R., Humphreys, L., Linn, R., & Reckase, M. (1984).Technical
guidelines for assessing computerized adaptive tests. Journal of Educational
Measurement, 21, 347-360.
Greaud, V., & Green, B. F. (1986). Equivalence of conventional and computer
presentation of speed tests. Applied Psychological Measurement, 10, 23-34.
validating CATs. Computer-assisted language learning and testing: Research issues
and practice, pp. 209-222. New York: Newbury House.
Honaker, L. M. (1988). The equivalency of computerized and conventional MMPI
administration: a critical review. Clinical Psychology Review, 8(6), 561–577.
Jamieson, J., Jones, S., Kirsch, I., Mosenthal, P., & Taylor, C. (2000). TOEFL 2000
framework: A working paper. TOEFL Monograph Series 16. Princeton, NJ:
Educational Testing Service.
Jamieson, J., & Chapelle, C. A. (2005). Longman English Assessment. New York:
Pearson Longman.
Johnston, C. (1996). Computerized testing on a large network: Issues for today and
tomorrow. In M. Chaloub-Deville (Ed.), Issues in computer-adaptive testing of
second language reading proficiency. (pp. 7-10).
Karl, M., Graef, F., Eitner, S., Beck, N., Wichmann, M., & Holst, S. (2007).
Comparison between computer-aided testing and traditional multiple choice:
an equivalence. European Journal of Dental Education, 11(1), 38-41.
Kay, R. H. (1993). An exploration of theoretical and practical foundations for assessing attitudes towards computers: The computer attitude measure
(CAM). Computers in Human Behavior, 9, 371–386.
Kim, S., & Hocevar, D. (2003). Racial differences in eighth-grade mathematics:
Achievement and opportunity to learn. Clearing House, 71, 175–178.
Kingsbury, G., & Houser, R. (1993). Assessing the utility of item response models:
Computer adaptive testing. Educational Measurement: Issues and Practice, 12,
21-27.
Kirsch, I., Jamieson, J., Taylor, C., & Eignor, D. (1998). Computer familiarity among
TOEFL examinees (TOEFL Research Report 98-6). Princeton, NJ: Educational
Testing Service.
Larson, J. W., & Madsen, H. (1985). Computerized adaptive language testing:
Moving beyond computer-assisted testing. CALICO Journal, 2, 32-36, 43.
Lee, J. (1986). The effects of past computer experience on computerized aptitude test
performance. Educational and Psychological Measurement, 46, 727–733.
Levine, T., & Schmidt, D. (1997). Commitment to learning: effects of computer
experience, confidence and attitudes. Journal of Educational Computing
Research,14(1), 83–105.
Levine, T., & Schmidt, D. (1998). Computer use, confidence, attitudes, and
knowledge: a causal analysis. Computers in Human Behavior, 14(1), 125–146.
Lord, F. M. (1970). Some test theory for tailored testing. In W. H. Holtzman (Ed.),
Computer-assisted instruction, testing, and guidance. (pp. 139-183). New York:
Harper & Row.
Luecht, A., Hadadi, D., Swanson, B., & S. M. (1998). A comparative study of a comprehensive basic sciences test using paper-and-pencil and computerized
formats (testing the test). Academic Medicine, 73(10), S51–S53.
Lunz, M. E., & Bergstrom, B. A. (1995). Equating computerized certification
examinations: The Board of Registry series of studies. Paper presented at the
Madsen, H. S. (1991). Computer-adaptive test of listening and reading
comprehension: The Brigham Young University approach. In P. Dunkel (Ed.),
Computer-assisted language learning and testing: Research issues and practice. (pp.
237-257). New York: Newbury House.
Mazzo, J., Druesne, B., Raffeld, P., Checkett, K., & Muhlstein, A. (1991). Comparibility
of computer and paper-and-pencil scores for two CLEP general examinations (College Board Report No, 91-5). Princton: Eudacational Testin Service.
McDonald, A. S. (2001). The prevalence and effects of test anxiety in school children.
Educational Psychology, 21(1), 89–101.
McDonald, A. S.(2002). The impact of individual differences on the equivalence of
computer-based and paper-and-pencil educational assessments. Computers &
Education, 39(3), 299-312.
McNamara, T. (1996). Measuring second language performance. London: Longman.
McNamara, T. (1997). ‘Interaction’ in second language performance assessment.
Whose performance? Applied Linguistics, 18, 446–466.
Mead A.D., & Drasgow, F. (1993). Equivalence of computerized and
paper-and-pencil cognitive ability tests: A meta-analysis. Psychological Bulletin, 114(3),
449–458.
Myers, M. J. (1999). Juszcyk’s weighting scheme used for written translation.
Fachsprachen und Übersetzungstheorie, VAKKI-Symposium XIX, 204–212.
Neuman, G., & Baydoun, R. (1998). Computerization of paper-and-pencil tests:
when are they equivalent? Applied Psychological Measurement, 22(1), 71–83.
Oltman, P. (1994). The effect of complexity of mouse manipulation on performance in
computerized testing (ETS-RR-94-22). Princeton, NJ: Educational Testing
Service.
O'Neill, K., Folk, V., & Li, M. Y. (1993). Report on the pretest calibration study for the
computer-based academic skills assessments of The Praxis Series: Professional
assessments for beginning teachers. Princeton, NJ: Educational Testing Service.
O'Neill, K., & Powers, D. (1993). Inexperienced and anxious computer users: coping
with a computer-administered test of academic skills. Educational Assessment,
1, 153–173.
Pelgrum, W., Jenssen Reinen, I., & Plomp, T. (1993). Editors, Schools, teachers, students
and computers: a cross-national perspective (IEA-Comped Study Stage 2). The
Netherlands: Center for Applied Educational Research, University of Twente, Enschede.
Pino-Silva, J. (2008). Student perception of computerized tests. ELT Journal, 62(2).
Powers, D. E. (1999). Test anxiety and test performance: Comparing paper-based and
computer-adaptive versions of the GRE general test (RR-99-15). Princeton, NJ:
Educational Testing Service.
Reinking, D., & Schreiner, R. (1985). The effects of computer-mediated text on
measures of reading comprehension and reading behavior. Reading Research
Quarterly, 20(5), 536–552.
Rosen, L. D., Sears D. C., & Weil, M. M. (1987). Computerphobia. Behaviour Research
Methods, Instruments and Computers, 19(1), 167–179.
Russell, M. (1999). Testing on computers: A follow-up study comparing performance
Russell, M., & Haney, W. (1997). Testing writing on computers: An experiment comparing student performance on tests conducted via computer and via
paper-and-pencil. Education Policy Analysis Archives.
Russell, M. (1999). Testing on computers: A follow-up study comparing performance
on computer and on paper. Education Policy Analysis Archives.
Sawaki, Y. (2001). Comparability of conventional and computerized tests of reading
in a second language. Language Learning & Technology, 5(2), 38-59.
Segall, D. O, & Moreno K. E. (1999). Development of the computerized adaptive testing version of the Armed Services Vocational Aptitude Battery. In F.
Drasgow, & J. B. Olson-Buchanan (Eds.), Innovations in computerized
assessment. London: Lawrence Erlbaum Associates.
Shermis, M. D., & Lombard, D. (1998). Effects of computer-based test
administrations on test anxiety and performance. Computers in Human
Behavior, 14(1), 111–123.
Silye, M. F., & Wiwczaroski, T. B. (1999). A critical review of selected computer assisted
language testing instruments. University of Debrecen, Centre of Agricultural
Sciences, Faculty of Agricultural Sciences, Centre of Technical Languages Instruction.
Singleton, C. (1997). Computer-based assessment of reading. In J. R. Beech, & C. H.
Singleton (Eds.), Psychological assessment of reading. London: Routledge.
Singleton, C. H., Horne, J., & Vincent, D. (1995). Implementation of a computer-based
system for diagnostic assessment of reading. Hull: Dyslexia Computer Resource
Centre, University of Hull.
Singleton, C., Horne, J., & Thomas, K. (1999). Computerized baseline assessment of
literacy. Journal of Research in Reading, 22(1), 67–80.
Smith, B., Caputi, P., Crittenden, N., Jayasuriya, R., & Rawstorne, P. (1999). A review
of the construct of computer experience. Computers in Human Behavior, 15(2),
227–242.
Szajna, B. (1994). An investigation of the predictive validity of computer anxiety and
computer aptitude. Educational and Psychological Measurement, 54(4), 926–934.
Steinberg, L., Thissen, D., & Wainer, H. (1990). Validity. In H. Wainer, N. J. Dorans, R. Flaugher, B. F. Green, R. J. Mislevy, L. Steinberg, & D. Thissen (Eds.),
Computerized adaptive testing: A primer. Hillsdale, NJ: Lawrence Erlbaum
Associates.
Stevenson, J., & Gross, S. (1991). Use of a computerized adaptive testing model for
ESOL/bilingual entry/exit decision making. In P. Dunkel (Ed.),
Computer-assisted language learning and testing. (pp. 223-235). New York: Newbury
House.
Stricker, L. J, Wilder, G. Z, & Rock, D. A. (2003). Attitudes about the computer-based
test of English as a Foreign Language. Computers in Human Behavior, 20(1),
37-54. Princeton, NJ 08541, USA: Educational Testing Service.
Szajna, B. (1994). An investigation of the predictive validity of computer anxiety and
computer aptitude. Educational and Psychological Measurement, 51(4), 926–934.
Taylor, C., Jamieson, J., Eignor, D., & Kirsch, I. (1998). The relationship between
Taylor, C., Kirsch, I., Eignor, D., & Jamieson, J. (1999). Examining the relationship between computer familiarity and performance on computer-based language
tasks. Language Learning, 49(2), 219–274.
Todman, J., & Lawrenson, H. (1992). Computer anxiety in primary schoolchildren
and university students. British Educational Research, 18(1), 63–72.
Tseng, H. M., Tiplady, B., Macleod, H. A., & Wright, P. (1998). Computer anxiety: a comparison of pen-based personal digital assistants, conventional computer
and paper assessment of mood and performance. British Journal of Psychology,
89(4), 599–610.
Vispoel, W. P, Rocklin, T. R., & Wang, T. (1994). Individual differences and test administration procedures: A comparison of fixed-item,
computerized-adaptive, and self-adapted testing. Applied Measurement in Education, 7(1), 53–
79.
Vogel, L. A. (1994). Explaining performance on P&P versus computer mode of administration for the verbal section of the Graduate Record Exam.
Educational Computing Research,11(4), 369–383.
Wallace, P., & Clariana, R. B. (2005). Gender Differences in Computer-Administered
versus Paper-Based Tests. International Journal of Instructional Media, 32.
Weil, M. M., & Rosen, L. D. (1995). A study of technological sophistication and
technophobia in university students from 23 countries. Computers in Human
Behavior, 11(1), 95–133.
Weiss, D. (1996). A perspective on computerized second language testing. In M.
Chaloub-Deville (Ed.), Issues in computer-adaptive testing of second language
reading proficiency. Bloomington, MN: Symposium conducted at the Center for
Advanced Research on Language Acquisition of the University of Minnesota. Wise, S. L, Roos, L., Plake, & Nebelsick-Gullett, L. J. (1994). The relationship between
examinee anxiety and preference for self-adapted testing. Applied Measurement
in Education, 7(1), 81–91.
Zandvliet, D., & Farragher, P. (1997). A comparison of computer-administered and
written tests. Journal of Research on Computing in Education, 29(4), 423–438.
Appendix
A questionnaire on examinees’ perception of computer-based test of TOEFL Age... Male Female
Please check the box that best expresses your view.
(Note: in this questionnaire CBT stands for computer-based test and PBT for Paper-based test).
Your cooperation is highly appreciated.
No Question
Stron
gly
agree Agree Disagree Stron
gly
disagre
e
positively.
2 Not having sophisticated ability to type with computer can affect the test performance in CBT (computer-based test) version in a negative way.
3 Computer anxiety can affect examinees' performance negatively.
4 In spite of occurrence of unexpected or unknown events I select CBT (computer-based test).
5 CBT may offer reduced control of the test taker over the test compared to PBT (paper-based test) (not allowing review or skipping questions).
6 The testing condition for CBT can be a source of anxiety.
7 There is a relationship between the experience of working with computer and test anxiety in CBT.
8 There is NOT any difference between PBT (paper-based test) and CBT regarding the accuracy of scoring.
9 Examinees experience less fatigue with CBT comparing to PBT. 10 Use of computers allows the examinees to work on their own pace.
11 Because CBT presents the questions one by one at a time, it can make the test easier to take.
12 CBTs provide more administration dates options compared to PBT.
Continued at the back of the page
No Question
Stron
gly
agree Agree Disagree Stron
gly
disagre
e
13 There is Not any difference between CBT and PBT regarding the immediate availability of test results.
14 CBT has greater standardization of test administration context compared to PBT.
15 Examinees' need for using type writing in CBT reduces the handwriting problems.
16 In CBT the disability to use the mouse and keyboard may cause some problems.
17 CBT provides more convenient times for test takers to take the test.
18 Reading from computer screen is more difficult than reading from pages.
19 Marking the correct choice on the answer sheet in PBT and pressing a button in CBT can have different results in performance.
21 CBT is limited in item type compared to PBT.
22 For CBT equipments may not always be available or reliable, especially in older systems.
23 In CBT the graphic capabilities of some computers specially the older ones may be limited so it may affect the examinee's performance.
24 Because in CBT failure may occur during the testing procedures, participants prefer NOT to choose it.
25 CBT version of test may prevent participants from reviewing the test.