R E S E A R C H
Open Access
A reduction in CD90 (THY-1) expression
results in increased differentiation of
mesenchymal stromal cells
Daniela A. Moraes
1,6, Tatiana T. Sibov
3, Lorena F. Pavon
3, Paula Q. Alvim
1, Raphael S. Bonadio
1,
Jaqueline R. Da Silva
1, Aline Pic-Taylor
1, Orlando A. Toledo
2, Luciana C. Marti
4, Ricardo B. Azevedo
1and Daniela M. Oliveira
1,5*Abstract
Background:Mesenchymal stromal cells (MSCs) are multipotent progenitor cells used in several cell therapies. MSCs are characterized by the expression of CD73, CD90, and CD105 cell markers, and the absence of CD34, CD45, CD11a, CD19, and HLA-DR cell markers. CD90 is a glycoprotein present in the MSC membranes and also in adult cells and cancer stem cells. The role of CD90 in MSCs remains unknown. Here, we sought to analyse the role that CD90 plays in the characteristic properties of in vitro expanded human MSCs.
Methods:We investigated the function of CD90 with regard to morphology, proliferation rate, suppression of T-cell proliferation, and osteogenic/adipogenic differentiation of MSCs by reducing the expression of this marker using CD90-target small hairpin RNA lentiviral vectors.
Results:The present study shows that a reduction in CD90 expression enhances the osteogenic and adipogenic differentiation of MSCs in vitro and, unexpectedly, causes a decrease in CD44 and CD166 expression.
Conclusion:Our study suggests that CD90 controls the differentiation of MSCs by acting as an obstacle in the pathway of differentiation commitment. This may be overcome in the presence of the correct differentiation stimuli, supporting the idea that CD90 level manipulation may lead to more efficient differentiation rates in vitro.
Keywords:Mesenchymal stem cells, Mesenchymal stromal cells, CD90, Thy-1, Fibroblast, Differentiation
Background
Mesenchymal stromal cells (MSCs) are multipotent pro-genitor cells identified by their plastic-adherence when maintained under standard culture conditions, self-renewability, and differentiation into several mesodermal lineages [1–3]. MSCs are classically able to differentiate into osteoblasts, adipocytes, and chondroblasts in vitro [4]. Since their initial description as colony-forming cell units present in the bone marrow [5], MSCs have been isolated from many tissue sources such as placenta [6], dental pulp [7], tendons [8], scalp tissue [9], adipose tissue [10], umbilical cord blood [11], umbilical cord perivascular
cells [12], umbilical cord Wharton’s jelly [13], synovial membrane [2], amniotic fluid [14], and breast milk [15]. Due to their relatively easy isolation, multi-differentiation potential, low antigenicity, and good proliferation/expan-sion in cell culture, MSCs are considered ideal candidates for cell-based regenerative therapies [16]. Based on the minimal criteria established by the International Society for Cellular Therapy (ISCT), human MSCs are identified by a combination of high CD105, CD73, and CD90 ex-pression, and very low/no CD34, CD45, CD11a, CD19, and HLA-DR expression [4, 17]. Currently, there is no unique cell marker capable of solely isolating and defining MSCs. The observation that only a subpopulation of plastic-adherence isolated MSCs show multipotency [18] has led to a search for an ideal and definitive single MSC marker that would not only be specific to MSC, but would allow direct correlation with stemness [19].
* Correspondence:dmoliveira@unb.br
1
Departamento de Genética e Morfologia, Universidade de Brasília, Brasília, DF, Brazil
5IB-Departamento de Genética e Morfologia, Universidade de Brasília - UNB, Campus Universitário Darcy Ribeiro, Asa Norte, Brasília CEP 70910-970, Brazil Full list of author information is available at the end of the article
Although CD90 and STRO-1 are broadly used to iden-tify MSCs, neither of them is specific to MSCs [20–22]. STRO-1 is only expressed in a low percentage of MSCs. Some authors also discuss the absence of this marker in MSCs from all tissue sources [12, 19, 23], and it remains unclear, in the current literature, whether STRO-1 expres-sion correlates to MSC stemness. On the other hand, CD90 is highly expressed in all MSCs, irrespective of the source, and it is a good marker for CFU-F enrichment [24]. High CD90 expression has also been related to the undifferentiated status of MSCs, since a decrease in CD90 level can be correlated with the temporal lineage commit-ment in vitro [25].
CD90, or Thy-1, is a 25–37 KDa glycosylphosphatidyli-nositol (GPI)-anchored glycoprotein [26]. CD90 was first detected in mice T cells [27] and later found to be expressed in thymocytes, T cells, neurons, hematopoietic stem cells, cancer stem cells, endothelial cells, and fibro-blasts [28]. Although it has been shown that CD90 is con-served among different species, its function seems to vary according to cell type [29]. CD90 has been reported to participate in T-cell activation [30], neuritis outgrowth modulation [31], vesicular release of neurotransmitter at the synapse [32], astrocyte adhesion [33], apoptosis in car-cinoma cells [34], tumour suppression [35–37], wound healing [38], fibrosis [39, 40], and fibrogenesis [41]. Fur-thermore, it regulates fibroblast focal adhesion, cytoskel-eton organization, and cell migration [42]. In mouse models, activation of CD90 expression can be observed in inflammation, wound healing, and tumour development [43]. Recent studies suggest that CD90 has a role in onco-genesis, and it has also been proposed as a marker for can-cer stem cells (CSCs) in various malignancies [44–51].
Despite an increasing number of studies suggesting CD90 participation in MSC self-renewal and differenti-ation [52], its function in MSC biology remains un-known. The unveiling of the function of CD90 in MSCs may further facilitate the in vitro manipulation of MSCs and consequently MSC-based therapies for regenerative medicine. In this study, we investigated the function of CD90 in MSC biology. To achieve this objective, we ana-lysed the effect of CD90 knockdown on proliferation, morphology, and differentiation of human MSCs.
Methods
Subjects and cell culture
The cells were obtained with the approval of the Ethics Committee of the Faculty of Health Sciences at the Uni-versity of Brasilia (Brazil) and UniUni-versity of São Paulo (Brazil). MSCs were isolated from healthy human tissues and cultured as previously reported. In the present study, we obtained MSCs from three different tissue sources: dental pulp [7] (three donors), adipose tissue [10] (two donors), and amniotic fluid [14] (two donors).
After isolation, cells were cryopreserved and stored in li-quid nitrogen. For the assays we used cells that were stored for no longer than 1 year. Briefly, cells were thawed and expanded in a regular medium of Dulbecco’s modified Eagle’s medium (DMEM-LG; Sigma Chemical), supplemented with 10 % fetal bovine serum (FBS; Gibco), 100 units/ml penicillin, 100 mg/ml streptomycin (Gibco), and 10 μl/mlL-glutamine (Gibco) at 37 °C, 5 % CO2[1]. The medium was changed every 48 h.
Lentiviral transduction for CD90 depletion
For lentiviral transduction, MSC isolates (a total of seven samples at cell passage 2) were cultured in a 75-cm2 flask in medium containing 10 % FBS (Gibco), 100 units/ml penicillin, 100 mg/ml streptomycin (Gibco), 10 μl/mlL-glutamin (Gibco) at 37 °C, 5 % CO2. When
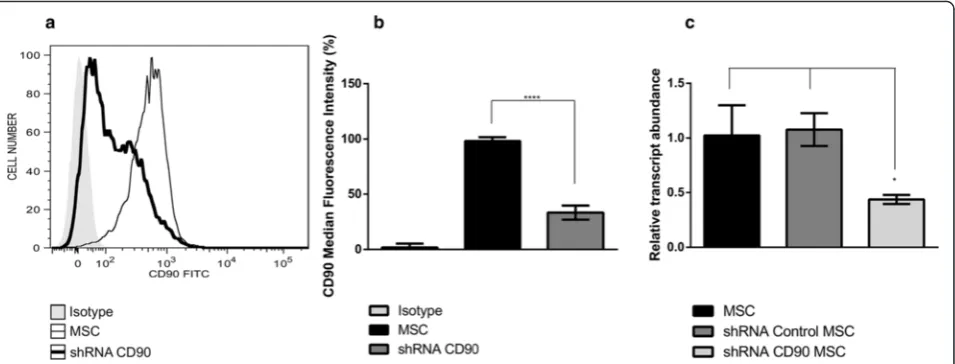
cells reached a confluence of 60 %, transduction was performed in the presence of 8μg/ml Polybrene (Sigma-Aldrich) according to the manufacturer’s instructions (Santa Cruz Biotechnology). CD90 small hairpin (sh)RNA-expressing lentivirus (shRNA CD90) or non-targeting shRNA-expressing scramble sequences of RNA (shRNA control) were then added to the cells at a multi-plicity of infection (MOI) of 10. The medium was chan-ged after 24 h. Three days after transduction, stable clones of MSCs expressing CD90-shRNA (shRNA CD90 MSC) and control shRNA (shRNA control MSC) were selected using 5 μg/ml Puromycin (Sigma-Aldrich) for 10 days. The medium was changed every 48 h.
Real-time quantitative PCR
Magnetic separation of the MSCs for negative selection of CD90
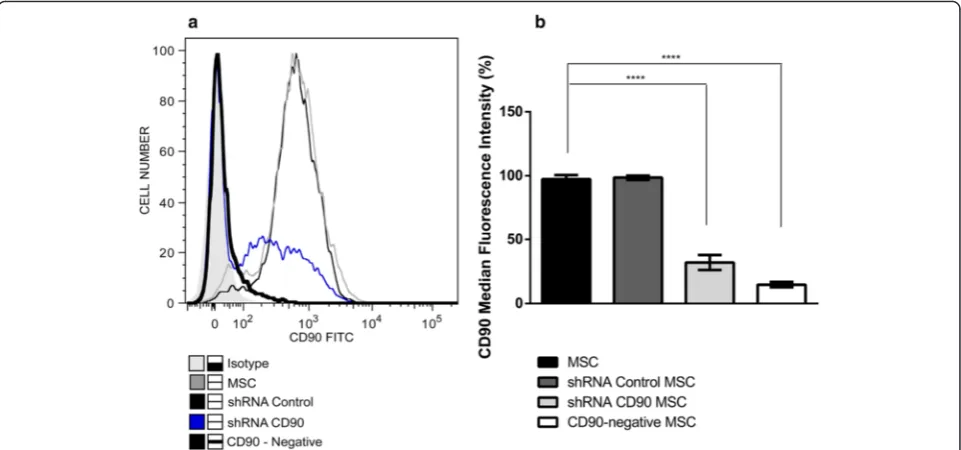
Cell purification was performed according to the manu-facturer’s instructions (MiltenyiBiotec). To isolate the CD90-negative MSC population, shRNA CD90 MSCs were incubated with anti-CD90-coupled magnetic beads (MiltenyiBiotec, Germany) for 15 min at 4 °C, rinsed, and placed in a column. The negative fraction (CD90-negative MSCs) was collected, and cell purity checked by flow cy-tometry (FACSVERSE-BD Biosciences, San Jose, CA, USA) and FlowJo analysis software (TreeStar, Ashland, OR, USA).
Flow-cytometric analysis
Commercially available monoclonal antibodies were used for MSC immunophenotyping following the manufac-turer’s instructions. Subcultures at passage 3 were used for the flow-cytometric analysis. MSCs were lifted using Try-pLE (Invitrogen, Carlsbad, CA, USA) and centrifuged for 5 min at 1000 rpm. The supernatant was discarded by as-piration and the cells incubated for 30 min in a dark envir-onment in a flow cytometry buffer (phosphate-buffered saline (PBS), 2 % FBS) containing monoclonal antibodies against cell surface molecules and their respective isotype controls. The following antibodies were used: CD14-FITC; CD29-PE; CD31-PE; CD34-PE; CD44-PE; CD73-PE; CD90-APC; CD90-FITC; CD106-FITC; CD166-PE and CD166-PerPC-Cy5.5; CD45-PerCP-Cy5.5; HLA-DR-PerCP-Cy5.5 (Biosciences); and CD105-PE (clone 8E11; Chemicon, Temecula, CA, USA). Mouse IgG1-FITC, IgG1-PE, IgG1 PerCP-Cy5.5, IgG1-APC (Biosciences), and IgG2A-FITC (AbDSerotec, UK) were used as isotype con-trols. Cells were analysed using a fluorescence-activated cell sorter (CyFlowSpace-Partec, Germany; FACSVERSE-BD or FACSARIA-FACSVERSE-BD, both from FACSVERSE-BD Biosciences) and the data analysed using FlowJo analysis software (TreeStar).
MSC morphology analysis
Transduced and non-transduced MSCs at passage 3 were placed, in triplicate, in 24-well culture plates (5 × 10⁴cells/ well). After cell concentration reached a confluence of 70 %, media were removed and the cells were washed with PBS and fixed with a 4 % paraformaldehyde solution for 15 min at room temperature. Cells were then washed with PBS, stained with Kit Instant Prov (NewProv, Brazil) and rewashed with PBS. Cell morphology (shape and size) was then analysed under an Axiovert inverted microscope (Zeiss, Germany) and EVOS FL cell imaging system (Life Technologies, Eugene, OR, USA).
Growth assay
For the assessment of growth characteristics, MSCs (1 × 10⁵cells, at passage 3 after transduction, passage 5 after isolation) were seeded in 75-cm2 culture flasks in MSC
culture medium. Every 48 h, three replicate flasks were trypsinised and viable cells counted with a haemocytom-eter. MSC viability was evaluated by Trypan blue exclu-sion assay.
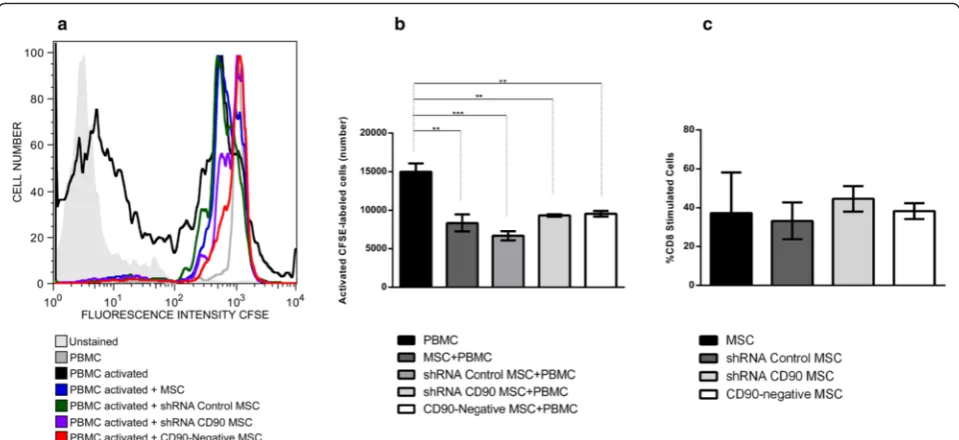
Lymphocyte proliferation assay
Peripheral blood mononuclear cells were isolated from peripheral blood and separated using the standard method with Ficoll-Paque PLUS (Amersham Biosci-ences, Uppsala, Sweden). The mononuclear cells were washed twice with PBS buffer. Cells were then counted in an automated cell counter (2.0 Scepter, Millipore), re-suspended to a final concentration of 104 cells/ml and labelled with CFSE (Sigma-Aldrich). The CFSE was ad-justed to a final concentration of 5 μM and incubated for 10 min at 37 °C. The reaction was stopped by adding RPMI with 10 % FBS. In immediate succession, 2 × 10⁴ lymphocytes were cultured with or without 5 × 10⁴ MSCs previously adhered to the bottom of a 24-well plate in a total volume of 1 ml per well of RPMI with 10 % FBS medium. To evaluate the lymphocyte prolifer-ation rate in the presence of MSCs, cell suspensions were activated with a phytohaemagglutinin (PHA; Sigma, USA) stimulus at a final concentration of 1 μg/ ml in cell culture and maintained at 37 °C with 5 % CO2
for 5 days for subsequent assessment by flow cytometry (CyFlowSpace-Partec, Germany) and the FlowJo analysis software (TreeStar) [53]. Suspension cells were stained with CD8-PE antibody (Biosciences), and lymphocyte proliferation was measured according to CFSE staining on gated population.
In vitro differentiation assays
To evaluate the differentiation potential of MSCs, cells were subjected to in vitro osteogenic and adipogenic dif-ferentiation according to the established protocols [1]. Transduced and non-transduced MSCs at passage 4 (passage 2 after transduction) were seeded in 24-well plates at a density of 5 × 10⁴ cells/well. When a conflu-ence of 80 % was achieved, the regular medium was re-placed with an induction medium, which was refreshed every 72 h for 21 days. Cells cultured in regular medium were used as controls.
Osteogenic differentiation
staining. Mineralized matrix formation after osteogenic dif-ferentiation was detected as previously described [1]. Sam-ples were fixed with 4 % paraformaldehyde for 15 min, rinsed in PBS, and dyed for 20 min with 40 mM Alizarin Red solution (Sigma-Aldrich) at pH 4.2 and room temperature. Cells were washed five times with distilled water, followed by an immediate 15-min rinse with PBS to reduce non-specific dying. The resulting samples were analysed and photographed under an Axiovert inverted microscope (Zeiss, Germany). To determine alizarin red concentration, the samples were exposed to 10 mM so-dium phosphate containing 10 % cetylpyridinium chloride (Sigma-Aldrich) at pH of 7.0 for 15 min at room temperature. The Alizarin Red concentration was deter-mined by measuring absorption at 562 nm using a spectro-photometer (SpectraMax M2, Molecular Devices, USA). Results were expressed as a percentage of the respective controls, which were normalized to 100 % [54]. Lysate al-kaline phosphatase activity was measured spectrophoto-metrically using a Sigmafast p-nitrophenyl phosphate kit (Sigma-Aldrich). For ALP assays, cells were washed with PBS and lysed in 0.05 % Triton X-100 through three cycles of freezing and thawing. A lysate aliquot was incubated with p-nitrophenyl phosphate substrate (p-NF) at 37 °C for 30 min. The reactions were stopped by adding 5 μl 1 N NaOH and absorbance measured at 405 nm using a spec-trophotometer (SpectraMax M2, Molecular Devices) [55]. A pattern curve of p-NF was established in order to deter-mine the enzymatic activity. Samples were normalized and total protein quantification determined by the Lowry method [56].
The quantitative levels of calcium in cell samples were determined for both osteogenic differentiation-induced and non-induced cells. Supernatant calcium concentration was determined by colorimetry using the ortho-cresolphthalein complexone (o-CPC) method [57]. Cells were trypsinised, resuspended in PBS, and then reacted with a calcium re-agent containing 0.69 mol/l ethanolamine buffer, 0.2 % so-dium azide, 0.338 mmol/l 0-cresolphthalein complexone, and 78 mmol/l 8-hydroxynquinoline-13. Cell reactions were read by a spectrophotometer (Advia2400, Siemens).
Adipogenic differentiation
For adipogenic induction, cells were seeded in 24-well plates at a density of 5 × 10⁴ cells/cm2. When the cells reached confluence, they were treated with an adipo-genic induction medium containing 5 mg/ml insulin, 5 mmol indomethacin, 1 mmol dexamethasone, and 0.5 mmol/l isobutyl-1-methylxanthine (all from Sigma-Aldrich) in regular medium. Adipocyte formation was monitored by the appearance of lipid droplets under a microscope. After the induction period, cytochemical analysis of the differentiated and control cells was per-formed by conventional optical microscopy. The cells
were fixed in 4 % formaldehyde for 15 min, rinsed in PBS, and dyed for 30 min with 0.5 % Oil Red O (Sigma-Aldrich) in ethanol. Cells were subsequently washed five times with distilled water to remove any excess dye. Quantification of lipid accumulation was achieved by extracting Oil Red-O from stained cells with isopropanol and measuring the OD of the extract at 510 nm using a Spectramax M2 spectrophotometer (Molecular Devices) [58].
Statistical analysis
Statistical analysis was performed using the software GraphPad™ (San Diego, CA, USA). Quantitative data were expressed as mean ± standard deviations (SD) and statistical analyses of variance (ANOVA). Multiple com-parisons were performed with Tukey's HSD test when appropriate. Findings with p< 0.05 were considered sta-tistically significant.
Results
MSC isolates and purity
MSCs were obtained from dental pulp (DPSC; three do-nors), amniotic fluid (AF-MSC; two dodo-nors), and adipose tissue (ADSC; two donors). The success rate of isolating MSCs from all tissues was 100 %. Cells from all three sources (a total of seven isolates) contained a high num-ber of adherent MSC-like cells which proliferated rapidly in number. Analysis of positive and negative characteris-tics for human MSC surface antigens by flow cytometry for cultured MSCs showed a high purity (≥97 %) of the cells (Additional file 1: Table S1).
Analysis of the CD90 downregulated expression effect in MSCs
Since CD90 expression was not completely ablated in shRNA CD90 MSCs, we submitted shRNA CD90 MSC samples to magnetic-activated cell sorting and collected the post-separation CD90-negative fraction (subse-quently termed CD90-negative MSCs). CD90-negative MSCs were characterized by flow cytometry to verify purification success. Flow cytometry analysis confirmed that the CD90-negative MSCs samples expressed lower levels of CD90 than shRNA CD90 MSCs (Fig. 2).
Morphology and growth kinetics
In our cellular morphology analysis of the cells used in this study, we observed no differences in the shape and size of MSCs, shRNA control MSCs, shRNA CD90 MSCs, CD90-negative MSCs, and non-transduced MSCs (Fig. 3a). The shRNA CD90 MSCs and CD90-negative MSCs derived from all three sources displayed characteris-tic MSC/fibroblast-like morphology. We also observed that shRNA CD90 MSCs and CD90-negative MSCs maintained their capacity to form colonies for up to 10 passages, sug-gesting that CD90 is not involved in the maintenance of MSC cell morphology and colony-forming ability.
In order to assess the role of CD90 in MSC proliferation rate, cell growth curves for MSCs, shRNA control MSCs, shRNA CD90 MSCs, CD90-negative MSCs, and non-transduced MSCs at the same corresponding cell passage (cell passage 5) were conducted in parallel (Fig. 3b). Ana-lysis of the area under the curve showed no significant dif-ference in proliferation rates. The trypan blue exclusion assay also showed no difference in cell viability.
Lymphocyte proliferation analysis
We also investigated whether CD90 expression in MSCs would affect the inhibitory effect of MSCs on non-specific mitogen-stimulated lymphocytes in an in vitro assay. The assay showed that shRNA CD90 MSCs and CD90-negative MSCs suppressed peripheral blood mononuclear cell proliferation to the same extent as MSCs and shRNA control MSCs and non-transduced MSCs (Fig. 4a and b), indicating that a reduction in the expression of CD90 does not affect the characteristic im-munosuppressive effect of MSCs on lymphocyte prolifer-ation. Further analysis shows that ablation of CD90 on MSCs also does not affect the percentage of proliferated CD8+ T cells (Fig. 4c).
Flow cytometry immunophenotyping
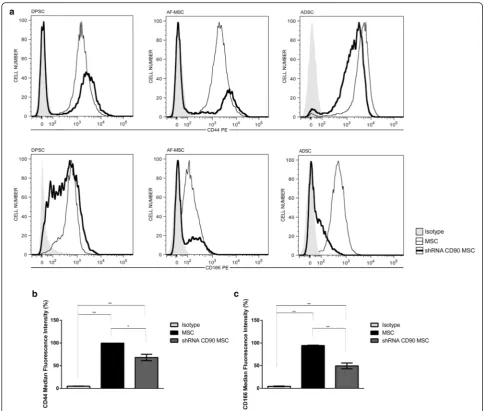
We further analysed the cell expression of the MSC marker panel. As expected, and as for non-transduced MSCs, shRNA control MSCs, shRNA CD90 MSCs, and CD90-negative MSCs were negative for the expression of the following markers: CD14, CD31, CD34, CD45, CD106, and HLA-DR, but they were positive for CD29, CD73, and CD105 (Additional file 1: Table S1 and Add-itional file 2: Figure S1). Surprisingly, we found a reduc-tion in the expression of the CD44 and CD166 markers in shRNA CD90 MSCs, suggesting that the CD90 reduc-tion is linked to the decrease in CD166 and CD44 ex-pression (Fig. 5a and b). These reductions were observed in MSCs from all three sources (Fig. 5a).
CD90 and MSC differentiation
The differentiation potentials of non-transduced MSCs, shRNA control MSCs, shRNA CD90 MSCs, and CD90-negative MSCs were analysed in parallel in multilineage (osteogenic and adipogenic) differentiation assays. MSCs
isolated from dental pulp, amniotic fluid, and adipose tis-sue were submitted to osteogenic differentiation assays. As expected, osteogenic induction (OS) resulted in the occur-rence of a mineralized matrix deposition which was de-tected 21 days after the initiation of differentiation
Fig. 3Reduction of CD90 expression does not affect mesenchymal stromal cell (MSC) morphology and proliferation rate.aRepresentative phase contrast microscopy images of MSCs derived from dental pulp. All MSCs displayed a spindle-like morphology exhibiting relatively thin processes extending from the cell bodies. The photographs shown here are representative of all samples analysed (n= 7).bProliferation curves of non-transduced MSCs, short hairpin (sh)RNA control MSCs, shRNA CD90 MSCs, and CD90-negative MSCs. Data shown represent the mean ± SD of two independent experiments performed in triplicate with dental pulp MSCs from two tissue donors; *p< 0.05
Fig. 2CD90-negative selection of shRNA CD90 MSCs by magnetic-activated cell sorting. Mesenchymal stromal cells (MSCs) expressing short hairpin (sh)RNA CD90 (shRNA CD90 MSC) were magnetically labelled with CD90 microbeads, and MSC populations negatively selected for CD90
(CD90-negative MSCs).aHistogram superposition: isotype control (shaded histogram grey), non-transduced MSCs (black slim line), shRNA control
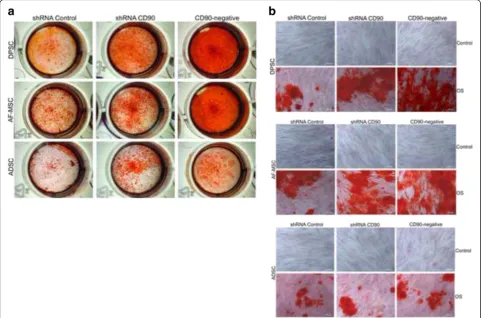
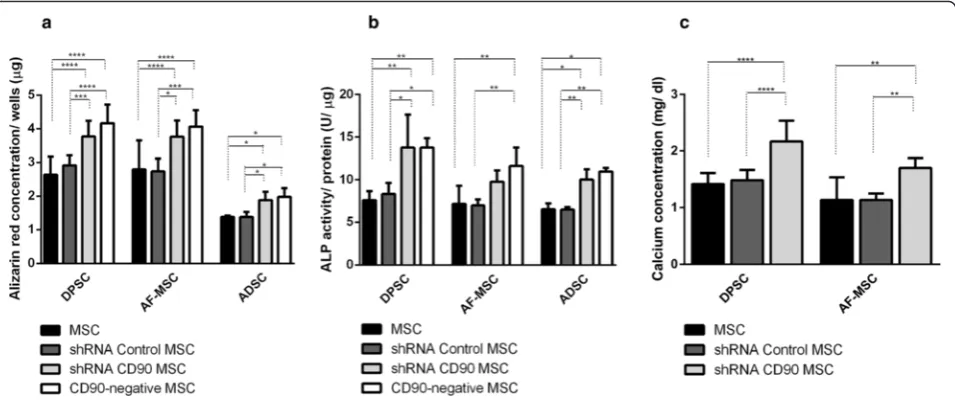
induction. The mineralized matrix was assessed by: a) Ali-zarin Red S Staining (AR); b) determination of calcium concentration; and c) alkaline phosphatase activity. Ac-cording to previous data reported by other groups [7, 59, 60], mineral deposition was higher in MSCs isolated from dental pulp than in those isolated from lipoaspirate tissue (Fig. 6). The AR staining pattern obtained differs ac-cording to the level of CD90 expression (Fig. 6). The shRNA CD90 MSCs showed significantly higher produc-tion of osteogenic matrices, with the visualizaproduc-tion of a higher concentration of AR dye in the samples, in compari-son to both non-transduced MSCs and shRNA control MSCs (Figs. 6 and 7a). Even higher mineralization was ob-served in CD90-negative MSC samples. The effect of re-duced CD90 expression on the osteogenic differentiation of MSCs was also assessed by monitoring alkaline phos-phatase activity, which demonstrated an enhanced produc-tion of this enzyme in cells with reduced CD90 expression (Fig. 7b). The calcium production by shRNA CD90 MSCs was also higher than in non-transduced MSCs (Fig. 7b). The calcium concentration could not be adequately mea-sured in samples originating from lipoaspirate tissue due the low calcium concentration in all samples.
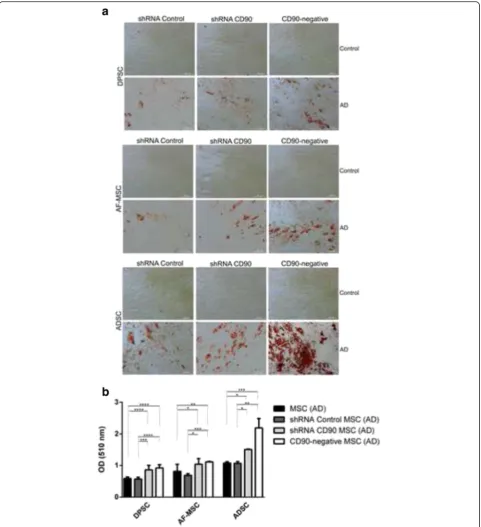
The adipogenic differentiation capacity of the MSCs was also analysed using MSCs isolated from dental pulp, adipose tissue, and amniotic fluid (Fig. 8). All cell populations showed significant morphological changes compared to those that were not incubated in adipogenesis-inducing medium. The cells presented an oval shape, with lipid vacuoles in the cytoplasm,
and the presence of many lipid droplets as evidenced by Oil Red staining (Fig. 8a). We observed an in-crease in the number of adipocyte-like cells in shRNA CD90 MSCs compared to the shRNA control MSCs, with an even higher number of adipocyte-like cells in CD90-negative MSCs. Independent of CD90 expres-sion, we found that MSCs from adipose tissue
pro-duced higher amounts of lipid droplets when
compared to cells obtained from the amniotic fluid and dental pulp. The most prominent adipocyte for-mation, revealed by Oil Red staining, was observed in CD90-negative MSCs isolated from adipose tissue (Fig. 8b).
Discussion
in immunophenotypical analysis using flow cytometry (Fig. 1). We subsequently evaluated the immunophenotypic profiles of modified MSCs, in addition to CD90. As ex-pected, we found that these cells expressed the positive MSC markers CD29, CD73, and CD105, and did not ex-press the following cell markers: CD14, CD31, CD34, CD45, CD106, and HLA-DR (Additional file 2: Figure S1). Surprisingly, we found that a knockdown in CD90 expres-sion in all CD90-shRNAi MSCs obtained here led to a re-duction in the CD44 and CD166 expression (Fig. 5).
The role of CD166 in MSCs has not been determined to date. However, CD44 (hyaluronan receptor) [63] is expressed by a large number of cells and is involved in
CD166. The authors showed that a knockdown of CD166 inhibits the expression of CD44 via the NFkB pathway [74].
CD90 has also been identified as a candidate marker for adult stem cells. Few studies have shown a functional asso-ciation between CD90 and CD44 or CD166 markers. Strik-ingly, the few data showing association come from cancer stem cell research: CD90, CD44, and CD166 are notably considered cancer stem cell markers [44, 70, 71, 75]. Our results showed that the knockdown of CD90 leads to a de-crease in CD44 and CD166 expression, which could indi-cate a shift in the stemness state of MSCs towards a state more susceptible to differentiation.
CD90 has been linked to the spindle-shape of lung fi-broblasts. Observing lung fibroblasts sorted on the basis of CD90 expression, Phipps and co-workers [76] affirmed that the lung CD90– fibroblast subpopulation showed a more polygonal shape than the spindle-shaped CD90+ fi-broblasts. In contrast to these observations, in our study, a reduction in CD90 expression in shRNA CD90 MSCs and CD90-negative MSCs did not present altered morphology
or proliferation rate when compared to control cells (Fig. 3). Here, we also demonstrated that a reduced ex-pression of CD90 does not affect the immunosuppressive activity of MSCs on lymphocyte proliferation in vitro (Fig. 5), a very important therapeutic MSC property.
We carried out assays to investigate the differentiation of CD90-ablated MSCs into osteogenic and adipogenic lineages. In our differentiation assays, shRNA CD90 MSCs and CD90-negative MSCs showed a higher rate of adipogenic differentiation when compared to the con-trols (Fig. 8). In the same way, an enhanced osteogenic differentiation was observed in samples of shRNA CD90 MSCs and CD90-negative MSCs. Alizarin Red S staining showed that CD90-negative MSCs, the CD90 negative fraction of shRNA CD90 MSCs, accumulated more min-eralized matrix than shRNA CD90 MSCs (Figs. 6 and 7). According to our results, the knockdown of CD90 ex-pression in MSCs facilitates osteogenic and adipogenic differentiation.
Recently, Woeller and colleagues [77] showed that CD90 controls adipogenesis. They had previously Fig. 6Reduction of CD90 expression stimulates MSC osteogenesis. MSCs, shRNA control MSCs, shRNA CD90 MSCs, and CD90-negative MSCs from dental pulp (DPSC), amniotic fluid (AF-MSC) and adipose tissue (ADSC) were tested in parallel for their ability to differentiate in vitro into osteogenic lineages. Calcified deposits were evidenced by Alizarin Red Staining (AR) in cells after 4 weeks of growth in osteogenic induction medium. Calcification was assessed by gross appearance (a) and light microscopy (b). Data shown are representative of multiple replicates.OSosteogenic induction,sh
observed that CD90-null mice gain weight at a faster rate, and that ectopic overexpression of CD90 blocked adipo-genesis [77]. They also stated that, although pre-adipocyte fibroblasts expressed CD90, fat adipocytes presented al-most undetectable CD90 levels. In agreement with this study, we also observed that a loss of CD90 expression in MSCs increased the production of adipogenic matrix in vitro. Based on their study, Woeller and colleagues [77] suggest that CD90 could be a new therapeutic target for obesity. However, our results indicate that this differenti-ation facilitdifferenti-ation related to decreased CD90 expression is not only for adipogenic differentiation, since we observed the same facilitation for osteogenic differentiation. Our data indicate that the knockdown of CD90 seems to lower the stemness guard of MSCs, thereby enabling further dif-ferentiation when in the presence of the specific stimuli.
The finding that the level of CD90 regulates both MSC adipogenesis and osteogenesis is very interesting, because it is well accepted that differentiation stimuli usually cause an “inverse relationship” between adipo-genic and osteoadipo-genic differentiation [78], although the molecular pathways that can converge into adipogenesis and osteogenesis have not been completely elucidated. Here, we demonstrated that the production of mineral-ized matrix directly correlates with the level of CD90 ab-lation: higher in the samples of CD90-negative MSCs than shRNA CD90 MSCs. It is unclear how CD90 can affect adipogenesis. However, it has been demonstrated that CD90 also regulates RhoGTPase activity in fibro-blasts. Exogenous expression on CD90-non-expressing
fibroblasts results in Rho GTPase activation [42]. CD90 participates in many signalling pathways, and it is be-coming clear that, although CD90 has been recognized as a plain cell marker, it is also an important regulator of MSC signalling [79]. In order to accurately understand the effects of CD90 on all cis- and trans-signalling networks that it participates in, significant further stud-ies are required. Improving our knowledge of these mechanisms may allow a better understanding of MSC stemness and differentiation.
An increasing number of studies have shown that MSCs from different sources display significantly di-verse properties and characteristics that may impact on their future therapeutic applications. The capacity of differentiation may vary according to the cell source [7, 59, 60]. In agreement with previous reports [59, 80–82], we observed that cells from the dental pulp tissue and aminiotic fluid produced a larger quantity of osteogenic matrix than cells from adipose tissue (Figs. 6 and 7). Despite the expected variance in the differentiation potential among MSCs from dif-ferent tissues [83, 84], we confirm that a reduction in CD90 expression leads to a more efficient osteogenic differentiation, irrespective of the source.
CD90 is a GPI-anchored protein expressed in vari-ous cell types. In general, it appears to influence cell proliferation, differentiation, migration, and survival. The functions of CD90 are tissue- and cell-specific and, in the present work, we found that shRNA-induced knockdown in human MSCs increases the Fig. 7Quantitative evaluation of osteogenesis.aQuantification of Alizarin Red staining by dissolving the dye and subsequent absorption measurement. bAlkaline phosphatase (ALP) activity in cells cultured in osteogenic medium. ALP activity (mUμmol p-nitrophenol released per min) was normalized for protein.cCalcium concentration determinations were possible only for DPSC samples and AF-MSC samples. The data are expressed as mean ± SD and are representative of two independent experiments, each performed in triplicate (DPSC = 2 donors, ADSC = 2 donors, AF-MSC = 2 donors). *p< 0.05; **p< 0.01; ***p< 0.001.ADSCadipose tissue mesenchymal stromal cell,AF-MSCamniotic fluid mesenchymal stromal cell,DPSCdental pulp mesenchymal stromal cell,
differentiation efficiency of these cells. Our group previ-ously showed that CD90 expression could be used as an indicator to follow the differentiation commitment degree
important to reiterate that the ablation of CD90 expres-sion did not result in a spontaneous differentiation. How-ever, it facilitated MSC differentiation in the presence of inductors, indicating that CD90 may play an important role in maintaining the undifferentiated state of MSCs, perhaps by acting as an obstacle to be overcome during the early steps of cellular differentiation commitment.
Conclusions
Taken together, the current data indicate that the abla-tion of CD90 in MSCs represents a promising alternative strategy and an efficient approach to increase MSC dif-ferentiation efficiency in vitro; it may, therefore, be used in the future to improve MSC differentiation yields in cellular therapy. Further studies are needed to evaluate whether this approach facilitates all the in vitro differen-tiation protocols established for MSCs, and how the ab-lation of CD90 affects migration/homing and the therapeutic potential of those cells in in vivo MSC ther-apy models. Our results showed that the knockdown of CD90 leads to a decrease in CD44 and CD166 expres-sion, which could indicate a shift in the stemness state of MSCs towards a state that is more susceptible to differentiation.
Additional files
Additional file 1: Table S1.Surface protein expression of transduced and non-transduced MSCs originated from dental pulp (DPSC) (n= 3), amniotic fluid (AF-MSCs) (n= 2), and lipoaspirate (ADSC) (n= 2) were analysed by flow cytometry. Data shown represent the mean MFI ± SD obtained in cytometry analysis performed in duplicate. (TIF 177 kb)
Additional file 2: Figure S1.Representative flow cytometry data to characterise transduced and non-transduced MSC groups studied in this work. One representative immunophenotypic analysis of groups obtained from the same dental pulp tissue is shown. Unstained MSC (grey shaded
histogram), MSC (grey line), shRNA control MSCs (black slim line), and
shRNA CD90 MSCs (black thick lines) were harvested and labelled with Ab against CD90, CD44, CD166, CD73, CD29, CD14, CD45, CD31, CD34, CD106, and HLA-DR as indicated. FACS analysis demonstrated that MSCs and shRNA CD90 MSCs were negative for CD14, CD45, CD31, CD106, HLA-DR, and CD34, and were positive for CD105, CD73, and CD29. MSCs were positive for CD90, CD44, and CD166, whereas shRNA CD90 MSCs showed a reduction in CD90, CD44, and CD166 expression. (TIF 8631 kb)
Abbreviations
ALP, alkaline phosphatase; CD, cluster differentiation; CFSE, carboxyfluorescein succinimidyl ester; CFU-F, colony-forming unit—fibroblast; HLA-DR, human leukocyte antigen—antigen D related; MSC, mesenchymal stromal cell; PBS, phosphate-buffered saline; PHA, phytohaemagglutinin; shRNA, small hairpin RNA
Acknowledgements
This work was supported by CNPq (Conselho Nacional de Desenvolvimento Científico e Tecnológico). We thank the Sabin Laboratory (Brasília-DF, Brasil) for their technical help with calcium concentration analysis. We also thank Felipe Saldanha-Araújo for technical help with lymphoproliferation assays and Raffael Castro for technical help with flow cytometry assays.
Funding
Conselho Nacional de Pesquisa (Brazil) funded this study. The funders had no role in study design, data collection and analysis, the decision to publish, or the preparation of the manuscript.
Availability of data and materials
The authors confirm that all data underlying the findings are fully available.
Authors’contributions
DAM, TTS, LFP, JRS, RBA, and DMO contributed to the study design. DAM, TTS, LFP, OAT, PQA, AP-T, LMC, RSB, and DMO contributed substantially to data collection, study execution, and data analysis and interpretation. DAM wrote the first draft of the manuscript; and PQA, RSB, OAT, TTS, LFP, LCM, AP-T, JRS, RBA, and DMO contributed to the preparation of the manuscript and editing. All authors read and approved the manuscript.
Competing interests
The authors declare that they have no competing interests.
Ethics approval and consent to participate
Human tissues were obtained under approval of the Ethical Committee of Health Sciences Faculty of the University of Brasília (Brazil) (Project number CAAE 0020.0.012.000-08).
Author details
1
Departamento de Genética e Morfologia, Universidade de Brasília, Brasília, DF, Brazil.2Departamento de Ciências da Saúde, Universidade de Brasília, Brasília, DF, Brazil.3Departamento de Neurologia e Neurocirurgia, Universidade Federal de São Paulo, São Paulo, SP, Brazil.4Hospital Israelita Albert Einstein, Instituto de Ensino e Pesquisa - Centro de Pesquisa Experimental São Paulo, São Paulo, SP, Brazil.5IB-Departamento de Genética e Morfologia, Universidade de Brasília - UNB, Campus Universitário Darcy Ribeiro, Asa Norte, Brasília CEP 70910-970, Brazil.6Centro Universitario do Distrito Federal UDF, Brasília, DF, Brazil.
Received: 12 April 2016 Revised: 28 June 2016 Accepted: 4 July 2016
References
1. Pittenger MF, Mackay AM, Beck SC, Jaiswal RK, Douglas R, Mosca JD, et al. Multilineage potential of adult human mesenchymal stem cells. Science. 1999;284:143–7.
2. De Bari C, Accio FD, Tylzanowski P, Luyten FP. Multipotent mesenchymal stem cells from adult human synovial membrane. Arthritis Rheum. 2001;44: 1928–42.
3. Kadivar M, Khatami S, Mortazavi Y, Taghikhani M, Shokrgozar MA. Multilineage differentiation activity by the human umbilical vein-derived mesenchymal stem cells. Iran Biomed J. 2006;10:175–84.
4. Dominici M, Le Blanc K, Mueller I, Marini FC, Krause DS, Deans RJ, et al. Minimal criteria for defining multipotent mesenchymal stromal cells. The International Society for Cellular Therapy position statement. Cytotherapy. 2006;8:315–7. doi:10.1080/14653240600855905.
5. Friedestein A, Deriglasosa U, Kulagina N, Panasuk A, Rudakowa S, Lurià E, et al. Precursors of fibroblasts in different populations of hematopoietic cells as detected by the in vitro colony assay method. Exp Hematol. 1974;2:1408–19. 6. Igura K, Zhang X, Takahashi K, Mitsuru A, Yamaguchi S, Takahashi TA. Isolation
and characterization of mesenchymal progenitor cells from chorionic villi of human placenta. Cytotherapy. 2004;6:543–53. doi:10.1080/14653240410005366. 7. Gronthos S, Mankani M, Brahim J, Robey PG, Shi S. Postnatal human dental
pulp stem cells (DPSCs) in vitro and in vivo. Proc Natl Acad Sci U S A. 2000; 97:13625–30. doi:10.1073/pnas.240309797.
8. Bi Y, Ehirchiou D, Kilts TM, Inkson CA, Embree MC, Sonoyama W, et al. Identification of tendon stem/progenitor cells and the role of the extracellular matrix in their niche. Nat Med. 2007;13:1219–27. doi:10.1038/nm1630. 9. Shih DT, Lee D, Chen S, Tsai R, Huang C. Isolation and characterization of
neurogenic mesenchymal stem cells in human scalp tissue. Stem Cells. 2005;23:1012–20. doi:10.1634/stemcells.2004-0125.
11. Erices A, Conget P, Minguell J. Mesenchymal progenitor cells in human umbilical cord blood. Br J Haematol. 2000;109:235–42.
12. Sarugaser R, Lickorish D, Baksh D, Hosseini MM, Davies JE. Human umbilical cord perivascular (HUCPV) cells: a source of mesenchymal progenitors. Stem Cells. 2005;23:220–9. doi:10.1634/stemcells.2004-0166.
13. Wang H, Hung S, Peng S, Huang C, Wei H, Guo Y, et al. Mesenchymal stem cells in the Wharton’s jelly of the human umbilical cord. Stem Cells. 2004;22: 1330–7. doi:10.1634/stemcells.2004-0013.
14. Tsai M, Lee J, Chang Y, Hwang S. Isolation of human multipotent mesenchymal stem cells from second-trimester amniotic fluid using a novel two-stage culture protocol. Hum Reprod. 2004;19:1450–6. doi:10.1093/humrep/deh279. 15. Patki S, Kadam S, Chandra V, Bhonde R. Human breast milk is a rich
source of multipotent mesenchymal stem cells. Hum Cell. 2010;23:35– 40. doi:10.1111/j.1749-0774.2010.00083.x.
16. Murphy MB, Moncivais K, Caplan AI. Mesenchymal stem cells: environmentally responsive therapeutics for regenerative medicine. Exp Mol Med. 2013;45:1–16. doi:10.1038/emm.2013.94.
17. Horwitz EM, Le Blanc K, Dominici M, Mueller I, Slaper-Cortenbach I, Marini FC, et al. Clarification of the nomenclature for MSC: The International Society for Cellular Therapy position statement. Cytotherapy. 2005;7:393–5. doi:10.1080/14653240500319234.
18. Russel K, Phinney D, Lacey M, Barrilleaux B, MMeyertholen KE, O'Connor KC. In vitro high-capacity assay to quantify the clonal heterogeneity in trilineage potential of mesenchymal stem cells reveals a complex hierarchy of lineage commitment. Stem Cells. 2010;28:788–98. doi:10.1002/stem.312.
19. Lv F-J, Tuan R, Cheung K, Leung V. Concise review: The surface markers and identity of human mesenchymal stem cells. Stem Cells. 2014;32:1408–19. 20. Miura M, Gronthos S, Zhao M, Lu B, Fisher LW, Robey PG, et al. SHED: stem
cells from human exfoliated deciduous teeth. Proc Natl Acad Sci U S A. 2003;100:5807–12. doi:10.1073/pnas.0937635100.
21. Huang G, Gronthos S, Shi S. Mesenchymal stem cells derived from dental tissues vs. those from other sources: their biology and role in regenerative medicine. J Dent Res. 2009;88:792–806. doi:10.1177/0022034509340867. 22. Kolf CM, Cho E, Tuan RS. Review: mesenchymal stromal cells biology
of adult mesenchymal stem cells: regulation of niche, self-renewal and differentiation MSC markers. Arthritis Res Ther. 2007;9:1–10. doi: 10.1186/ar2116.
23. Hiwase SD, Dyson PG, To LB, Lewis ID. Cotransplantation of placental mesenchymal stromal cells enhances single and double cord blood engraftment in nonobese diabetic/severe combined immune deficient mice. Stem Cells. 2009;27:2293–300. doi:10.1002/stem.157.
24. Delorme B, Ringe J, Gallay N, Le Vern Y, Kerboeuf D, Jorgensen C, et al. Specific plasma membrane protein phenotype of culture-amplified and native human bone marrow mesenchymal stem cells. Hematopoiesis Stem Cells. 2008;111: 2631–5. doi:10.1182/blood-2007-07-099622.
25. Sibov TT, Severino P, Marti LC, Pavon LF, Oliveira DM, Tobo PR, et al. Mesenchymal stem cells from umbilical cord blood: parameters for isolation, characterization and adipogenic differentiation. Cytotechnology. 2012;64:511–21. doi:10.1007/s10616-012-9428-3. 26. Williams AF, Gagnon J. Neuronal cell Thy-1 glycoprotein: homology with
immunoglobulin. Science. 1982;216:696–703.
27. Raff M. Surface antigenic markers for distinguishing T and B lymphocytes in mice. Transplant Rev. 1971;6:52–80.
28. Rege TA, Hagood JS. Thy-1 as a regulator of cell-cell and cell-matrix interactions in axon regeneration, apoptosis, adhesion, migration, cancer, and fibrosis. FASEB J. 2006;20:1045–54. doi:10.1096/fj.05-5460rev.
29. Bradley JE, Ramirez G, Hagood JS. Roles and regulation of Thy-1, a context-dependent modulator of cell phenotype. Biofactors. 2009;35: 258–65. doi:10.1002/biof.41.
30. Barboni E, Gormley AM, Rivero FBP, Vidal M, Morris R. Activation of T lymphocytes by cross-linking of glycophospholipid-anchored Thy-1 mobilizes separate pools of intracellular second messengers to those induced by the antigen-receptor/ CD3 complex. Immunology. 1991;72:457–63.
31. Morris R, Tiveron M, Xue G. The relation of the expression and function of the neuronal glycoprotein Thy-1 to axonal growth. Biochem Soc Trans. 1991;20:401–5. 32. Jeng CJ, McCarroll SA, Martin TFJ, Floor E, Adams J, Krantz D, et al. Thy-1 is a
component common to multiple populations of synaptic vesicles. J Cell Biol. 1998;140:685–98. doi:10.1083/jcb.140.3.685.
33. Leyton L, Schneider P, Labra CV, Ruegg C, Hetz CA, Quest AFG, et al. Thy-1 binds to integrinβ3 on astrocytes and triggers formation of focal contact sites. Curr Biol. 2001;11:1028–38.
34. Hueber AO, Bernard AM, Battari CL, Marguet D, Massol P, Foa C, et al. Thymocytes in Thy-1-/- mice show augmented TCR signaling and impaired differentiation. Curr Biol. 1997;7:705–8. doi:10.1016/S0960-9822(06)00300-9.
35. Lung HL, Bangarusamy DK, Xie D, Kwok A, Cheung L, Cheng Y, et al. THY1 is a candidate tumour suppressor gene with decreased expression in metastatic nasopharyngeal carcinoma. Oncogene. 2005;24:6525–32. doi:10.1038/sj.onc. 1208812.
36. Lung HL, Cheung AKL, Cheng Y, Kwong FM, Lo PHY, Law EWL, et al. Functional characterization of THY1 as a tumor suppressor gene with antiinvasive activity in nasopharyngeal carcinoma. Int J Cancer. 2010;127:304–12. doi:10.1002/ijc.25047. 37. Abeysinghe HR, Pollock SJ, Guckert NL, Veyberman Y, Keng P, Halterman M,
et al. The role of the THY1 gene in human ovarian cancer suppression based on transfection studies. Cancer Genet Cytogenet. 2004;149:1–10. doi: 10.1016/S0165-4608(03)00234-6.
38. Saalbach A, Anderegg U, Bruns M, Schnabel E, Hermann K, Haustein U. Novel fibroblast-specific monoclonal antibodies: properties and specificities. Soc Invest Dermatol. 1996;106:1314–9.
39. Fries K, Blieden T, Looney R, Sempowski G, Silvera M, Willis R, et al. Evidence of fibroblast heterogeneity and role of fibroblast subpopulations in fibrosis. Clin Immunol Immunopathol. 1994;72:283–92.
40. Zhou Y, Hagood JS, Murphy-ullrich JE. Thy-1 expression regulates the ability of rat lung fibroblasts to activate transforming growth factor-βin response to fibrogenic stimuli. Am J Pathol. 2004;165:659–69.
41. Hagood JS, Prabhakaran P, Kumbla P, Salazar L, Macewen MW, Barker TH, et al. Loss of fibroblast Thy-1 expression correlates with lung fibrogenesis. Am J Pathol. 2005;167:365–79.
42. Barker TH, Grenett HE, MacEwen MW, Tilden SG, Fuller GM, Settleman J, et al. Thy-1 regulates fibroblast focal adhesions, cytoskeletal organization and migration through modulation of p190 RhoGAP and Rho GTPase activity. Exp Cell Res. 2004;295:488–96. doi:10.1016/j.yexcr.2004.01.026.
43. Jósvay K, Winter Z, Katona RL, Pecze L, Marton A, Buhala A, et al. Besides neuro-imaging, the Thy1-YFP mouse could serve for visualizing experimental tumours, inflammation and wound-healing. Sci Rep. 2014;4:1–7. doi:10.1038/ srep06776.
44. Yang ZF, Ho DW, Ng MN, Lau CK, Yu WC, Ngai P, et al. Significance of CD90 + cancer stem cells in human liver cancer. Cancer Cell. 2008;13:153–66. doi: 10.1016/j.ccr.2008.01.013.
45. Lu J-W, Chang J-G, Yeh K-T, Chen R-M, Tsai JJP, Hu R-M. Overexpression of Thy1/CD90 in human hepatocellular carcinoma is associated with HBV infection and poor prognosis. Acta Histochem. 2011;113:833–8. doi:10.1016/ j.acthis.2011.01.001.
46. Sukowati CHC, Anfuso B, Torre G, Francalanci P, Crocè LS, Tiribelli C. The expression of CD90/Thy-1 in hepatocellular carcinoma: an in vivo and in vitro study. PLoS One. 2013;8:1–11. doi:10.1371/journal.pone.0076830. 47. Pascal LE, Ai J, Vêncio RZN, Vêncio EF, Zhou Y, Page LS, et al. Differential
inductive signaling of CD90+ prostate cancer-associated fibroblasts compared to normal tissue stromal mesenchyme cells. Cancer Microenviron. 2011;4:51–9. doi:10.1007/s12307-010-0061-4.
48. True LD, Zhang H, Ye M, Huang C-Y, Nelson PS, von Haller PD, et al. CD90/ THY1 is overexpressed in prostate cancer-associated fibroblasts and could serve as a cancer biomarker. Mod Pathol. 2010;23:1346–56. doi:10.1038/ modpathol.2010.122.
49. He J, Liu Y, Zhu T, Zhu J, DiMeco F, Vescovi AL, et al. CD90 is identified as a candidate marker for cancer stem cells in primary high-grade gliomas using tissue microarrays. Mol Cell Proteomics. 2012;11:M111.010744–4. doi:10.1074/ mcp.M111.010744.
50. Zhu J, Thakolwiboon S, Liu X, Zhang M, Lubman DM. Overexpression of CD90 (Thy-1) in pancreatic adenocarcinoma present in the tumor microenvironment. PLoS One. 2014;9:1–20. doi:10.1371/journal.pone.0115507.
51. Ishiura Y, Kotani N, Yamashita R, Yamamoto H, Kozutsumi Y, Honke K. Anomalous expression of Thy1 (CD90) in B-cell lymphoma cells and proliferation inhibition by anti-Thy1 antibody treatment. Biochem Biophys Res Commun. 2010;396:329–34. doi:10.1016/j.bbrc.2010.04.092. 52. Maleki M, Ghanbarvand F, Behvarz MR, Ejtemaei M, Ghadirkhomi E.
Comparison of mesenchymal stem cell markers in multiple human adult stem cells. Int J Stem Cells. 2014;7:118–26.
54. Gregory CA, Gunn WG, Peister A, Prockop DJ. An Alizarin red-based assay of mineralization by adherent cells in culture: comparison with cetylpyridinium chloride extraction. Anal Biochem. 2004;329:77–84. doi:10.1016/j.ab.2004.02.002. 55. Conconi MT, Tommasini M, Muratori E, Parnigotto PP. Essential amino acids
increase the growth and alkaline phosphatase activity in osteoblasts cultured in vitro. Farmaco. 2001;56:755–61.
56. Lowry OH, Rosebrough NJ, Farr AL, Randall RJ. Protein measurement with the folin phenol reagent. J Biol Chem. 1951;193:265–75.
57. Gitelman J. An improved automated procedure of calcium in biological for the determination specimens. Anal Biochem. 1967;18:521–31.
58. Sekiya I, Larson BL, Smith JR, Pochampally R, Cui J-G, Prockop DJ. Expansion of human adult stem cells from bone marrow stroma: conditions that maximize the yields of early progenitors and evaluate their quality. Stem Cells. 2002;20:530–41.
59. Davies OG, Cooper PR, Shelton RM, Smith a J, Scheven BA. A comparison of the in vitro mineralisation and dentinogenic potential of mesenchymal stem cells derived from adipose tissue, bone marrow and dental pulp. J Bone Miner Metab. 2014;371–82.
60. Divya MS, Roshin GE, Divya TS, Rasheed VA, Santhoshkumar TR, Elizabeth KE, et al. Umbilical cord blood-derived mesenchymal stem cells consist of a unique population of progenitors co-expressing mesenchymal stem cell and neuronal markers capable of instantaneous neuronal differentiation. Stem Cell Res Ther. 2012;3:1–16. doi:10.1186/scrt148.
61. Krampera M, Pasini A, Rigo A, Scupoli MT, Tecchio C, Malpeli G, et al. HB-EGF/HER-1 signaling in bone marrow mesenchymal stem cells: inducing cell expansion and reversibly preventing multilineage differentiation. Blood. 2005;106:59–66. doi:10.1182/blood-2004-09-3645.
62. Feng J, Mantesso A, De Bari C, Nishiyama A, Sharpe PT. Dual origin of mesenchymal stem cells contributing to organ growth and repair. Proc Natl Acad Sci U S A. 2011;108:6503–8. doi:10.1073/pnas.1015449108.
63. Lesley J, Hascall VC, Tammi M, Hyman R. Hyaluronan binding by cell surface CD44. J Biol Chem. 2000;35:26967–75.
64. Zhu H, Mitsuhashi N, Klein A, Barsky LW, Weinberg K, Barr ML, et al. The role of the hyaluronan receptor CD44 in mesenchymal stem cell migration in the extracellular matrix. Stem Cells. 2006;24:928–35. doi:10. 1634/stemcells.2005-0186.
65. Puré E, Cuff CA. A crucial role for CD44 in inflammation. Trends Mol Med. 2001;7:213–21.
66. Sapaeth EL, Labaff AM, Toole BP, Klopp A, Andreeff M, Marini FC. Mesenchymal CD44 expression contributes to the acquisition of an activated fibroblast phenotype via TWIST activation in the tumor microenvironment. Cancer Res. 2013;73(17). doi:10.1158/0008-5472. 67. Pham PV, Phan NL, Nguyen NT, Truong NH, Duong TT, Le DV, et al.
Differentiation of breast cancer stem cells by knockdown of CD44: promising differentiation therapy. J Transl Med. 2011;9:209. doi:10.1186/1479-5876-9-209. 68. Bowen MA, Patel DD, Li X, Modrell B, Malacko AR, Wang W, et al. Cloning,
mapping and characterization of activated leukocyte-cell adhesion molecule (ALCAM) a CD6 ligant. J Exp Med. 1995;181:2213–20.
69. Swart GW, Lunter PC, van Kilsdonk JW, van Kempen LC. Activated leukocyte cell adhesion molecule (ALCAM/CD166): signaling at the divide of melanoma cell clustering and cell migration. Cancer Metastasis. 2005;24:223–36. doi:10. 1007/s10555-005-1573-0.
70. Bruder SP, Jaiswal N, Haynesworth SE. Growth kinetics, self-renewal, and the osteogenic potential of purified human mesenchymal stem cells during extensive subcultivation and following cryopreservation. J Cell Biochem. 1997;64:278–94.
71. Lugli A, Iezzi G, Hostettler I, Muraro MG, Mele V, Tornillo L, et al. Prognostic impact of the expression of putative cancer stem cell colorectal cancer. Br J Cancer. 2010;103:382–90. doi:10.1038/sj.bjc.6605762.
72. Piscuoglio S, Lehmann FS, Zlobec I, Tornillo L, Dietmaier W, Hartmann A, et al. Effect of EpCAM, CD44, CD133 and CD166 expression on patient survival in tumours of the ampulla of Vater. J Clin Pathol. 2011:1–6. doi:10.1136/ jclinpath-2011-200043.
73. Fujiwara K, Ohuchida K, Sada M, Horioka K, Iii CDU, Shindo K, et al. CD166/ALCAM expression is characteristic of tumorigenicity and invasive and migratory activities of pancreatic cancer cells. PLoS One. 2014;9:1–11. doi:10.1371/journal.pone.0107247.
74. Ma L, Pan Q, Sun F, Yu Y, Wang J. Cluster of differentiation 166 (CD166) regulates cluster of differentiation (CD44) via NF-kB in liver cancer cell line Bel-7402. Biochem Biophys Res Commun. 2014;451:334–8. doi:10.1016/j.bbrc. 2014.07.128.
75. Donnenberg VS, Donnenberg AD, Zimmerlin L, Landreneau RJ, Bhargava R, Wetzel RA, et al. Localization of CD44 and CD90 positive cells to the invasive front of breast tumors. Cytometry B Clin Cytom. 2010;78B:287–301. doi:10.1002/cyto.b.20530.
76. Phipps RP, Penney DP, Keng P. Characterization of two major populations of lung fibroblasts: distinguishing morphology and discordant display of Thy-1 and class II MHC. Am J Respir Cell Mol Biol. 1989;1:65–74.
77. Woeller CF, O’Loughlin CW, Pollock SJ, Thatcher TH, Feldon SE, Phipps RP. Thy1 (CD90) controls adipogenesis by regulating activity of the Src family kinase. Fyn FASEB. 2015;29:920–31. doi:10.1096/fj.14-257121.
78. James AW. Review of signaling pathways governing MSC osteogenic and adipogenic differentiation. Scientifica. 2013;2013:1–17. doi:10.1155/2013/684736. 79. Barker TH, Hagood JS. Getting a grip on Thy-1 signaling. Biochim Biophys
Acta. 2009;1793:921–3. doi:10.1016/j.bbamcr.2008.10.004.
80. Ito K, Yamada Y, Nakamura S, Ueda M. Osteogenic potential of effective bone engineering using dental pulp stem cells, bone marrow stem cells and periosteal cells for osseointegration of dental implants. Int J Oral Maxillofac Implants. 2011;26:947–54.
81. Yu J, Wang Y, Deng Z, Tang L, Li Y, Shi J, et al. Odontogenic capability: bone marrow stromal stem cells versus dental pulp stem cells. Biol Cell. 2007;99:465–74.
82. Alge DL, Zhou D, Adams LL, Wiss BK, Shadday MD, Woods EJ, et al. Donor-matched comparison of dental pulp stem cells and bone marrow-derived mesenchymal stem cells in a rat model. J Tissue Eng Regen Med. 2010;4:73–81. 83. Chen XD, Qian HY, Neff L, Satomura K, Horowitz MC. Thy-1 antigen expression
by cells in the osteoblast lineage. J Bone Miner Res. 1999;14:362–75. doi:10. 1359/jbmr.1999.14.3.362.
84. Wiesmann A, Bühring H-J, Mentrup C, Wiesmann H-P. Decreased CD90 expression in human mesenchymal stem cells by applying mechanical stimulation. Head Face Med. 2006;2:1–6. doi:10.1186/1746-160X-2-8.
• We accept pre-submission inquiries
• Our selector tool helps you to find the most relevant journal
• We provide round the clock customer support
• Convenient online submission
• Thorough peer review
• Inclusion in PubMed and all major indexing services
• Maximum visibility for your research
Submit your manuscript at www.biomedcentral.com/submit