RESEARCH ARTICLE
Improved region growing algorithm
for the calibration of flaking deterioration
in ancient temple murals
Jianfang Cao
1,2*, Yanfei Li
1, Hongyan Cui
1and Qi Zhang
1Abstract
Ancient murals are vulnerable to varying degrees of damage due to long-term exposure to external environmental factors such as light, temperature and humidity. Enabling people to appreciate the original features of murals has become a concern for field experts. The development of computer technology makes it possible to use intelligent information processing to simulate and restore ancient murals. This paper proposes an improved region growing algorithm based on threshold segmentation to automatically calibrate the flaking-related deterioration of murals in response to erosion by taking temple murals from the Song Dynasty in Kaihua Temple as the study object. First, we analyze the color characteristics of the flaking area, mark the suspected flaking-damaged points by threshold seg-mentation, and use these points as seeds for the area growth and expansion of the flaking area. We then calculate the color mask. Next, in the YCbCr and HSV color spaces, the brightness, chroma, and saturation characteristics of the flaking area are analyzed. The masks for the brightness, chroma, and saturation of the flaking area are obtained by threshold segmentation, and all the feature masks are merged. Finally, the mask of the flaking area obtained by data fusion is added to the original image to calibrate the flaking deterioration. Compared with current calibration algorithms based on multiscale mural deterioration, the experimental results show that the average error and error standard deviation of the proposed calibration algorithm are 1.91 and 1.82, respectively, without noise and 1.97 and 1.85, respectively, with noise. The errors are reduced, and the calibration performance is improved and stable. This work provides a good foundation for the virtual and practical restoration of ancient murals.
Keywords: Flaking deterioration, Threshold segmentation, Region growing, Feature mask, Automatic calibration
© The Author(s) 2018. This article is distributed under the terms of the Creative Commons Attribution 4.0 International License (http://creat iveco mmons .org/licen ses/by/4.0/), which permits unrestricted use, distribution, and reproduction in any medium, provided you give appropriate credit to the original author(s) and the source, provide a link to the Creative Commons license, and indicate if changes were made. The Creative Commons Public Domain Dedication waiver (http://creat iveco mmons .org/ publi cdoma in/zero/1.0/) applies to the data made available in this article, unless otherwise stated.
Introduction
Ancient mural art represents an important cultural her-itage and includes a substantial amount of cultural, his-torical, and artistic information that vividly documents the social features of various ethnic groups and periods and has important historical, scientific, and artistic val-ues. Palace relief frescos from the Egypt and Two Riv-ers Empire ages, palace murals from the Aegean culture, temples, tombs and house murals from Ancient Greece and Rome, and tomb murals, stone murals, and temple murals from the Chinese Han Dynasty, Wei Jin Southern
and Northern Dynasties and Tang Dynasty represent an important chapter in the history of world mural paintings [1]. The ancient murals that were discovered and are still preserved in Shanxi, China, represent a total area of more than 25,000 m2. Among existing murals, the largest and
most abundant are mural paintings [2]. These murals, which originated in the Han Dynasty and were produced throughout the Southern and Northern Dynasties, were linked to the Tang, Song, Yuan, Ming and Qing dynas-ties. In addition, the styles were inherited from other dynasties but show variations. Not only do these murals embody the characteristics of paintings in different his-torical periods, they also play an indispensable role in the study of arts, society, and religion [3]. However, tem-ple murals present varying degrees of flaking deteriora-tion phenomena, damaged as a result of history, climate,
Open Access
*Correspondence: [email protected]
and other factors. This flaking deterioration not only greatly affects the visual experience of visitors but also represents the beginning of the destruction of cultural heritage, such as murals [4]. The calibration and virtual restoration of deteriorated murals is attracting increased attention from researchers. Researchers can lay the foun-dation for the virtual display of murals while also provid-ing references for the repair of these murals.
Recently, scholars have achieved various results in addressing this problem facing ancient murals by using intelligent protection. Izzo et al. [5] conducted in-depth research on various materials in Italian fresco paint-ing techniques from different ages, specifically focuspaint-ing on two main cases, i.e., the murals of Mario Sironi and Edmondo Bacci in Venice, and aimed at understanding the protection needs of these paintings and developing a sustainable protection plan. Sakr et al. [6] studied the influence of and solutions to streptomyces discoloration in mural paintings from ancient Egyptian tombs, thereby laying the foundation for the digital protection of ancient murals. Abdel-Haliem et al. [7] isolated and identified the streptomycetes that mainly affect the discoloration of paintings in ancient Egyptian tombs, thus providing new ideas for the removal of streptomyces. Li et al. [8] inves-tigated the effectiveness of reinforcing mural paintings at the Mogao Grottoes in Dunhuang, China, by conducting on-site inspections to determine if new murals that had been previously repaired presented new forms of deterio-ration. These studies focused on ancient murals from the perspectives of aesthetics, biology, and chemistry, pro-posed the need for mural protection and laid the founda-tion for the protecfounda-tion of ancient murals using intelligent information processing technologies. In research on digital protection processes for ancient murals, Wan [9] studied ancient Chinese Dunhuang murals and designed a pigment color prototype that facilitates the digital con-servation of ancient murals. Zhang et al. [10] developed a simulation platform for morphology analysis of ancient mural deterioration. By processing the surfaces of digi-tal murals, Zhang et al. obtained three-dimensional data on murals and proposed a quantitative analysis method to analyze micro changes in the murals. Ren et al. [11] proposed a color clustering and masking algorithm to segment and extract damaged Dunhuang mural regions and designed a mural calibration and repair algorithm for fading and scratches. Tang et al. [12] proposed a method of clustered multi-instance learning to classify mural images from different ages, therein attempting to address the characteristics of Dunhuang mural images, which present strong intraclass variance and background noise. Luo et al. [13] extracted the scale-invariant feature trans-form (SIFT) and color features of mural images and used support vector machines to automate the classification of
mural deterioration in Dunhuang. Li et al. [14] designed a visual analysis tool based on risk management to study single or multiple risks at the scales of sites, caves, walls, and specific risk areas from different perspectives at Mogao Grottoes in Dunhuang for facilitating computer intelligent repair processing. For the automatic calibra-tion of murals, Wang et al. [15] extracted crack informa-tion using a top-hat transformainforma-tion from the images of Tang dynasty mural paintings to realize automatic rec-ognition and calibration. However, this method relied heavily on the selection of structural elements and thus experienced an overcalibration problem. Li et al. [16] proposed an automatic calibration method for mud spot disease in addressing the burial mural erosion problem. However, the texture feature used in this method is only ideal for the calibration of mud spot damage and expe-riences the problem of insufficient calibration for flaking deterioration. Wu et al. [17] improved the algorithm in [15], increased the scale of the structural elements, and used multiscale calibration of the deterioration; however, the analysis and calculation process of this algorithm is complex, and the time complexity is high. Huang et al. [18] proposed a multipath convolutional neural network (CNN) algorithm to detect erosion damage areas in 89 groups of ancient murals. This study reports the latest research results for the intelligent processing of ancient murals using machine learning methods. Scholars study-ing the intelligent processstudy-ing of ancient murals are still in the beginning and exploration stages of this field.
color layer separation algorithm based on a fuzzy cluster-ing and region growcluster-ing algorithm. To address the issue of the optical similarity of adjacent grains or optical aggregates in the precise imaging of minerals in weath-ered sandstones, which makes grain boundaries dif-ficult to define, Asmussen et al. [25] proposed a seeded region growing algorithm that analyzes 39 transmitted light images of 13 weathered sandstone samples from the Buntsandstein Formation in northwestern Germany. In summary, the region growing algorithm has been suc-cessfully applied in image segmentation and calibration, but the application of this algorithm in the segmentation of ancient murals has not been reported. As a special type of image, murals in the contours of an exfoliated area are clearly segmented from other normal areas. Applications using region growing algorithms to demarcate the exfo-liation of ancient murals are highly applicable.
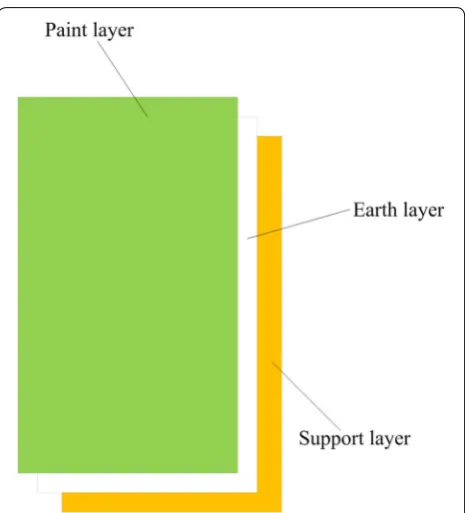
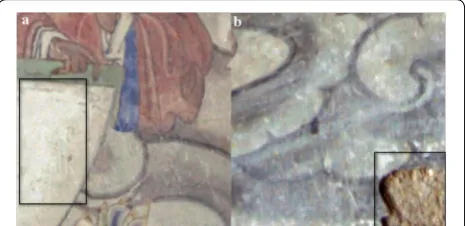
The team of authors in this study analyzed ancient temple murals and found that deterioration caused by flaking processes is the most serious type of damage, as the flaking area is relatively large. Compared with other types of damage, the impact of flaking deterioration on the content of the murals is high. In general, the overall structure of a mural is as follows: the lowermost layer is the support (wall), the center layer is the earth layer (normally made from the mixture of sand, cotton, hemp fibers, wheat straw segments, glue, alum, and so on; the surface of which is an approximately 1-mm thick layer of plaster), and the uppermost layer is the painting, as shown in Fig. 1. According to the degree of flaking expe-rienced by the mural, mural flaking can be divided into paint layer flaking (shallow layer flaking, i.e., the part of the earth layer exposed by the mural) and earth layer flaking (deep layer flaking, i.e., the part of the support layer barely exposed by the mural). As shown in Fig. 2, the area marked with a box in the figure is a flaking area. Ancient temple murals combined painting with sculpt-ing and a variety of compositional forms in the creative process, thereby integrating sculptures and paintings. The murals are colorful and have rich variation and pro-found meaning, and the borders of various regions of the mural are obvious and easily separated, thereby providing new opportunities for the use of computer intelligence processing technology for automatically calibrating the flaking-damaged areas in murals. To protect the above-mentioned ancient temple murals, this paper proposes the region growing algorithm fused with threshold seg-mentation (TS-RG), which automatically calibrates the flaking area in temple murals based on the mural of Kaihua Temple from the Song Dynasty. Based on region growing and threshold segmentation algorithms for cal-culating each feature mask separately, each feature mask is merged to improve the calibration accuracy. Then, the
final mask of the flaking-damaged region is obtained via automatic calibration. The experimental results show that the algorithm is more accurate than current calibra-tion algorithms and that user satisfaccalibra-tion is improved.
Methods
Kaihua Temple is located in Mengshan, 20 km south-west of Taiyuan in Shanxi, China. This temple was built in the post-Tongzhuang period of the Five Dynasties and rebuilt in the Northern Song Dynasty. Kaihua is a famous ancient temple in Shanxi and one of its most valuable buildings. The Main Shrine Hall is the primary building of the temple. The murals in the temple com-prise a total area of 88.2 m2 and are among the largest
and most unique murals still existing from the Chinese Song Dynasty [3]. However, due to climate change, natu-ral disasters, and environmental pollution, these munatu-rals are facing varying degrees of damage, including smoke damage, fissures, mildew, color fading, and wall detach-ment. Therefore, the different regions that constitute these mural images have varying degrees of defects, with some on the verge of losing their original appearance and urgently needing to be repaired and protected. No obvi-ous shapes or textures characterize the flaking areas of the temple murals, but the color features are particularly obvious, and the flaking areas are relatively monochro-matic. The paint layer flaking areas have a higher bright-ness and gray value; the earth layer flaking areas have a
high saturation and present more obvious color differ-ences. In this paper, temple murals are calibrated using different methods based on their characteristics, i.e., dif-ferent degrees of flaking deterioration.
Automatic identification and calibration of flaking deterioration in the paint layer
The paint layer of a temple mural is both based on the earth layer and above the earth layer. The earth layer is a mural surface painted with a plaster with a thickness of approximately 1 mm that has a color similar to white, with a high brightness and gray value. The identification and calibration of damages to the paint layer are relatively easy. This paper uses a threshold segmentation method to identify such damage. This method transforms the image from the Red–Green–Blue (RGB) color space into the YCbCr (where Y refers to the luminance component, Cb refers to the blue chroma component, and Cr refers to the red chroma component) color space [7]. Next, gray-scale histogram arithmetic is used to obtain the range of brightness values of the intact mural image and the pure earth layer image to determine the threshold range of the flaking area in the paint layer. Then, the method uses Eq. (1) to perform threshold segmentation to calcu-late the mask of the flaking area. Finally, the mask and the image to be calibrated are added, thus recognizing and calibrating the flaking deterioration in the paint layer.
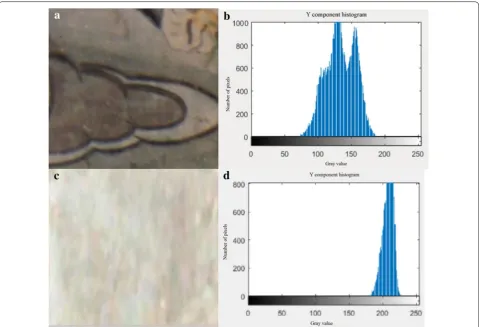
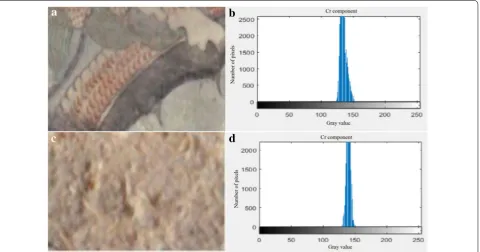
Here, Mmask is the mask of the flaking area, Si is the Y component pixel value of the image to be calibrated in YCbCr space, and τ1 and τ2 are the lower and upper thresholds in the flaking area, respectively. The extraction results of the grayscale histogram arithmetic are shown in Fig. 3.
Because the brightness of the images obtained differs with different angles, times and illumination intensities, (1) Mmask =
255, τ1≤Si≤τt 0, other
the experimental results have a great influence. Therefore, mural images obtained by frontal shooting under indirect sunlight during the same time period are selected for the experiment. Repeated experiments indicated that the brightness values of the pure earth layer images are dis-tributed between 187 and 221, while the brightness val-ues of the paint layers of intact mural images are mainly distributed between 78 and 174. Therefore, the brightness value range of 187–221 is used as the brightness segmen-tation threshold; the pixels with a brightness in this range are considered the flaking region, whereas the pixels with a brightness not in this range are not in this region.
Automatic identification and calibration of flaking deterioration in the earth layer
TS‑RG algorithm
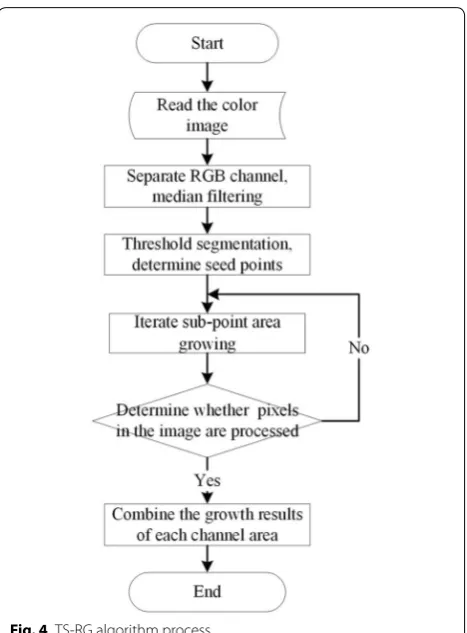
Region growing is the process of combining pixels or subregions into a larger area according to predefined rules; region growing algorithms are very sensitive to the seed point [26]. To improve the accuracy of the mask cal-culation, the TS-RG algorithm separates the RGB chan-nels of the color mural image. Then, the algorithm uses a 3 × 3 window to apply the median-filter method; then, the method applies threshold segmentation to each chan-nel to determine the seed points and utilizes multiple subpoint area growing processes. The eight neighboring points for which the feature similarity satisfies the given conditions are merged until all the pixel points have been processed. Finally, the growth results of each chan-nel region are merged. The TS-RG algorithm process is shown in Fig. 4.
The steps of the algorithm are as follows:
Input: color image to be calibrated I, RGB grayscale range of each channel ε, and RGB growth threshold value T of each channel ε.
Output: image color mask to be calibrated Mmask.
Step 1. Separate the RGB channels of the image to be calibrated.
Step 2. Perform 3 × 3 median filtering and merging for each channel; then, obtain the median filtered image I_filter.
Step 3. Threshold segmentation determine the gray-scale change range in RGB space for each channel ε and calibrate the gray value of each pixel. The pixel gray value in the ε range is set to 255, and the other values are set to 0, thereby obtaining the threshold segmented image I_out.
Step 4. Determine the seed point (xi,yi) : a pixel with a gray value of 255 is considered the seed point
for the region growing algorithm.
Step 5. I_filter, (xi,yi) , and T are used as input
param-eters for region growing: calculate the gray value of the eight neighboring pixels (xi,yi)
of each seed point and then calculate the averaged value of the pixel gray value in the expanded area. Finally, obtain the minimum value of each seed point min.
Step 6. For each seed point (xi,yi) , if min < T, the pixel
is added to the expanded pixel queue, and the pixel value is set to 255; otherwise, the region growing stops, and the mask is obtained.
Step 7. Repeat (5)–(6), individually growing three regions of R, G, and B to obtain the mask for each channel.
Step 8. Each channel mask is merged to obtain the color mask of the image to be calibrated Mmask
.
Automatic identification and calibration of earth layer flaking deterioration based on the TS‑RG algorithm
After calibrating for damage to the paint layer of a mural, the most critical task is to identify and calibrate more com-plex earth layer deterioration. It is impossible to accurately calibrate the threshold segmentation based on the bright-ness characteristics used in the calibration of the mural paint layer previously described. Therefore, it is necessary to comprehensively analyze the chroma, saturation, color, and other characteristics of the flaking region and then use the proposed TS-RG algorithm to achieve calibration. The process underlying the automatic calibration method for mural earth layer diseases based on the TS-RG algorithm is shown in Fig. 5.
(1) Color mask For the earth layer flaking issue, the exposed part of the mural is the supporting component. The support for temple murals in the Song Dynasty was mostly walls, and the surface was mainly mud, resulting in Fig. 3 Earth layer and paint layer luminance histogram. a Paint layer image. b Paint layer luminance histogram. c Earth layer image. d Earth
the majority of the color in the flaking area to appear light yellow. Therefore, the color range of the flaking area can be set as follows:
where Ir , Ig , and Ib represent the red, green, and blue components, respectively.
The TS-RG algorithm is used to extract the color mask from the flaking area of the earth layer in the mural as follows:
Step 1. Use a 3 × 3 window to perform median filter-ing on the three channels, i.e., R, G, and B. Step 2. Traverse the image to find the point that
sat-isfies Eq. (2) and calculate the position of the point in the image (xi,yi).
Step 3 According to Eq. (3), calculate the regional growth and stopping criterion for the flaking area of the earth layer in the mural.
In Eq. (3), M=
N i=1fi(m,n)
N (N is the number
of expanded pixel points) represents the aver-age pixel value of the expanded area, fk(m,n)
represents the values in the 8 directions near the pixel, and τ is the threshold value of the regional growth.
The histogram analysis of multiple images with flaking regions found that the variation range of the peak in the R channel is 0–0.1132. Thus, τr takes on the value of 0.1132; simulta-neously, τg and τb take on values of 0.0938 and 0.0899, respectively.
Step 4 Use the point obtained in Step 2 as a grow-ing point and τr,τg , and τb as the thresholds for region growing in each channel to obtain the masks Rmask , Gmask , and Bmask per
chan-nel. Using Eq. (4), the mask of each channel is calculated, and the final color mask Hmask is
obtained
(2) Chroma mask The color mask alone is not sufficient to accurately calibrate the flaking area of the earth layer. Due to impurities other than mud in these supporting components, it is impossible to accurately calibrate these (2)
183≤Ir ≤200 159≤Ig≤176
128≤Ib≤146
(3)
fk(m,n)−M
min≤τ, k=1, 2,. . ., 8
(4) Hmask =Rmask⊕Gmask⊕Bmask
Fig. 4 TS-RG algorithm process
damaged areas using only color masks. Therefore, for murals where color image features can be fully utilized, the color, saturation and other features are introduced to calibrate these damaged areas. The YCrCb color space has the characteristics of discreteness, separates bright-ness and chromaticity and is more suitable for color analysis than RGB space. Therefore, when obtaining the chroma mask of the mural image, this paper first con-verts the color space of the mural from the RGB space to the YCrCb color space according to Eq. (5).
Then, the flaking area is identified and calibrated because the range of the chroma distribution Cb , Cr dif-fers according to the flaking area and perfect area. Simi-larly, a group of images that only contain an earth layer flaking area and intact images are analyzed based on their chromaticity histograms and threshold values, as shown in Fig. 6.
Several experiments show that when the values of Cr and Cb are 142 and 118, respectively, the flaking and intact areas can be separated. Thus, these values are used as thresholds for the chrominance mask τcr and
τcb . Assume that the image to be calibrated is fbi . The (5)
Y Cb
Cr
=
65.481 128.553 24.966 −39.797−74.203 112
112 −93.786 −18.214
×
R G G
+
16 128 128
chromaticity is denoted by Cbi and Cri . Then, fbi can be used to obtain the chroma mask Cmask:
(3) Saturation mask The hue, saturation, and value (HSV) space can intuitively express the shades and vivid-ness of colors and facilitate comparisons between colors [27]. When obtaining the saturation mask, this work first converts the image to be calibrated from the RGB space to the HSV space and then uses the same method as that used for the chroma mask to determine a saturation threshold of the image of 0.2012. This method can sepa-rate the flaking area from the intact area. According to Eq. (7), this method calculates the saturation mask Smask of the mural image:
(4) Mask fusion and flaking area calibration Since only the chroma or saturation is used to obtain the mask of the flaking area, there will be an excessive number of calibration areas. The intact areas with similar chroma, saturation, and threshold values are also calibrated. How-ever, the color features alone cannot be used to calibrate areas where the grayscale of the flaking area changes
(6) Cmask =
255, τcb≤Cbi∧τcr≤ri
0, other
(7)
Smask =
255, Si< τs
0, Si> τs
significantly. Therefore, by considering the information of at least two colors, chrominance, and saturation masks, the calibration accuracy improves. In this paper, accord-ing to Eq. (8), the extracted color, chrominance, and sat-uration masks Hmask , Cmask , and Smask are calculated to obtain the mask of the final flaking area Mmask.
Then, the mask is added to the original image accord-ing to Eq. 9 to automatically calibrate the flakaccord-ing area.
Experimental design
This article takes the temple murals from the Song Dynasty in Kaihua Temple as the research object. The simulation experiment is based on the Matlab2016 plat-form on a Windows system with the following hard-ware environment: Intel(R) Core(TM) i5-4570 CPU @ 3.20 GHz processor, 4 GB memory and 500 G hard disk. Aiming to investigate two different degrees of flaking deterioration and the methods in references [15] and [16], these experiments were compared from several perspec-tives, including calibration effects, calibration errors, and noise calibration errors. The experiment was conducted on a mural image database consisting of 100 images with a resolution of 2600 × 2600 (30 pieces of murals with flaking deterioration in the paint layer and 70 pieces of murals with flaking deterioration in the earth layer). Before the experiment, all 100 experimental images were manually calibrated with respect to the damaged area. Each image was calibrated by several experts from the Wudang Mountain Ancient Culture Research Centre, who were not aware of the purpose of the current study. When variations occurred, the final calibration outcomes were determined according to the principle of the minor-ity subordinate to the majorminor-ity.
To accurately evaluate the proposed algorithm perfor-mance, this paper first verifies the calibration effect. For relatively complex earth layer deterioration calibrations, this paper also uses the leave-one-out strategy [28] to separate sample images and test images, i.e., a randomly selected mural image is used as the test image, and the remaining 69 images form the sample set. The calibration area of the test image is calculated by the autocalibration algorithm of the earth layer flaking deterioration based on the TS-RG algorithm. The algorithm can ultimately be used to obtain the earth layer flaking deterioration area of all 70 mural images. We calculated the Euclidean dis-tance between the center of the flaking deterioration area calibrated by this method and the center of the flaking (8)
Mmask=Hmask⊗Cmask⊕Hmask⊗Smask⊕Cmask⊗Smask
(9)
f =fb⊕Mmask
deterioration area calibrated manually beforehand as a criterion for the performance evaluation of the algorithm.
Results and discussion
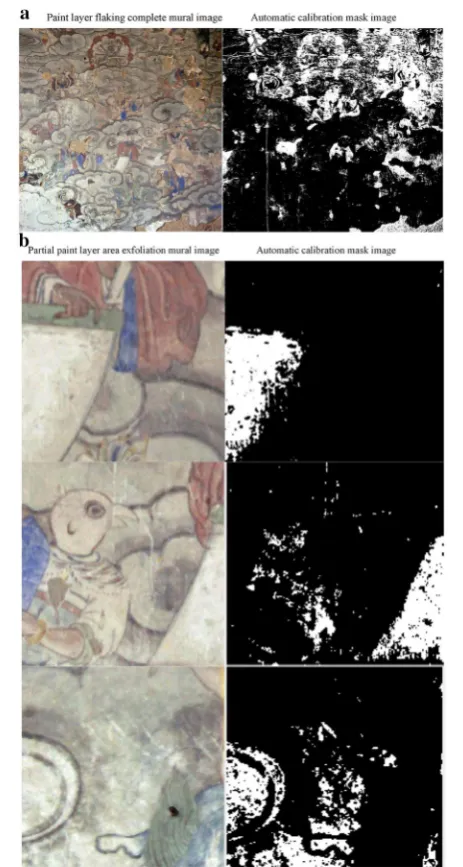
Automatic paint layer flaking calibration experiment The flaking area is more obvious for paint layer flaking deterioration than for earth layer flaking deterioration. This paper selects images of paint layer flaking dete-rioration affecting the temple murals from the Song Dynasty in Kaihua Temple and conducts an experiment
based on the threshold segmentation method. The results are shown in Fig. 7.
From the calibration results in Fig. 7, it can be seen that when the pre-prepared segmentation method is used to calibrate the flaking deterioration in the paint layer, even if there are very small faded areas in the image to be calibrated, the overall calibration result is satisfactory, and incorrectly calibrated areas do not appear, thereby achieving the desired effect.
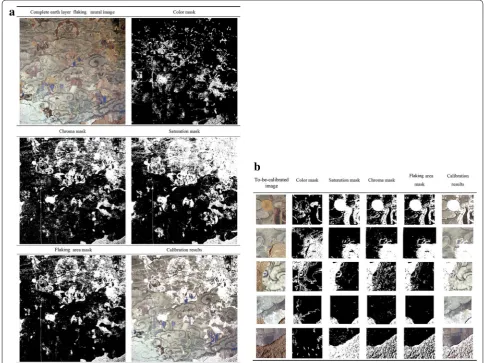
Automatic earth layer flaking calibration experiment The TS-RG algorithm proposed in this paper was used to automatically calibrate the mural images of earth layer flaking deterioration for murals in the Kaihua Temple from the Song Dynasty. The experimental results are shown in Fig. 8.
The automatic calibration results of the TS-RG algo-rithm were compared with the experts’ manual calibra-tion. Based on the different degrees of consistency, user
satisfaction was quantitatively divided into five levels: very dissatisfied (< 50%), dissatisfied (50–70%), basically satisfied (70–85%), satisfied (85–95%), and very satisfied (≥ 95%).
Figure 8 shows that, for the calibration of earth layer flaking deterioration on the mural, only the mask gener-ated by saturation and chromaticity exhibits too much calibration, and the user satisfaction is basically satis-factory. Only the masks generated by the color features calibrate the defects with insufficient calibration, and the user satisfaction level for these masks is not satisfac-tory. Therefore, the use of only a single feature results in a large calibration error, which cannot meet the calibra-tion accuracy and user satisfaccalibra-tion requirements. In this paper, the three masks are fused so that the calibrated flaking area meets at least two requirements of color, saturation and chromaticity. Currently, these flaking area calibration results are more accurate than the single-characteristic calibration results, and the user satisfaction
level is very satisfactory. This method was applied to the experimental image in Fig. 7. In addition, to further verify the effectiveness of the method proposed in this paper, the results with respect to the deterioration of murals from the Song Dynasty in Kaihua Temple were compared with those of the methods of Wang et al. [15] and Li et al. [16], which are commonly used in mural damage calibra-tion. The results are shown in Fig. 9.
The comparison of the calibration results in Fig. 9 clearly shows that, in the method proposed by Wang et al. [15], a nonflaking region appears after the thresh-old segmentation; then, the connected component labeling causes the area outside of the flaking region to be calibrated. There are excessive calibration problems. The calibration method of Li et al. [16] only uses the texture and brightness features for threshold segmenta-tion, and the partially flaking area was not calibrated, resulting in the presence of missing areas in the flaking deterioration calibration. With the TS-RG algorithm proposed in this paper, we first used the color features
for the threshold segmentation to determine the flak-ing seed point; then, we performed region growflak-ing to determine the color mask and subsequently merged this mask with the saturation and chromaticity masks determined by threshold segmentation, thus increasing the calibration result accuracy.
In addition, for comparison with the methods of Wang et al. [15] and Li et al. [16], the autocalibration error tests for 70 samples containing earth layer flaking deteriorations are shown in Table 1.
The data in Table 1 demonstrate that the method used in this paper achieves the smallest average error and error standard deviation. Although the average errors of the three methods are not very large, the error standard devi-ations of the methods by Wang et al. [15] and Li et al. [16] were 3.97 and 2.71, respectively, far higher than the error standard deviation achieved by the method proposed in this paper. This result demonstrates that the algorithm in this paper can be effectively used to calibrate differences between the pixel point errors and average area values. The algorithm is relatively stable and effective at auto-matically calibrating the earth layer flaking deterioration of murals.
To better verify the robustness of the proposed algo-rithm, an experiment was performed to compare 10% salt and pepper noise and Gaussian noise with a mean square error of 10 [29]. The results are shown in Table 2.
The data in Table 2 show that, although the average errors and error standard deviations of the various meth-ods decrease after a certain amount of noise is added, the method proposed in this paper presents the smallest Fig. 9 Comparison of different calibration methods. a Whole width of mural. b Local mural area
Table 1 Comparison of performances of different algorithms
Method Mean error
(pixel) Error standard variance
decrease, and the error standard deviation changes the least. This result further demonstrates the robustness of the calibration method proposed in this paper.
Conclusion
This paper focuses on the flaking problem of mural paintings in Kaihua Temple from the Song Dynasty. Through the in-depth analysis and study of the color, saturation, chroma, brightness and other features of the flaking area, this paper proposes an automatic calibration method based on the TS-RG algorithm for flaking images in murals. In the MATLAB platform, the automatic identification and calibration of flaking deterioration in ancient temple murals were realized, thereby laying the foundation for the virtual restora-tion of murals and playing a supporting role in promot-ing the digital protection of ancient cultural heritage. However, in flaking deteriorations affecting murals, part of the flaking area may contain overlapping flak-ing in the paint layer and the earth layer. In this type of overlapping region, the range of variations of the chroma and brightness of the flaking area is relatively large, and current thresholds cannot accurately cali-brate both characteristics. Therefore, the next step in this research is to further optimize the threshold to improve the calibration accuracy and provide a more accurate repair range for the repair process. This would make the repaired murals look more natural and closer to the true intentions of the mural creators. Moreover, because the mural images selected in this paper were taken under the same illumination, time period and angle conditions, the image shadow and blur problems caused by variations in these factors are not considered. Therefore, the next step will be to consider these issues during the image preprocessing phase and reduce the limitations of the algorithm.
Abbreviations
RGB: red–green–blue; HSV: hue, saturation, and value.
Authors’ contributions
All authors have made contributions to the current work. CJF devised the study plan and led the writing of the article, LYF and CHY conducted the experiment and collected the data. ZQ conducted the analysis, and CJF supervised the whole process and gave constructive advice. All authors read and approved the final manuscript.
Author details
1 School of Computer Science & Technology, Taiyuan University of Science and Technology, Taiyuan 030024, China. 2 Department of Computer Science & Technology, Xinzhou Teachers University, No. 10 Heping West Street, Xin-zhou 034000, China.
Acknowledgements
The authors thank the colleagues who assisted during the work.
Competing interests
The authors declare that they have no competing interests.
Availability of data and materials
The datasets used and/or analyzed in the current study are available from the corresponding author by reasonable request.
Funding
This study was funded by the Natural Science Foundation of Shanxi Province (201701D21059), the Art Disciplinary Project of Shanxi Province (2017F06) and the 13th Five-Year Education Science Project of Shanxi Province (GH-17059).
Publisher’s Note
Springer Nature remains neutral with regard to jurisdictional claims in pub-lished maps and institutional affiliations.
Received: 6 August 2018 Accepted: 21 November 2018
References
1. Nicola M, Aceto M, Gheroldi V, Gobetto R, Chiari G. Egyptian blue in the Castelseprio mural painting cycle. Imaging and evidence of a non-tradi-tional manufacture. J Archaeol Sci Rep. 2018;19:465–75.
2. Zhang HJ, Wang JY, Shanxi Li SF. Mural and cultural relics protection—an interview with Mr. Chai Zejun, an ancient expert. Arch Shanxi. 2012;1:8– 16 (in Chinese).
3. Zhang Z. Informal discussion on Shanxi Murals. Arch Shanxi. 2013;1:12–20
(in Chinese). Table 2 Comparison of performances of different algorithms after adding noise
Method Without noise 10% salt and pepper noise Gaussian noise
with an average square deviation of 10
Method in reference [15]
Mean error (pixels) 2.69 3.04 2.98
Error standard variance 3.97 4.15 4.09
Method in reference [16]
Mean error (pixels) 2.46 2.83 2.70
Error standard variance 2.71 3.11 2.99
Method of this article
Mean error (pixels) 1.91 1.97 1.96
4. Yang XH. An analysis of line-drawing characteristics of the Shuilu Temple Murals in Shanxi. Arch Shanxi. 2016;3:14–6 (in Chinese).
5. Izzo FC, Falchi L, Zendri E, Biscontin G. A study on materials and painting techniques of 1930s Italian mural paintings: two cases by Mario Sironi and Edmondo Bacci in Venice. England: Cambridge Scholar Publishing; 2015. p. 35–51.
6. Sakr AA, Ali MF, Ghaly MF. Discoloration of ancient Egyptian mural paint-ings by streptomyces strains and methods of its removal. Int J Conserv Sci. 2012;3:249–58.
7. Abdel-Haliem MEF, Sakr AA, Ali MF, Ghaly MF, Sohlenkamp C. Characteri-zation of Streptomyces isolates causing colour changes of mural paint-ings in ancient Egyptian tombs. Microbiol Res. 2013;168:428–37. 8. Li J, Zhang H, Fan Z, He X, He S, Sun M, et al. Investigation of the renewed
diseases on murals at Mogao Grottoes. Heritage Science. 2013;1:31–5. 9. Wan X. Prototype of a pigments color chart for the digital conservation of
ancient murals. J Electron Imaging. 2017;26:023013.
10. Zhang Y, Wang J, Liu H, Wang X. A non-destructive approach using MatLab software for morphology analysis of ancient mural deterioration. Stud Conserv. 2016;62:1–9.
11. Ren XK, Deng LK. Murals inpainting based on color clustering image segmentation and the improved FMM algorithm. Comput Eng Sci. 2014;36:298–302 (in Chinese with English abstract).
12. Tang DW, Lu DM, Xu DQ, Yang B. Clustered multiple instance learning for mural image classification. J Image Gr. 2014;19:708–15 (in Chinese with English abstract).
13. Luo W, Sun J, Jiang J, Wang C. Auto-classification of mural disease images using bag of word model. J Comput Inf Syst. 2014;10:1305–14. 14. Li H, Zhang J, Sun J. A visual analytics approach for deterioration risk
analysis of ancient frescoes. J Vis. 2016;19:529–42.
15. Wang K, Wang HQ, Wu M. Virtual restoration method of cracks in mural. Comput Eng Appl. 2014;50:136–9 (in Chinese with English abstract). 16. Li CY. Automatic recognition and virtual restoration of mud spot of the murals. Thesis, Xi`an University of Architecture and Technology, 2015. (in Chinese with English abstract).
17. Wu M, Wang HQ, Li WY. Research on multi-scale detection and image inpainting of Tang dynasty tomb murals. Comput Eng Appl. 2016;52:169– 74 (in Chinese with English abstract).
18. Huang R, Feng W, Fan MY, Guo Q, Sun JZ. Learning multi-path CNN for mural deterioration detection. J Ambient Intell Hum Comput. 2017;27:1–8.
19. Ma J, Son JB, Hazle JD. An improved region growing algorithm for phase correction in MRI. Magn Reson Med. 2016;72:519–29.
20. Ogiela MR, Hachaj T. Automatic segmentation of the carotid artery bifurcation region with a region-growing approach. J Electron Imaging. 2013;22:3029–36.
21. Rajkumar K, Raju G. Automated mammogram segmentation using seed point identification and modified region growing algorithm. Nat Rev Mol Cell Biolog. 2015;10:423–9.
22. Cheng C, Zou C, Liang C, Liu X, Zheng H. Fat-water separation using a region-growing algorithm with self-feeding phasor estimation. Magn Reson Med. 2017;77:2390–401.
23. Liu J, Ma C, Liu C, Qin D, Gu X. An extended maxima transform-based region growing algorithm for convective cell detection on satellite images. Remote Sens Lett. 2014;5:971–80.
24. Liu T, Miao Q, Xu P, Tong Y, Song J, Xia G, et al. Contour-line color layer separation algorithm based on fuzzy clustering and region growing. Comput Geosci. 2016;88:41–53.
25. Asmussen P, Conrad O, Günther A, Kirsch M, Riller U. Semi-automatic seg-mentation of petrographic thin section images using a “seeded-region growing algorithm” with an application to characterize wheathered subarkose sandstone. Comput Geosci. 2015;83:89–99.
26. FabijaSka A. Yarn image segmentation using the region growing algo-rithm. Meas Sci Technol. 2011;22:114024.
27. Chernov V, Alander J, Bochko V. Integer-based accurate conversion between RGB and HSV color spaces. Comput Electr Eng. 2015;46:328–37. 28. Zhang T. Leave-one-out bounds for kernel methods. Neural Comput.
2014;15:1397–437.