R E S E A R C H
Open Access
Tracking of accelerometry-measured physical
activity during childhood: ICAD pooled analysis
Soyang Kwon
1*Kathleen F Janz
2,3and on behalf of the ICAD collaborators
Abstract
Background:Understanding of physical activity (PA) tracking during childhood is important to predict PA
behaviors and design appropriate interventions. We compared tracking of PA according to PA level and type of day (weekday/weekend) in a pool of five children’s cohort studies.
Methods:Data from ALSPAC, CLAN, Iowa Bone Development Study, HEAPS, PEACH were extracted from the International Children’s Accelerometry Database (ICAD), resulting in 5,016 participants with age, gender, and accelerometry data at both baseline and follow-up (mean age: 10.3 years at baseline, 12.5 years at follow-up). Daily minutes spent in moderate- and vigorous-intensity PA (MVPA) and vigorous-intensity PA (VPA) was categorized into quintiles. Multinomial logistic regression models were fit to predict follow-up (M)VPA from baseline (M)VPA
(reference: 20-<80%tile), age at follow-up, and follow-up duration.
Results:For the weekday, VPA tracking for boys with high baseline VPA was higher than boys with low baseline VPA (ORs: 3.9 [95% CI: 3.1, 5.0] vs. 2.1 [95% CI: 1.6, 2.6]). Among girls, high VPA was less stable when compared low VPA (ORs: 1.8 [95% CI: 1.4, 2.2] vs. 2.6 [95% CI: 2.1, 3.2]). The pattern was similar for MVPA among girls (ORs: 1.6 [95% CI: 1.2, 2.0] vs. 2.8 [95% CI: 2.3, 3.6]). Overall, tracking was lower for the weekend.
Conclusions:PA tracking was higher on the weekday than the weekend, and among inactive girls than active girls. The PA“routine”of weekdays should be used to help children establish healthy PA patterns. Supports for PA increase and maintenance of girls are needed.
Keywords:Stability, Objective measure, Exercise, Adolescents, Longitudinal
Background
Although the absolute level of physical activity (PA) decreases during childhood and adolescence [1], PA behaviors are presumed to be habitual. That is, children have a tendency to maintain their rank of PA within a group over time. This phenomenon is known as tracking [2,3]. Tracking of low levels of PA has deleterious health implications, e.g., the chronic effects of low PA contrib-ute to an increased risk of obesity and poor cardiometa-bolic profiles [4,5]. Whereas, tracking of high levels of PA is associated with metabolic health benefits presum-ably due to the accumulated effects of PA. Understand-ing of PA trackUnderstand-ing durUnderstand-ing childhood is important to predict PA behaviors and design PA interventions. From a public health perspective, PA interventions should be
designed to “untrack” low PA [6] and support tracking of high PA. Evidence on that a PA lifestyle is sustainable from childhood to adolescence supports PA promotion interventions for young children and comprehensive K-12 school physical education aimed at an active lifestyle.
A review by Telama [7] on tracking of PA suggested low to moderate tracking during childhood and adolescence. However, most of the reviewed studies used subjective mea-sures or a small sample size, both of which limited the investigators’ ability to examine specific characteristics of PA. PA patterns are likely to differ based on their social context (e.g., school vs. home) or type of day (weekday vs. weekend) [8]. Yet, these attributes are rarely considered in the tracking studies. Furthermore, most tracking studies have examined overall tracking, and few have focused on children with low-levels of PA who are at a great risk of poor metabolic health. In this current study, we conducted a pooled analysis using accelerometry-measured PA data from five cohort studies to determine whether the * Correspondence:[email protected]
1
Consortium to Lower Obesity in Chicago Children, Children’s Memorial Hospital, 2300 Children's Plaza, Box #157, Chicago, IL 60614, USA Full list of author information is available at the end of the article
magnitude of PA tracking differs between 1) weekday and weekend and 2) low-active and high-active children.
Methods Study sample
Secondary data analysis was conducted using the Inter-national Children’s Accelerometry Database (ICAD). The ICAD is an archive of anonymized ActiGraph accel-erometry data, predictors of PA, and/or associated phenotypic and socio-demographic data from 20 studies of 3 to 18 year-old children worldwide. Detailed infor-mation on the design and protocols of the ICAD project can be found elsewhere [9]. For the current analysis, we extracted data of seven cohort studies which had col-lected accelerometry data at≥2 time-points (waves) from the ICAD: Avon Longitudinal Study of Parents and Children (ALSPAC), UK; Children Living in Active Neighourhoods (CLAN), Australia; Danish European Youth Heart Study (EYHS), Denmark; Healthy Eating and Play Study (HEAPS), Australia; Iowa Bone Develop-ment Study (IBDS), US; Personal and EnvironDevelop-mental Associations with Children’s Health (PEACH), UK; and Portuguese EYHS, Portugal. The CLAN had three waves (median age: 10.9 year at wave 1, 13.9 years at wave 2, and 15.6 years at wave 3) and the IBDS had four waves (median age: 5.6 years at wave 1, 8.6 year at wave 2, 11.0 years at wave 3, and 13.0 years at wave 4). To align the median age and the age range with other study sam-ples, data from waves 1 and 2 for the CLAN and from waves 3 and 4 for the IBDS were included in this report. While the Danish and Portugal EYHS had a six-year follow-up period, the other five studies had a follow-up period of 1–3 years; therefore, we excluded EYHS data and focused on short-term tracking. Study designs and data collection procedures have previously been described for individual studies: ALSPAC [10], CLAN [11], IBDS [12], HEAPS [13], and PEACH [14]. Because the ICAD dataset is anonymous data source, Human Subject Com-mittee did not review this pooled analysis.
Accelerometry data reduction
The data reduction process from raw ActiGraph data was performed by the ICAD group [9]. All raw data were analyzed using KineSoft version 3.3.20 (KineSoft, Saskatchewan, Canada; www.kinesoft.org). All accelero-metry files from participating study groups were reinte-grated to 60 second epochs. If a period of 60 minutes of consecutive zeros, allowing for 2 minutes of non-zero interruptions, was encountered anywhere in the data array, accelerometers were considered not worn and the data were not analyzed.
The inclusion criteria for accelerometry data for this report were a valid wear time of≥10 hours per day and≥ 3 days at each of baseline and follow-up. Moderate
intensity was defined as 2,296 to 4,011 accelerometer counts per minute [15,16]. Vigorous intensity was defined as≥4,012 accelerometer counts per minute [15,16]. Daily minutes spent in moderate- to vigorous intensity PA (MVPA—minutes/day) and vigorous-intensity PA (VPA—minutes/day) were the PAmeasures.
Statistical analysis
All analyses were performed using the SAS 9.2 version (Cary, NC). Data analysis included participants with age, gender, and valid accelerometry data at both base-line and follow-up. If MVPA accelerometry data were>6 hours/day, the individual was considered as an outlier and excluded in the data analysis.
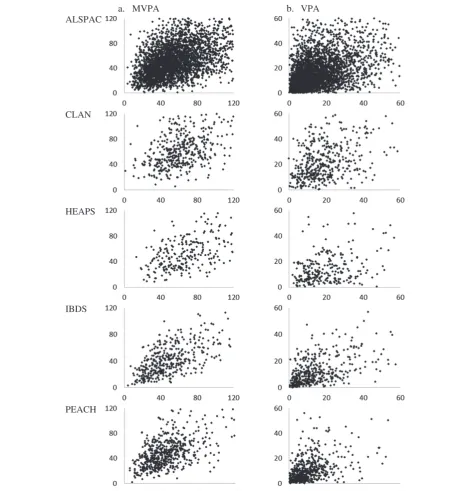
Study-specific analysis To determine if a pooled
anal-ysis was appropriate, descriptive analyses of PA and tracking levels were performed for individual studies. Scatter plots of follow-up PA outcome over baseline PA outcome were examined. Although median MVPA and VPA varied across the studies (Table 1), the relationship between baseline and follow-up PA outcomes were simi-lar (Figure 1). The overall homogeneity in the relation-ship indicated that a pooled analysis was appropriate. However, because the distribution of PA outcomes somewhat varied across the studies and waves, we used study- and wave-specific cut-points to categorize PA outcomes in pooled analysis.
Pooled analysis Each study was weighted based on its
sample size, so that each study contributed equally to the pooled analysis. The descriptive analyses for acceler-ometer outcomes were conducted stratified by gender, wave, and the type of day (weekday/weekend). Categor-ical variables of MVPA and VPA were created based on study-, wave-, and gender-specific quintile cut-points of daily minutes of MVPA and VPA. For type of day-specific analysis, quintile cut-points for each of weekday and weekend were used. This approach allowed an indi-vidual participant to be assigned into different rank categories of MVPA and VPA for weekday/weekend combined, weekday, and weekend.
Weighted kappa coefficients were estimated for measur-ing agreement of baseline and follow-up quintile categor-ies for each of MVPA and VPA [17]. Due to the absence of a criterion-based cut-point for low accelerometry-determined PA, the lowest quintile of MVPA was consid-ered low MVPA (inactive). The highest quintile of MVPA was regarded as high MVPA (active). The lowest quintile of VPA was considered as low VPA, and the highest quin-tile as high VPA.
Table 1 Characteristics of participants by cohort studies
Avon Longitudinal Study of Parents and Children (ALSPAC)
Children Living in Active Neighourhoods (CLAN)
Healthy Eating and Play Study (HEAPS)
Iowa Bone Development Study (IBDS)
Personal and Environmental Associations with Children’s Health (PEACH)
Country United Kingdom Australia Australia United States United Kingdom
Source population Birth cohort recruited from a Bristol health district
Students in Melbourne public schools
Students in Melbourne public and catholic schools
Birth cohort recruited from Iowa hospitals
Students in Bristol public schools
Accelerometry data files,a follow-up/baseline, n (%)
4102/6085 (67%) 511/1162 (44%) 327/1390 (24%) 456/528 (86%) 889/1269 (70%)
Sample,bn 3324 444 259 415 579
Compliance rate,c% 81 87 79 91 65
Gender
Boys, % 46.8 47.5 52.1 50.1 41.6
Girls, % 53.2 52.5 47.9 49.9 58.4
Data collection months
Baseline All Jul-Dec Feb-Nov Sep-Nov Sep-Jul
Follow-up All Jul-Nov May-Nov Sep-Nov Oct-Jul
Median (interquartile)
Follow-up duration, years 2.1 (2.0, 2.3) 3.0 (2.9, 3.0) 3.0 (3.0, 3.1) 2.0 (2.0, 2.0) 1.1 (1.0, 1.1)
Ages, years
Baseline 11.7 (11.6, 11.8) 10.9 (6.3, 11.6) 6.4 (5.8, 10.9) 11.0 (10.9, 11.2) 10.9 (10.6, 11.2)
Follow-up 13.8 (13.8, 13.9) 13.9 (9.2, 14.6) 9.6 (9.0, 13.9) 13.0 (12.9, 13.2) 12.0 (11.7, 12.3)
Height, m
Baseline 1.50 (1.46, 1.55) 1.42 (1.20, 1.51) 1.24 (1.16, 1.44) 1.49 (1.43, 1.54) 1.45 (1.40, 1.50)
Follow-up 1.63 (1.58, 1.68) 1.60 (1.39, 1.68) 1.44 (1.34, 1.62) 1.62 (1.56, 1.66) 1.51 (1.46, 1.57)
Weight, kg
Baseline 41.4 (36.2, 48.6) 35.5 (23.7, 43.8) 27.0 (21.7, 37.7) 41.8 (35.2, 51.0) 37.0 (33.0, 44.0)
Follow-up 52.6 (46.8, 60.2) 51.1 (35.3, 61.1) 41.0 (31.7, 53.6) 53.7 (45.4, 64.1) 42.8 (37.6, 50.8)
Accelerometer wear days
Baseline 7 (6, 7) 6 (5, 6) 5 (4, 6) 5 (4, 5) 5 (4, 6)
Follow-up 6 (5, 7) 6 (5, 6) 5 (4, 6) 5 (4, 5) 5 (4, 6)
Accelerometer wear time, hours/day
Baseline 13.3 (12.8, 13.8) 13.1 (12.4, 13.9) 12.7 (12.0, 13.5) 12.8 (12.5, 13.5) 13.0 (12.4, 13.6)
Follow-up 13.5 (12.8, 14.1) 13.6 (12.9, 14.2) 13.2 (12.4, 13.9) 13.1 (12.6, 13.8) 13.3 (12.6, 14.0)
MVPA, minutes/day
Baseline 52.3 (37.1, 70.9) 61.2 (47.7, 78.2) 67.4 (48.8, 88.7) 45.6 (32.6, 63.8) 43.3 (30.9, 57.7)
Follow-up 48.5 (33.3, 68.8) 59.1 (43.1, 79.0) 49.0 (33.8, 68.7) 40.0 (25.2, 57.3) 45.5 (32.2, 62.1)
VPA, minutes/day
Baseline 13.0 (7.6, 22.1) 17.2 (11.0, 26.0) 17.6 (10.8, 28.0) 12.4 (6.4, 22.6) 8.2 (4.5, 14.0)
Follow-up 14.0 (7.2, 24.4) 19.3 (11.4, 33.0) 11.3 (6.0, 19.2) 10.2 (5.0, 18.3) 8.0 (3.8, 14.2)
MVPA, moderate- to vigorous-intensity physical activity; VPA, vigorous-intensity physical activity.
a
The number of accelerometry data files at follow-up was obtained from the number of participants who had accelerometry data files at follow-up among those who had accelerometry data files at baseline in the ICAD dataset.
b
Sample size was the number of participants who had age, gender, and valid accelerometry data (≥10 hours/day and≥3 wear days) at both baseline and follow-up.
c
duration (years; continuous), MVPA at baseline (<20%tile, 20 to<80%tile, and≥80%tile; reference group: 20 to<80% tile). The dependent variable was MVPA at follow-up (<20%tile, 20 to <80%tile, and ≥80%tile; reference group: 20 to <80%tile). Shift to high or low PA of the 20 to <80%tile group was considered as neutral and served as the reference. Odds ratios (ORs) and 95% confidence inter-vals (CIs) were obtained from the models. The modeling
was repeated for VPA as well as stratified by type of day. Biological maturity was not considered because accounting for differences in the timing of biological maturity has been reported to have little effect on tracking PA [18].
Results
Excluding 50 individuals as outliers (41 individuals for ALSPAC, 7 individuals for CLAN, and 2 individuals for
a. MVPA b. VPA
ALSPAC
CLAN
HEAPS
IBDS
PEACH
HEAPS), the final data analysis included 5,021 partici-pants. Table 1 presents characteristics of participants of the five cohort studies. The original participation rates and loss to follow-up for each study were not available. However, based on accelerometry data files within the ICAD dataset, attrition and compliance rates (defined as the number of participants who had valid accelerometry data divided by the number of those who had accelero-metry data files at both baseline and follow-up) are pre-sented in Table 1. The race information for the CLAN and HEAPS was not available. Most participants in the other studies were Caucasian—96% of the participants in the ALSPAC, 95% in the IBDS, and 88% in the PEACH.
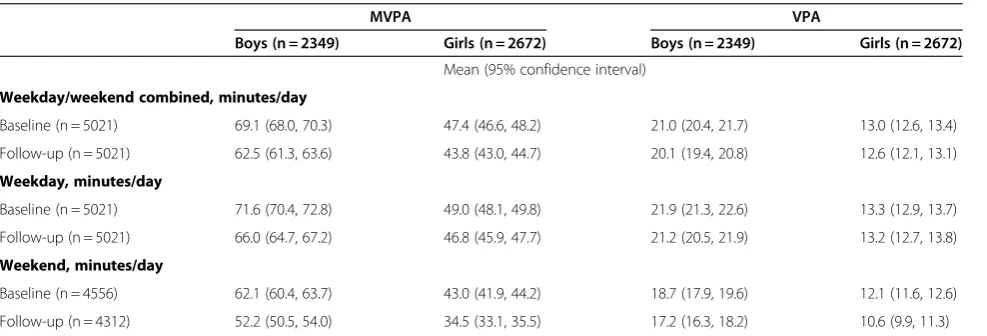
In a pooled sample, the mean age was 10.3 years (95% CI: 10.2, 10.3) at baseline and 12.5 years (95% CI: 12.5, 12.6) at follow-up. The mean follow-up duration was 2.1 years (95% CI: 2.1, 2.1). On average, girls engaged in approximately 20 minutes/day less MVPA than boys (P<0.01; Table 2). Compared weekdays, MVPA and VPA were lower on weekends in boys and girls (Ps<0.05).
Overall tracking of PA was examined using weighted Kappa statistics. Weighted Kappa coefficients showed fair agreement between baseline and follow-up in MVPA and VPA (Table 3). Compared to weekdays, weighted Kappa coefficients for weekends were lower.
The proportion staying in the same rank category of MVPA at follow-up was similar for active (≥ 80%tile of MVPA at baseline) and inactive (<20%tile) children. Ap-proximately 44% of boys and 40% of girls in low MVPA at baseline stayed inactive at follow-up. Approximately 41% of boys and 38% of girls in high MVPA at baseline fell into high MVPA at follow-up. The same proportion (17.5%) of the 20 to<80%tile group of MVPA at baseline changed to high MVPA or low MVPA at follow-up. However, the proportion staying in the same rank cat-egory of VPA at follow-up for children was somewhat
gender-specific. Approximately 37% of each of boys and girls in low VPA at baseline had low VPA at follow-up, while approximately 45% of boys and 34% of girls in high VPA at baseline had high VPA at follow-up.
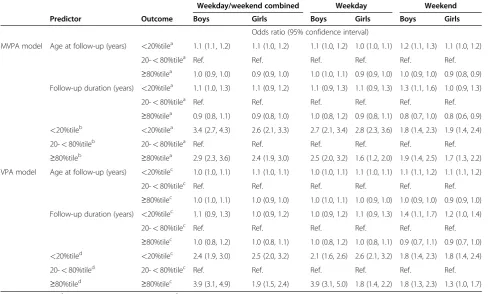
Table 4 presents adjusted ORs from the multinomial logistic regression models. Type of day-specific analysis indicated that weekday tracking was higher compared to weekend tracking. During the weekdays, active girls were less likely to stay in the same rank category when compared to inactive girls, active boys, or inactive boys (Ps<0.05). When compared to boys within the 20 to <80%tile of VPA at baseline, VPA tracking for boys with high baseline VPA was higher than boys with low base-line VPA over 1–3 years (ORs: 3.9 [95% CI: 3.1, 5.0] vs. 2.1 [95% CI: 1.6, 2.6]). In contrast to boys, among girls, high VPA was less stable when compared low VPA (ORs: 1.8 [95% CI: 1.4, 2.2] vs. 2.6 [95% CI: 2.1, 3.2]). The weekend tracking was statistically significant, but low, for both boys and girls, and particularly for girls with high VPA (OR: 1.3 [95% CI: 1.0 vs. 1.7]).
The confounding effects of age and follow-up duration were also presented in Table 4. In general, age was posi-tively associated with being low PA. A longer follow-up duration was significantly associated with being low VPA at follow-up on weekend.
Discussion
Using a large pooled sample of children and objectively measured PA data, this study compared the extent of PA tracking between active and inactive groups of children on weekdays and weekends during the behaviorally-important transition period of late childhood to early adolescence. Our large sample size allowed us to stratify the data by gender, type of day, and level of PA while maintaining sufficient study power. However, there are limitations to our work. For example, we were not able
Table 2 Means of physical activity levels. Pooled analysis
MVPA VPA
Boys (n = 2349) Girls (n = 2672) Boys (n = 2349) Girls (n = 2672)
Mean (95% confidence interval)
Weekday/weekend combined, minutes/day
Baseline (n = 5021) 69.1 (68.0, 70.3) 47.4 (46.6, 48.2) 21.0 (20.4, 21.7) 13.0 (12.6, 13.4)
Follow-up (n = 5021) 62.5 (61.3, 63.6) 43.8 (43.0, 44.7) 20.1 (19.4, 20.8) 12.6 (12.1, 13.1)
Weekday, minutes/day
Baseline (n = 5021) 71.6 (70.4, 72.8) 49.0 (48.1, 49.8) 21.9 (21.3, 22.6) 13.3 (12.9, 13.7)
Follow-up (n = 5021) 66.0 (64.7, 67.2) 46.8 (45.9, 47.7) 21.2 (20.5, 21.9) 13.2 (12.7, 13.8)
Weekend, minutes/day
Baseline (n = 4556) 62.1 (60.4, 63.7) 43.0 (41.9, 44.2) 18.7 (17.9, 19.6) 12.1 (11.6, 12.6)
Follow-up (n = 4312) 52.2 (50.5, 54.0) 34.5 (33.1, 35.5) 17.2 (16.3, 18.2) 10.6 (9.9, 11.3)
to account for the potential confounding factors such as race/ethnicity, socio-economic status, and seasonal vari-ation [8]. With respect to seasonal varivari-ation, however, investigators for the studies used in our analysis attempted to collect baseline and follow-up PA data dur-ing similar seasons. In addition, the use of a secondary dataset did not allow us to examine original participa-tion rates. A large loss to follow-up might introduce se-lection bias if the extent of PA tracking is different for those who completed PA measurements compared with those who did not. However, additional analysis exclud-ing the CLAN and HEAPS datasets where a majority of
participants with valid accelerometry data at baseline did not have valid data at follow-up revealed consistent find-ings with the current report. These limitations suggest caution when generalizing our study results.
Studies have reported low PA levels of children during weekend days vs. weekdays [8,19]. However, to the best of our knowledge, tracking data contrasting week-end PA to weekweek-end PA have not been previously reported. We found that MVPA and VPA are moderately stable during weekdays, but not stable during weekends. Our results suggest that public health interventions which successfully build PA into the routine of school days may
Table 4 Odds ratios to predict stability of physical activity levels. Pooled analysis
Weekday/weekend combined Weekday Weekend
Predictor Outcome Boys Girls Boys Girls Boys Girls
Odds ratio (95% confidence interval)
MVPA model Age at follow-up (years) <20%tilea 1.1 (1.1, 1.2) 1.1 (1.0, 1.2) 1.1 (1.0, 1.2) 1.0 (1.0, 1.1) 1.2 (1.1, 1.3) 1.1 (1.0, 1.2)
20-<80%tilea Ref. Ref. Ref. Ref. Ref. Ref.
≥80%tilea 1.0 (0.9, 1.0) 0.9 (0.9, 1.0) 1.0 (1.0, 1.1) 0.9 (0.9, 1.0) 1.0 (0.9, 1.0) 0.9 (0.8, 0.9) Follow-up duration (years) <20%tilea 1.1 (1.0, 1.3) 1.1 (0.9, 1.2) 1.1 (0.9, 1.3) 1.1 (0.9, 1.3) 1.3 (1.1, 1.6) 1.0 (0.9, 1.3)
20-<80%tilea Ref. Ref. Ref. Ref. Ref. Ref.
≥80%tilea 0.9 (0.8, 1.1) 0.9 (0.8, 1.0) 1.0 (0.8, 1.2) 0.9 (0.8, 1.1) 0.8 (0.7, 1.0) 0.8 (0.6, 0.9) <20%tileb <20%tilea 3.4 (2.7, 4.3) 2.6 (2.1, 3.3) 2.7 (2.1, 3.4) 2.8 (2.3, 3.6) 1.8 (1.4, 2.3) 1.9 (1.4, 2.4) 20-<80%tileb 20-<80%tilea Ref. Ref. Ref. Ref. Ref. Ref. ≥80%tileb ≥80%tilea 2.9 (2.3, 3.6) 2.4 (1.9, 3.0) 2.5 (2.0, 3.2) 1.6 (1.2, 2.0) 1.9 (1.4, 2.5) 1.7 (1.3, 2.2) VPA model Age at follow-up (years) <20%tilec 1.0 (1.0, 1.1) 1.1 (1.0, 1.1) 1.0 (1.0, 1.1) 1.1 (1.0, 1.1) 1.1 (1.1, 1.2) 1.1 (1.1, 1.2)
20-<80%tilec Ref. Ref. Ref. Ref. Ref. Ref.
≥80%tilec 1.0 (1.0, 1.1) 1.0 (0.9, 1.0) 1.0 (1.0, 1.1) 1.0 (0.9, 1.0) 1.0 (0.9, 1.0) 0.9 (0.9, 1.0) Follow-up duration (years) <20%tilec 1.1 (0.9, 1.3) 1.0 (0.9, 1.2) 1.0 (0.9, 1.2) 1.1 (0.9, 1.3) 1.4 (1.1, 1.7) 1.2 (1.0, 1.4)
20-<80%tilec Ref. Ref. Ref. Ref. Ref. Ref.
≥80%tilec 1.0 (0.8, 1.2) 1.0 (0.8, 1.1) 1.0 (0.8, 1.2) 1.0 (0.8, 1.1) 0.9 (0.7, 1.1) 0.9 (0.7, 1.0) <20%tiled <20%tilec 2.4 (1.9, 3.0) 2.5 (2.0, 3.2) 2.1 (1.6, 2.6) 2.6 (2.1, 3.2) 1.8 (1.4, 2.3) 1.8 (1.4, 2.4) 20-<80%tiled 20-<80%tilec Ref. Ref. Ref. Ref. Ref. Ref. ≥80%tiled ≥80%tilec 3.9 (3.1, 4.9) 1.9 (1.5, 2.4) 3.9 (3.1, 5.0) 1.8 (1.4, 2.2) 1.8 (1.3, 2.3) 1.3 (1.0, 1.7)
a
MVPA at follow-up;bMVPA at baseline;cVPA at follow-up;dVPA at baseline.
MVPA, moderate- to vigorous-intensity physical activity; VPA, vigorous-intensity physical activity. All analyses were weighted based on the sample size of each cohort.
Gender- and type of day-specific multinomial logistic regression model: follow-up [M]VPA (<20%tile, 20-<80%tile, and≥80%tile; reference group: 20-<80% tile) = centered age at follow-up (years) + follow-up duration (years) + baseline [M]VPA (<20%tile, 20-<80%tile, and≥80%tile; reference group: 20-<80%tile). Table 3 Weighted Kappa coefficients for baseline quintiles and follow-up quintiles of physical activity levels. Pooled analysis
MVPA VPA
Boys Girl Boys Girl
Weighted kappa (95% confidence interval)
Weekday/weekend combined 0.28 (0.25, 0.30) 0.25 (0.22, 0.28) 0.27 (0.25, 0.30) 0.23 (0.21, 0.26)
Weekday 0.24 (0.21, 0.27) 0.24 (0.21, 0.26) 0.24 (0.21, 0.27) 0.22 (0.19, 0.24)
Weekend 0.22 (0.19, 0.25) 0.16 (0.13, 0.19) 0.18 (0.15, 0.21) 0.15 (0.12, 0.18)
be able to sustain this behavior pattern as children move into adolescence. Future studies examining the determi-nants of children’s weekday vs. weekend PA are needed.
In our study, the stability of weekday VPA was greater among boys with high VPA vs. boys with low VPA. A comprehensive review of tracking by Malina [20] reported that sport participation tracks more strongly than other PA behavior, which would indirectly support our finding that high VPA in boys tracks better than low VPA. Assuming that sports provide much of the oppor-tunity for weekday VPA, our results suggest that boys are sorted out of organized sport activities early in child-hood possibly due to poor sport-related physical fitness or the inability to cross adolescent social circles.
Our findings on the PA tracking extent for girls are in an unhealthy direction. During weekdays, girls with low levels of PA remained inactive, while girls with high PA were more likely to change their PA behavior and became less active (relative to peers). Tracking of low PA and “untracking” of high PA are worrisome, given the known precipitous decline in PA by the great majority of girls during puberty. Our findings are somewhat incon-sistent with Baggett et al. study [21], which reported similar levels of ORs for MVPA tracking (3.3 [95% CI: 2.3, 4.7]) and for inactivity tracking (3.6 [95% CI: 2.6, 5.2]), although it may be inappropriate to directly com-pare the results due to the different reference groups used. Similar to our current report, however, the IBDS investigators have recently shown a distinct (and troub-ling) tracking pattern for girls vs. boys [12]. Using survey data to examine tracking of sedentary behaviors from ages 5 to 13 years, the IBDS team reported that the ORs of playing ≥1 hour/day of video games at ages 8, 11, 13 if children played this amount at age 5 were 1.8 for boys and 3.5 for girls. These data indicate that the tracking of unhealthy PA behavior in girls begins early in childhood and continues into early adolescence [12]. Our finding of tracking of low PA and untracking of high PA in girls suggests a need to identify and target inactive girls early in childhood and to support active girls whose healthy behavior may change. In addition to testing interventions to increase PA in inactive girls, future research should examine the environmental support received by active girls to remain active. Recently, several studies have reported that girls prefer non-competitive PA [22,23]. We suspect that a traditional reliance on sports, which become more organized and competitive during adolescence, may be contributing to the low tracking of PA in active girls.
Conclusion
The pooled analysis of five international cohort studies showed that the degree of PA tracking differs by gender and baseline PA levels: high tracking of inactivity among inactive girls and low tracking of PA among active girls.
PA tracking was higher on the weekday than the week-end. The PA “routine” of weekdays should be used to help children establish healthy PA patterns. Interven-tions for untracking inactive children are recommended. Supports for PA increase and maintenance of girls are needed. In addition, behavioral reinforcement and a closer examination of the social environments that support PA may be needed for active girls to stay active over time.
Abbreviations
ALSPAC: Avon Longitudinal Study of Parents and Children; CI: Confidence interval; CLAN: Children Living in Active Neighourhoods; EYHS: European Youth Heart Study; HEAPS: Healthy Eating and Play Study; IBDS: Iowa Bone Development Study; ICAD: International Children’s Accelerometry Database; MVPA: Moderate- to vigorous-intensity physical activity; OR: Odds ratio; PA: Physical activity; PEACH: Personal and Environmental Associations with Children’s Health; VPA: Vigorous-intensity physical activity.
Competing interests
The authors declare that they have no competing interests.
Authors’contributions
SK has made substantial contributions to conception and design, analysis, interpretation of data, and manuscript drafting. KJ has been involved in drafting the manuscript and revising it critically for important intellectual content. A. Ness, MD, Avon Longitudinal Study of Parents and Children (ALSPAC), School of Oral and Dental Sciences, University of Bristol K. F. Janz, PhD, Iowa Bone Development Study, Department of Health and Sports Studies, Department of Epidemiology, University of Iowa, Iowa City A. Cooper, PhD, Personal and Environmental Associations with Children's Health (PEACH), Centre for Exercise, Nutrition and Health Sciences, University of Bristol, Bristol, UK J. Salmon, PhD; Children Living in Active Neigbourhoods (CLAN) and Healthy Eating and Play Study (HEAPS), School of Exercise and Nutrition Sciences, Deakin University, Melbourne, Australia. L.B.Sherar, PhD, School of Sports, Exercise and Health Sciences, Loughborough University, UK U Ekelund, PhD; Department of Sport Medicine, Norwegian School of Sort Science, Oslo, Norway and; 2) MRC Epidemiology Unit, Cambridge, UK.Dale Esliger, PhD, School of Sports, Exercise and Health Sciences, Loughborough University, UK Ashley Cooper, PhD, Centre for Exercise, Nutrition and Health Sciences, School for Policy Studies, University of Bristol, UK Pippa Griew, MSc, School of Sport and Health Sciences, University of Exeter, Exeter, UK,"
Acknowledgements
The ICAD Collaborators include: Ashley Cooper, Ulf Ekelund, Dale Esliger, Pippa Griew, Ken Judge, Andy Ness, Chris Riddoch, Jo Salmon, and Lauren Sherar. We would like to acknowledge the data contribution from the following studies: Avon Longitudinal Study of Parents and Children (ALSPAC), Children Living in Active Neighborhoods (CLAN), Healthy Eating and Play Study (HEAPS), Iowa Bone Development Study, and Personal and Environmental Associations with Children’s Health (PEACH).
The work of Dr. Janz was supported by National Institute of Health [R01-DE09551, R01-DE12101, and UL1RR024979]. The archiving of the data was funded through a National Prevention Research Initiative (http://www.mrc.ac. uk/Ourresearch/Resourceservices/NPRI/index. htm). The funding partners relevant to this award are: British Heart Foundation; Cancer Research UK; Department of Health; Diabetes UK; Economic and Social Research Council; Medical Research Council; Research and Development Office for the Northern Ireland Health and Social Services; Chief Scientist Office; Scottish Executive Health Department; The Stroke Association; Welsh Assembly Government and World Cancer Research Fund.
Author details
Received: 18 January 2012 Accepted: 18 April 2012 Published: 7 June 2012
References
1. Dumith SC, Gigante DP, Domingues MR, Kohl HW:Physical activity change during adolescence: a systematic review and a pooled analysis.Int J Epidemiol2011,40(3):685–698.
2. Foulkes M, Davis C:An index of tracking for longitudinal data.Biometrics 1981,37:439–446.
3. Malina RM:Tracking of physical activity and physical fitness across the lifespan.Research quarterly for exercise and sport1996,67(3 Suppl):S48–S57. 4. Janz KF, Kwon S, Letuchy EM, Eichenberger Gilmore JM, Burns TL, Torner JC,
Willing MC, Levy SM:Sustained effect of early physical activity on body fat mass in older children.American Journal of Preventive Medicine2009,
37(1):35–40.
5. Physical Activity Guidelines Advisory C:Physical activity guidelines advisory committee report. Washington, DC: U.S. Department of Health and Human Services; 2008.
6. Corbin C:The untracking of sedentary living: a call for action.Pediatr Exerc Sci2001,13(1):347–356.
7. Telama R:Tracking of physical activity from childhood to adulthood: a review.Obesity facts2009,2(3):187–195.
8. Kristensen PL, Korsholm L, Møller NC, Wedderkopp N, Andersen LB, Froberg K:Sources of variation in habitual physical activity of children and adolescents: the European youth heart study.Scand J Med Sci Sports 2008,18(3):298–308.
9. Sherar LB, Griew P, Esliger DW, Cooper AR, Ekelund U, Judge K, Riddoch C:
International children's accelerometry database (ICAD): design and methods.BMC Publ Health2011,11:485.
10. Riddoch CJ, Leary SD, Ness AR, Blair SN, Deere K, Mattocks C, Griffiths A:
Davey Smith G, Tilling K: Prospective associations between objective measures of physical activity and fat mass in 12–14year old children: the Avon Longitudinal Study of Parents and Children (ALSPAC).BMJ2009,
339:b4544.
11. Ball K, Cleland VJ, Timperio AF, Salmon J, Crawford DA:Socioeconomic position and children's physical activity and sedentary behaviors: longitudinal findings from the CLAN study.J Phys Act Health2009,
6(3):289–298.
12. Francis SL, Stancel MJ, Sernulka-George FD, Broffitt B, Levy SM, Janz KF:
Tracking of TV and video gaming during childhood: Iowa Bone Development Study.Int J Behav Nutr Phys Act2011,8:100. 13. Hesketh K, Crawford D, Salmon J:Children's television viewing and
objectively measured physical activity: associations with family circumstance.Int J Behav Nutr Phys Act2006,3:36.
14. Griew P, Page A, Thomas S, Hillsdon M, Cooper AR:The school effect on children's school time physical activity: the PEACH Project.Prev Med 2010,51(3–4):282–286.
15. Evenson KR, Catellier DJ, Gill K, Ondrak KS, McMurray RG:Calibration of two objective measures of physical activity for children. J Sports Sci2008,
26(14):1-9.
16. Trost SG, Loprinzi PD, Moore R, Pfeiffer KA:Comparison of Accelerometer Cut-points for Predicting Activity Intensity in Youth.Med Sci Sports Exerc 2011,43(7):1360-8.
17. Schneiderman E, Kowalski C, Ten Have T:A GAUSS program for computing an index of tracking from longitudinal observation.Am J Human Biol 1990,2:475–490.
18. Erlandson MC, Sherar LB, Mosewich AD, Kowalski KC, Bailey DA, Baxter-Jones AD:Does controlling for biological maturity improve physical activity tracking?Med Sci Sports Exerc2011,43(5):800–807. 19. Moller NC, Kristensen PL, Wedderkopp N, Andersen LB, Froberg K:
Objectively measured habitual physical activity in 1997/1998 vs 2003/ 2004 in Danish children: the European Youth Heart Study.Scandinavian journal of medicine & science in sports2009,19(1):19–29.
20. Malina R:Tracking of physical activity across the lifespan, President's Council on Physical Fitness and Sports. vol. 14th edition. Washington, DC: Research Digest Series 3; 2001:3–10.
21. Baggett CD, Stevens J, McMurray RG, Evenson KR, Murray DM, Catellier DJ, He K:Tracking of physical activity and inactivity in middle school girls.
Med Sci Sports Exerc2008,40(11):1916–1922.
22. Sirard JR, Pfeiffer KA, Pate RR:Motivational factors associated with sports program participation in middle school students.J Adolesc Health2006,
38(6):696–703.
23. Casey MM, Eime RM, Payne WR, Harvey JT:Using a socioecological approach to examine participation in sport and physical activity among rural adolescent girls.Qual Health Res2009,19(7):881–893.
doi:10.1186/1479-5868-9-68
Cite this article as:Kwon and Janz:Tracking of accelerometry-measured
physical activity during childhood: ICAD pooled analysis.International Journal of Behavioral Nutrition and Physical Activity20129:68.
Submit your next manuscript to BioMed Central and take full advantage of:
• Convenient online submission
• Thorough peer review
• No space constraints or color figure charges
• Immediate publication on acceptance
• Inclusion in PubMed, CAS, Scopus and Google Scholar
• Research which is freely available for redistribution