Open Access
Research
A new 2D-based method for myocardial velocity strain and strain
rate quantification in a normal adult and paediatric population:
assessment of reference values
C Bussadori*
1, A Moreo
2, M Di Donato
3, B De Chiara
2, D Negura
1,
E Dall'Aglio
1, E Lobiati
2, M Chessa
1, C Arcidiacono
1, JS Dua
1, F Mauri
2and
M Carminati
1Address: 1Pediatric Cardiology and Adult with Congenital Heart Disease Department, IRCCS San Donato Hospital, Milan, Italy, 2Cardiology
Department, Niguarda Ca' Granda Hospital, Milan, Italy and 3Adult Clinical Researches Cardiac Surgery Department, IRCCS San Donato Hospital,
Milan, Italy
Email: C Bussadori* - [email protected]; A Moreo - [email protected]; M Di Donato - [email protected]; B De Chiara - [email protected]; D Negura - [email protected]; E Dall'Aglio - [email protected]; E Lobiati - [email protected]; M Chessa - [email protected]; C Arcidiacono - [email protected]; JS Dua - [email protected];
F Mauri - [email protected]; M Carminati - [email protected] * Corresponding author
Abstract
Background: Recent advances in technology have provided the opportunity for off-line analysis of digital video-clips of two-dimensional (2-D) echocardiographic images.
Commercially available software that follows the motion of cardiac structures during cardiac cycle computes both regional and global velocity, strain, and strain rate (SR).
The present study aims to evaluate the clinical applicability of the software based on the tracking algorithm feature (studied for cardiology purposes) and to derive the reference values for longitudinal and circumferential strain and SR of the left ventricle in a normal population of children and young adults.
Methods: 45 healthy volunteers (30 adults: 19 male, 11 female, mean age 37 ± 6 years; 15 children: 8 male, 7 female, mean age 8 ± 2 years) underwent transthoracic echocardiographic examination; 2D cine-loops recordings of apical 4-four 4-chamber (4C) and 2-chamber (2C) views and short axis views were stored for off-line analysis.
Computer analyses were performed using specific software relying on the algorithm of optical flow analysis, specifically designed to track the endocardial border, installed on a Windows™ based computer workstation. Inter and intra-observer variability was assessed.
Results: The feasibility of measurements obtained with tissue tracking system was higher in apical view (100% for systolic events; 64% for diastolic events) than in short axis view (70% for systolic events; 52% for diastolic events). Longitudinal systolic velocity decreased from base to apex in all subjects (5.22 ± 1.01 vs. 1.20 ± 0.88; p < 0.0001). Longitudinal strain and SR significantly increased from base to apex in all subjects (-12.95 ± 6.79 vs. -14.87 ± 6.78; p = 0.002; -0.72 ± 0.39 vs. -0.94 ± 0.48, p = 0.0001, respectively). Similarly, circumferential strain and SR increased from base to
Published: 13 February 2009
Cardiovascular Ultrasound 2009, 7:8 doi:10.1186/1476-7120-7-8
Received: 30 December 2008 Accepted: 13 February 2009
This article is available from: http://www.cardiovascularultrasound.com/content/7/1/8
© 2009 Bussadori et al; licensee BioMed Central Ltd.
apex (-21.32 ± 5.15 vs. -27.02 ± 5.88, p = 0.002; -1.51 ± 0.37 vs. -1.95 ± 0.57, p = 0.003, respectively).
Values of global systolic SR, both longitudinal and circumferential, were significantly higher in children than in adults (-1.3 ± 0.2, vs. -1.11 ± 0.2, p = 0.006; -1.9 ± 0.6 vs. -1.6 ± 0.5, p = 0.0265, respectively). No significant differences in longitudinal and circumferential systolic velocities were identified for any segment when comparing adults with children.
Conclusion: This 2D based tissue tracking system used for computation is reliable and applicable in adults and children particularly for systolic events. Measured with this technology, we have established reference values for myocardial velocity, Strain and SR for both young adults and children.
Background
Accurate assessment of global and regional left ventricular function is essential for the evaluation and management of patients with heart disease. Recent developments have improved cardiac function quantification and it seems that both magnitude and temporal sequence of tissue deformation can provide additional information in known or suspected heart disease [1-3].
Tissue Doppler Imaging (TDI) has been extensively applied in assessing and quantifying regional myocardial contractility [4-6] and validated against sonomicrometry and magnetic resonance imaging (MRI) [7]. Furthermore, simultaneous recording of myocardial velocities allows estimation of Strain (ε) and Strain Rate (SR). In fact, using TDI based technology, SR is calculated as (V1–V2)/L where L is the distance between the two points whose velocities are measured and Strain (ε) is obtained by tem-poral integration of SR. Strain provides a dimensionless measure of the total deformation the myocardium under-goes during contraction and is expressed as percentage while SR is expressed in s-1 [8].
However, TDI being a Doppler based technique, its rou-tine clinical use is limited by technical issues such as angle, signal noise and measure variability. When the angle between the velocity direction and the ultrasound beam is > 20°, the real velocity is underestimated. Since a correct alignment is not always possible, due to ventricu-lar geometry, TDI derived measures will lose validity espe-cially at the apical segments [9]. Recently, improvements in 2D echocardiographic image resolution have enabled detection of tissue pixels and tracking of these acoustic markers from frame to frame. The tissue velocity is esti-mated from the local frame-to-frame displacement; the automatic evaluation of the velocity at a point is deter-mined by comparison of the displacement of the image data around that point in two consecutive frames. These methods have been used, in several different formula-tions, in many research fields and fall in the category
known as Optical Flow [8], commonly referred as Speckle Tracking in ultrasound imaging.
Several 2D tissue tracking techniques are currently availa-ble and their difference is based on the type of algorithm employed; the first (and more investigated) method is known as "speckle tracking" [1] and the second one is known as "feature tracking" [10]. In this latter method the software is based on a dedicated algorithm, that follows frame by frame, the endocardial border traced by the oper-ator; actually this processing system is based on a mono-dimensional technology which seems to be more accurate with respect to 2D processing. The present study aims to evaluate the clinical applicability of a specifically designed tissue tracking software: XStrain™ (Esaote, Florence) based on an original and patented concept [European Patent Specification: EP1520517] and to derive reference values for longitudinal and circumferential velocity, ε and SR of the left ventricle in a population of normal children and young adults.
Methods
Study population
Forty-five healthy volunteers (30 adults: 19 male, 11 female, mean age 37 ± 6 years; 15 children: 8 male, 7 female, mean age 8 ± 2 years) were included in the study. Informed written consent and appropriate ethics approval were obtained. All subjects underwent clinical examina-tion, 12-lead ECG recordings and systemic blood pressure recording. Subsequently, they underwent a complete tran-sthoracic echocardiographic examination in left lateral decubitus. The exclusion criteria were: history of hyper-tension, diabetes, coronary artery disease, myocardial inf-arction, stroke, congenital heart disease, acquired valve disease, atrial fibrillation or congestive heart failure.
Echocardiographic study
Florence) equipped with a multi-frequency 2.5–3.5 MHz transducer. 2D harmonic image cine-loops recordings (video clips) of apical 4C and 2C views and short axis views at mitral, papillary muscles and apical levels, with good quality ECG signal and a frame rate between 40–64 fps were acquired and stored for off-line analysis. Off-line computer based analysis of the video clips stored on the Esaote Mylab 50 were performed using XStrain™ software (Esaote, Florence) installed on a Windows™ based com-puter work station. Relying on the algorithm of optical flow analysis specifically designed to track the endocardial border, XStrain™ is a dedicated software that derives lon-gitudinal and circumferential myocardial velocity, ε and SR from the digitized 2D video clips. The endocardial bor-der, drawn by the operator on an arbitrary single frame, is identified as a sequence of points. It is then automatically followed frame by frame by searching (in the greyscale pattern) for each single point, in the neighbourhood of maximum likelihood. For apical views an adaptive con-trol is performed by the system; the concon-trol is based on the spatial coherence of the points with respect to the points fixed by the operator (mitral annulus and apex).
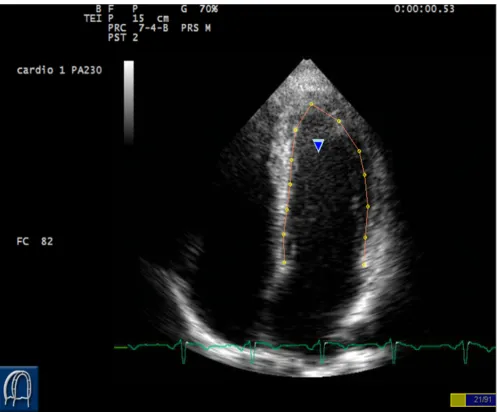
For each point, the velocities are calculated and displayed both as vectors superimposed on the 2D images and as graphs plotted against time; ε and SR displayed for each point are deformation and deformation rate of the seg-ment whose extreme points are the previous and the sub-sequent points with respect to the point analyzed (Figure 1). Since point selection is the most important issue in post processing and requires new skills even for experi-enced cardiologist, inter and intra-observer variability was tested. To this purpose longitudinal Strain and SR were measured in 10 subjects for all six segments, blindly on two separate days by two experienced operators (CB and ED).
For each patient, clip with the best border was chosen and processed as follows: a starting frame was chosen, usually in end diastole when endocardial border is better visible (but this is not mandatory since the algorithm is designed to follow points tracked in any frame). Border tracking of the left ventricle was manually traced by an experienced operator in the recorded clips. In apical 4C and 2C views a total of 13 equidistant points were tracked in order to obtain a subdivision in 6 segments for each view. Points were tracked starting from the septal side of the mitral annulus in the apical 4C view (Figure 2) and three points for each segment were tracked, with the first of each seg-ment being the last of the previous one (except for the first point of the basal septal segment). In the apical 2C view-points are tracked starting from the mitral annulus at the level of the inferior wall.
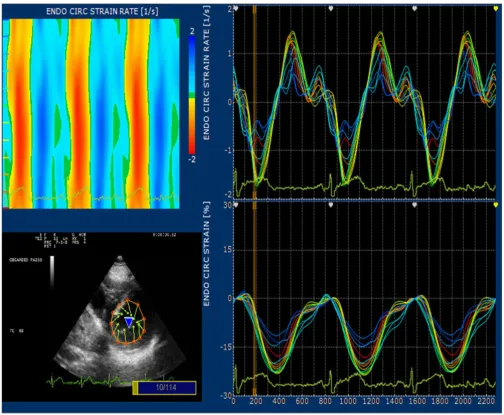
In the short axis at the mitral valve level (Figure 3) the points were tracked from the postero-medial commissure
of the mitral valve, using the same method as that for the apical views (last point of a segment is the first of the fol-lowing). In short axis at the papillary muscle level, starting point was at the postero-medial papillary muscle, and point 8 and 12 were positioned in the internal part of the papillary muscle, at the same level as that of the other dots, in order to follow the same group of myocardial fibres. At the apex, since there are no cardiac anatomical landmarks, the apical short axis was arbitrarily divided in four quadrants drawing two perpendicular lines and posi-tioning the first point aligned with the first point of the previous section.
Velocity, ε, and strain rate graphics were automatically obtained and quantitative data for different parameters were exported by the system into an Excel® spreadsheet.
Statistical analysis
Inter and intra-observer variability was tested using con-cordance correlation coefficient; precision with Pearson correlation coefficient (r) and with Cb as a bias correction factor to measure accuracy [11,12]. Differences between groups or variables were compared using Student's unpaired t-test. Statistical significance was set at a p value < 0.05. The Statistical Package for Social Science (SPSS 13.0 for Microsoft Windows) was used.
Results
Feasibility
The feasibility of obtaining measurements with border tracking system, evaluated in all the 225 stored cine-loops, was higher in the apical long axis view (100% for systolic and 64% for diastolic events) than in the short axis view (70% for systolic and 52% for diastolic events).
Inter and Intra-observer variability
Inter-observer variability between two experienced opera-tors was minimum; Correlation coefficient r = 0.8958, p < 0.0001, 95% Confidence interval for r = 0.8039 to 0.9460.
Intra-observer variability for CB was r = 0.9348, 95% Con-fidence interval for r = 0.8968 to 0.9591, p < 0.0001. Bias correction factor Cb (accuracy) 0.9632.
Normal values
Both longitudinal and circumferential ε showed a signifi-cant increase in the septal wall from base to apex (Figure 5); SR showed similar progression through base to apex (Table 2). In fact, longitudinal ε and SR significantly increased from base to apex in all subjects (-12.95 ± 6.79 vs. -14.87 ± 6.78, p = 0.002; -0.72 ± 0.39 vs. -0.94 ± 0.48, p = 0.0001, respectively). When the segmental increase from base to apex in longitudinal Strain and SR was ana-lysed separately for age groups, the difference was strongly significant in both adults (-15.78 ± 3.63 vs. -24.00 ± 5.87, p = 0.0001 and -0.83 ± 0.21 vs. -1.44 ± 0.37, p = 0.0001) and children (-20.65 ± 4.46 vs. 25.36 ± 6.14, p = 0.0197. -1.16 ± 0.29 vs. -1.66 ± 0.40 p = 0.0004). This significant difference from base to apex was not evident at the lateral
wall in children, nor in adults. Comparing children with adults, longitudinal Strain and SR were significantly higher in children at basal septum (-20.6 ± 4.4 vs. -15.8 ± 3.5, p = 0.0002; -1.2 ± 0.3 vs. -0.8 ± 0.2, p = 0.0001), at basal lateral wall (22.9 ± 3.4 vs. 17.9 ± 5.2, p = 0.0013; -1.3 ± 0.3 vs. -1.0 ± 0.3, p = 0.0072), at mid septum (-20.9 ± 3.9 vs. -17.7 ± 4.1, p = 0.0133; -1.1 ± 0.2 vs. -0.9 ± 0.2, p = 0.0070) and at mid lateral wall (-23.3 ± 4.2 vs. -18.9 ± 4.9, p = 0.0052; -1.34 ± 0.3 vs. -1.0 ± 0.3, p = 0.0027) (Table 2)
Even for circumferential ε and SR there was a significant increase of the values from base to apex calculated as global values for section in all subjects (21.23 ± 5.36 vs.
-Graph with parts of the processing result of an apical four chambers view
Figure 1
28.65 ± 6.72, p = 0.002; -1.59 ± 0.47 vs. -2.11 ± 0.69, p = 0.003, respectively). Global systolic longitudinal Strain was significantly higher in children than in adults (22.18 ± 3.06 vs. -19.05 ± 3.05 p = 0.0020). Global systolic SR, both longitudinal and circumferential, was significantly higher in children than in adults (-1.30 ± 0.20 vs. -1.07 ± 0.19, p = 0.015; -1.83 ± 0.60 vs. -1.67 ± 0.55, p = 0.04, respectively). The differences in longitudinal and circum-ferential Strain and SR between adults and children were more significant for circumferential strain of the apical segments.
Values of global systolic longitudinal and circumferential values of ε and strain rate are reported in Table 3.
Discussion
TDI, it's derivatives, and 2D strain technologies suffer from an intrinsic limitation i.e. they have been put to clin-ical use long before their value has been demonstrated in various clinical settings. Currently, we can only make intra-population comparisons to assess changes induced by treatments that act on strain, strain rate and torsion like resynchronization therapy, drug therapy or surgery. In the near future we will have data on the clinical impact of such measurements and their clinical meaning. These measures actually assess cardiac mechanics and changes induced by loading conditions that are already well known from physiology and pathology point. But their great advantage, once technical accuracy has been
Points positioning
Figure 2
achieved, is that they are easily and non-invasively appli-cable to large cardiac disease population.
The 2D Strain tissue tracking method described as "Fea-ture Tracking" has previously been employed in paediatric [14] and adult cardiology [10,15-17] but to our knowl-edge, a complete derivation of reference values for longi-tudinal and circumferential parameters has not yet been published.
The processing system used in this study is based on a mono-dimensional technology; this seems to be a more accurate system and this hypothesis has been verified in
this study. The "Feature Tracking" system is highly reliable for systolic events and provides data for apical and short axis regions that TDI is unable to provide. This new 2D tis-sue tracking technology overcomes this limitation by ana-lyzing displacement of all the points tracked in two spatial dimensions (along the endocardial border and perpendic-ular to it). This has the advantage of offering a correct strain computation even along curved segments.
Limitations to our study are mostly software related and the fact that the analysis is based on 2D video clips. Any 2D based system that relies on tissue tracking needs good quality images (as young and cooperative subjects can
Graph with parts of the processing result of a short axis view at mitral level
Figure 3
Table 1: Systolic and diastolic values of the longitudinal velocities in adults and children
Apical 4 Chambers View
Systolic Peak Velocity (cm/sec)
Sept.Mit.Ann. Bas Sept Mid Sept Ap sept Ap lat Mid lat Bas Lat Mit Ann LW
Children 4.9 ± 0.6 4.3 ± 0.4 2.9 ± 0.6 1.22 ± 0.6 0.63 ± 0.5 2.3 ± 0.8 4.6 ± 0.8 5.4 ± 0.7
Adults 5.1 ± 1.2 4.4 ± 1.1 3.2 ± 0.98 1.70 ± 0.7 1.02 ± 0.97 2.9 ± 1.9 4.7 ± 1.2 5.5 ± 1.4
P value 0.557 0.624 0.297 0.05 0.147 0.264 0.831 0.939
Diastolic Peak Velocity E (cm/sec)
Children -7.6 ± 0.9 -6.6 ± 0.9 -3.7 ± 1.1 -1.1 ± 0.8 -0.58 ± 0.9 -3.1 ± 1.4 -6.4 ± 1.3 -8.4 ± 1.2
Adults -6.3 ± 1.8 -5.2 ± 1.8 -3.6 ± 1.5 -1.5 ± 0.9 -0.97 ± 0.9 -3.4 ± 1.5 -6.2 ± 1.7 -7.4 ± 1.9
P value 0.0075 0.0058 0.8273 0.1589 0.2070 0.4230 0.7091 0.088
Diastolic Peak Velocity A (cm/sec)
Children -2.5 ± 1.3 -2.1 ± 1.1 -1.5 ± 0.8 -0.4 ± 0.5 -0.1 ± 0.2 -0.57 ± 0.6 -1.8 ± 1.1 -2.3 ± 1.5
Adults -3.9 ± 1.6 -3.2 ± 1.3 -2.6 ± 1.3 -1.0 ± 1.1 -0.8 ± 0.7 1.9 ± 1.9 -2.9 ± 2.3 -3.6 ± 2.8
P value 0.0201 0.0335 0.0204 0.0936 0.0047 0.0262 0.1315 0.1461
Table 2: Values of longitudinal and circumferential strain and SR in adults and children.
Apical 4 Chambers segmental mean Systolic Strain %
Bas Sept Mid Sept Ap sept Ap lat Mid lat Bas Lat
Children -20.6 ± 4.4 -20.9 ± 3.9 -25.4 ± 6.1 -19.8 ± 5.8 -23.3 ± 4.2 -22.9 ± 3.4
Adults -15.8 ± 3.5 -17.7 ± 4.1 -24.0 ± 0.8 19.9 ± 4.82 -18.9 ± 4.9 -17.9 ± 5.2
P value 0.0002 0.0133 0.4664 0.4236 0.0052 0.0013
Global mean circumferential Systolic Strain % by sections
Mitral Mid Ventricular Apex
Children -22 ± 4 -24 ± 6 -32 ± 7
Adults -21 ± 6 -22 ± 5 -27 ± 6
offer); however, in clinical practice it may be more diffi-cult to obtain a similar level of image quality and conse-quently the percentage of the feasibility of the measurements will go down. In our analysis we have done only partial observations about diastolic data since most of the video clips were recorded at a frame rate lower than 60 fps (between 40 to 60 fps) and this probably would have resulted in an underestimation of the peak values of those rapid events. The feasibility of these measurements was less in short axis views than in the long axis views: this could partially be consequent to the movements of the whole left ventricle in directions others than radial or cir-cumferential, partially to the quality of the images and also to the tracking accuracy of the algorithm in short axis.
The first issue is an intrinsic limitation of the 2D approach and it will probably be solved when the system will be applied to 3D echocardiography. On the other hand, rapid improvement in technology in terms of improved tracking of the algorithm and better lateral resolution of images even with higher image fps will enhance the results.
The assessment for longitudinal systolic ε and SR was 100% in apical 4C views, but it fell to 73% for ε and 64% for SR in apical 2C view. This was mainly due to the poor lateral resolution in the apical anterior segment, which is the most difficult segment to demark with an endocardial border.
Velocities regional analyses
Figure 4
Longitudinal strain regional analyses
Figure 5
Longitudinal strain regional analyses. Longitudinal strain values averaged by segment in a normal adult are reported; notice the increasing of Strain from base to apex of the septal segments.
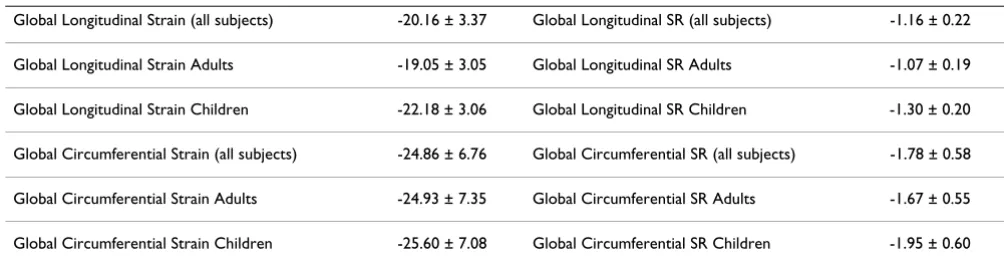
Table 3: Values of global longitudinal and circumferential Strain and SR in normal adults and children.
Global Longitudinal Strain (all subjects) -20.16 ± 3.37 Global Longitudinal SR (all subjects) -1.16 ± 0.22
Global Longitudinal Strain Adults -19.05 ± 3.05 Global Longitudinal SR Adults -1.07 ± 0.19
Global Longitudinal Strain Children -22.18 ± 3.06 Global Longitudinal SR Children -1.30 ± 0.20
Global Circumferential Strain (all subjects) -24.86 ± 6.76 Global Circumferential SR (all subjects) -1.78 ± 0.58
Global Circumferential Strain Adults -24.93 ± 7.35 Global Circumferential SR Adults -1.67 ± 0.55
Our results are very encouraging if we consider that in other studies (where 4C video-clips were analyzed with speckle tracking technology) 20% of the segments couldn't be processed [13]. Reference values derived in our study for longitudinal systolic velocity are similar to those reported using TDI and/or MRI [13,18-20] and con-firm that the longitudinal velocity decreases from base to apex. The significant increase of longitudinal ε and SR from base to apex observed in our study has not been detected with TDI [11] but has been reported with tagged MRI.
2D strain technologies have demonstrated their value in several clinical conditions and now that they have been shown to be highly accurate and reproducible, they are going to be applied in the large cardiac disease popula-tion, substituting the TDI technology that gives consistent but limited information in respect to 2D based technol-ogy.
Validation against MRI is recommended for all imaging technology and is widely considered to be the gold stand-ard because it allows the measurement all three velocity vectors and thus analyzes regional strain in three dimen-sions; but the peak values obtained with MRI must also be considered carefully because this technique has a lower temporal resolution compared to echocardiography, and, with 30 fps it could underestimate both diastolic and systolic values, especially when heart rate is rapid, as occurs in children [21,22].
Having derived the normal values for pediatric and young adult population it is now important to open up this excit-ing new field of basic science to study physiology of the ventricular function and its change with the human growth. This will also be very useful in the clinical assess-ment of segassess-mental and global ventricular function in con-genital heart disease where other echocardiographic parameters are often less applicable.
Conclusion
The major limitation of this study was that we were restricted in considering only the data for systolic events because the feasibility for diastolic events was consistently reduced, especially in short axis view. This was due to sub-optimal tracking followed by the algorithm but rapid evo-lution of ultrasound technology and improvement in soft-ware engineering will rapidly overcome this limitation.
2D based tissue tracking system is highly reliable and applicable for the study of systolic events in adults and children. Reference values for children and adults have been derived for various segments of myocardium and significant difference between adults and children in lon-gitudinal and circumferential Strain and SR has been
dem-onstrated. This difference is more evident in the circumferential strain of the apical segments.
The capability of this system to analyze curved segments as well as rectilinear segments consistently may provide valuable insights into physiology and patho-physiology of left ventricular function [23]. It will offer new possibil-ities for quantification of echocardiographic studies, which, until now, have been based mostly on calculation of volumes, thickness and blood flow analysis. With this new approach a direct quantification of segmental and global myocardial function will be feasible. To obtain this complete evaluation in the everyday practice, the echocar-diographic laboratories will need dedicated infrastructure for post-processing [24].
Competing interests
CB acted as consultant to ESAOTE in the development of the clinical software.
Authors' contributions
CB: Conceptualized and designed the study, executed all the echocardiographic exams, analyzed and interpreted the data, overviewed at the file processing and wrote the manuscript. AM: Reviewed the manuscript and made sub-stantial contribution to the conception and design of the study. MDD: Reviewed the manuscript, made substantial contribution of data interpretation, contributed to the sta-tistical analysis. BdeC: Contributed to drafting of the manuscript and statistical analysis. DN: Examined clini-cally all the subjects and participated in the post process-ing of echocardiographic files. EDA: Participated in the post processing of echocardiographic files and overviewed all data processing and collection. EL: Reviewed the man-uscript for relevant intellectual content. MCH: Made sub-stantial contribution to study conception and design. JSD: Reviewed the manuscript for relevant intellectual content. CA: Participated in the post processing of echocardio-graphic files and overviewed all data processing and col-lection. FM: Made substantial contribution to study conception and design. MC: Made substantial contribu-tion to study concepcontribu-tion and design.
References
1. Suffoletto M, Dohi K, Cannesson M, Saba S, Gorcsan J: Novel Speckle-Tracking Radial Strain From Routine Black-and-White Echocardiographic Images to Quantify Dyssynchrony and Predict Response to Cardiac Resynchronization Ther-apy. Circulation 2006, 113:960-968.
2. Ingul CB, Torp H, Aase SA, Berg S, Stoylen A, Slordahl SA: Auto-mated analysis of strain rate and strain: feasibility and clinical implications. J Am Soc Echocardiogr 2005, 18(5):411-8.
3. Ingul CB, Stoylen A, Slordahl SA: Recovery of stunned myocar-dium in acute myocardial infarction quantified by strain rate imaging: a clinical study. J Am Soc Echocardiogr 2005, 18(5):401-10.
Publish with BioMed Central and every scientist can read your work free of charge
"BioMed Central will be the most significant development for disseminating the results of biomedical researc h in our lifetime."
Sir Paul Nurse, Cancer Research UK
Your research papers will be:
available free of charge to the entire biomedical community
peer reviewed and published immediately upon acceptance
cited in PubMed and archived on PubMed Central
yours — you keep the copyright
Submit your manuscript here:
http://www.biomedcentral.com/info/publishing_adv.asp
BioMedcentral 5. D'hooge J, Heimdal A, Jamal F, Kukulski T, Bijnens B, Rademakers F,
Hatle L, Suetens P, Sutherland GR: Regional strain and strain rate measurements by cardiac ultrasound: principles, implemen-tation and limiimplemen-tations. Eur J Echocardiogr 2000, 1(3):154-70. 6. Kowalski M, Kukulski T, Jamal F, D'Hoogge J, Widemann F,
Rademak-ers F, Bijnens B, Hatle L, Sutherland GR: Can natural strain and strain rate quantify regional myocardial deformation? A study in healthy subjects. Ultrasound in Med & Biol 2001, 27:1087-97.
7. Edvardsen T, Gerber B, Garot J, Bluemke D, Lima J, Smiseth OA: Quantitative assessment of intrinsic regional myocardial deformation by Doppler strain rate echocardiography in humans: validation against three-dimensional tagged mag-netic resonance imaging. Circulation 2002, 106:50-6.
8. Singh A: Optic Flow Computation: A Unified Perspective. Pis-cataway, NJ: IEEE Comput. Soc. Press; 1992.
9. Storaa C, Aberg P, Lind B, Brodin LA: Effect of Angular Error on Tissue Doppler Velocities and Strain. Echocardiography 2003, 20:581-587.
10. Stefani L, Toncelli L, Gianassi M, Manetti P, Di Tante V, Vono M, Moretti A, Cappelli B, Pedrizzetti G, Galanti G: Two-dimensional tracking and TDI are consistent methods for evaluating myocardial longitudinal peak strain in left and right ventricle basal segments in athlete. Cardiovasc Ultrasound 2007, 5:7. 11. Lin LI-K: A concordance correlation coefficient to evaluate
reproducibility. Biometrics 1989, 45:255-268.
12. Lin LI-K: A note on the concordance correlation coefficient. Biometrics 2000, 56:324-325.
13. Pellerin D, Sharma R, Elliott P, Veyrat C: Tissue Doppler, strain, and strain rate echocardiography for the assessment of left and right systolic ventricular function. Heart 2003, 89(Suppl 3):iii9-17.
14. Kutty S, Deatsman S, Nugent M, Russell D, Frommelt P: Assessment of Regional Right Ventricular Velocities, Strain, and Dis-placement in Normal Children Using Velocity Vector Imag-ing. Echocardiography 2008, 25(3):294-307.
15. Carasso S, Yang H, Anna Woo A, Vannan MA, Jamorski M, Douglas M, Rakowski H: Systolic Myocardial Mechanics in Hyper-trophic Cardiomyopathy: Novel Concepts and Implications for Clinical Status. J Am Soc Echocardiogr 2008, 21(6):675-83. 16. Vannan MA, Pedrizzetti G, Li P, Gurudevan S, Houle H, Main J, Jackson
J, Nanda NC: Effect of cardiac resynchronization therapy on longitudinal and circumferential left ventricular mechanics by velocity vector imaging: description and initial clinical application of a novel method using high-frame rate B-mode echocardiographic images. Echocardiography 2006, 22:826-830. 17. Jurcut R, Pappas C, Masci PG, Herbots L, Szulik M, Bogaert J, Werf F
Van de, Desmet W, Rademakers F: Detection of Regional Myo-cardial Dysfunction in Patients with Acute MyoMyo-cardial Infarc-tion Using Velocity Vector Imaging. J Am Soc Echocardiogr 2008, 21(8):879-86.
18. Amundsen B, Helle-Valle T, Edvardsen T, Torp H, Crosby J, Lyseggen Asbjørn Støylen A, Ihlen H, Lima Smiseth O, Slørdahl S: Noninvasive Myocardial Strain Measurement by Speckle Tracking Echocardiography Validation Against Sonomicrometry and Tagged Magnetic Resonance Imaging. Journal of the American College of Cardiology 2006, 47(4):789-793.
19. Galiuto L, Ignone G, DeMaria AN: Contraction and relaxation velocities of the normal left ventricle using pulsed-wave tis-sue Doppler echocardiography. Am J Cardiol 1998, 81:609-14. 20. Petersen S, Jung B, Wiesmann F, Selvanayagam JB, Francis JM, Hennig
J, Neubauer S, Robson MD: Myocardial Tissue Phase Mapping with Cine Phase-Contrast MR Imaging: Regional Wall Motion Analysis in Healthy Volunteers. Radiology 2006, 238(3):816-826.
21. Weidemann F, Eyskens B, Jamal F, Mertens L, Kowalski M, D'Hooge J, Bijnens B, Gewillig M, Rademakers F, Hatle L, Sutherland GR: Quantification of Regional Left and Right Ventricular Radial and Longitudinal Function in Healthy Children Using Ultra-sound-Based Strain Rate and Strain Imaging. J Am Soc Echocar-diogr 2002, 15:20-28.
22. Moore CC, Lugo-Olivieri CH, McVeigh ER, Zerhouni EA: Three-dimensional systolic strain patterns in the normal human left ventricle: characterization with tagged MR imaging. Radiology 2000, 214:453-66.
23. Buckberg GD, Mahajan A, Jung B, Markl M, Hennig J, Ballester-Rodes M: MRI myocardial motion and fiber tracking: a confirmation of knowledge from different imaging modalities. European Journal of Cardio-thoracic Surgery 2006, 29S:S165-S177.